The 3 Bar Play: Raising the Bar on Your Day Trading Strategies + Video
Aug 18, 2021
Written by: John McDowell
The 3 Bar Play is the natural progression to the strategies we’ve discussed lately regarding the market open. It’s a great addition to the 1 Minute ORB and the other Opening Range Breakout strategies we discuss in the blog. Not only that, but it’s a popular strategy used by many day traders like Jared Wesley from LiveTraders, Oliver Velez from iFundTraders, or Sami Abusaad from T3Live.
Today we’ll cover the rules and criteria for spotting this pattern, along with the context you need for a successful trade. It can be a powerful strategy for managing risk during the volatility of the market open, and can lead to really nice gains.
But before diving in, be sure to check out this quick tutorial we’ve put together on how to practice this great strategy:
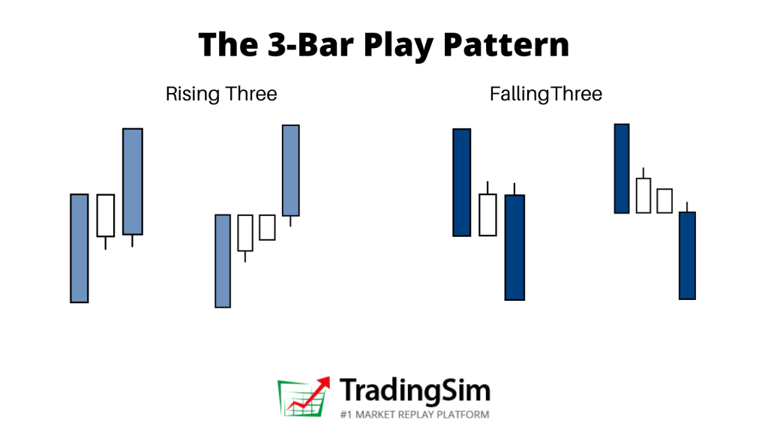
Rules for the 3 Bar Play
First off, you may be wondering why we’ve shown a few examples above with 4 bars instead of only 3. Technically, the pattern can have either. Sometimes it might have 5 bars as long as they are all intact and constructive.
Yes, you’d call it a 4 Bar Play if it has 4 bars. But for all intents and purposes, this strategy is known as the 3 Bar Play or 3-bar strategy.
The thing to keep in mind with this strategy is that the pullback bar(s), whether 1 or 2 of them, need to be few and they need to be tight.
To that end, let’s look at the three main rules for identifying a 3 bar play.
The first bar needs to be an “igniting” bar — a very wide range candle, ideally on high volume.
The pullback bar, or bar 2 (& 3), must not exceed 50% retracement of the 1st bar and have relatively equal highs.
The trigger bar (or expansion candle) should also be a nice marubozu candle to new highs or lows.
Entry is taken on the break of the smaller “inside candles” with a stop below them.
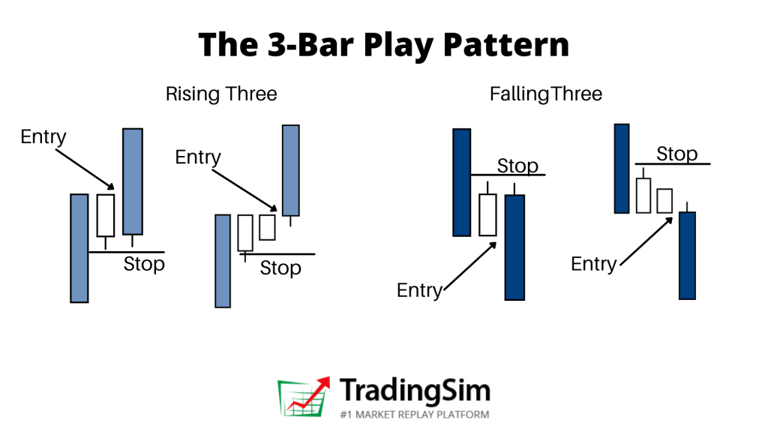
Here’s what this might look like for both long and short entries:
The 3 Bar Play entry and stop
Notice that this provides traders with a definable risk about halfway into the first igniting bar, or “Elephant bar” as Velez calls them. As a continuation play, you want to play in the primary direction of the gap or trend from the premarket.
Let’s look at handful of examples to build context for this strategy.
3 Bar Play Long Examples
Like we discussed above, the best scenario for these setups is as a continuation pattern. That is, if the stock is gapping up, ideally you want a continuation above resistance from either a daily or premarket level. A combination of both scenarios would be even better!
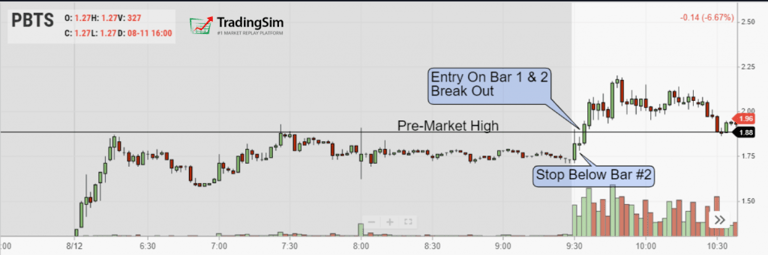
To that end, let’s look at this PBTS example.
PBTS 2 minute chart 3 Bar Play
On this morning, the stock was gapping considerably in the premarket with a nice consolidation into the open. On the open, the stock ramps up on the first 2 minute candle. It consolidates for one bar, then continues in the direction of the gap.
The second candle of the pattern was a tidy pullback on lower volume. Ideally, you set your entry just above this candle and the 1st candle. The breakout provided a nice gain of 16% from our entry in about 15 minutes.
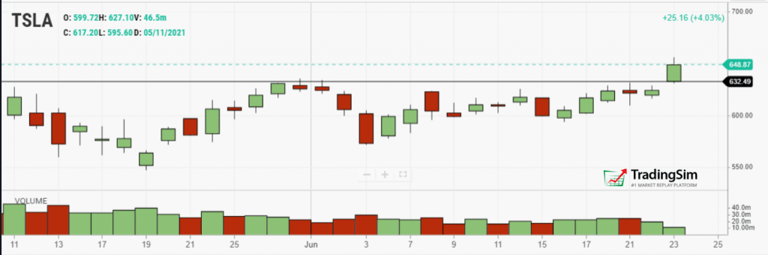
Long Example #2: TSLA
In this example, we are using the 1-minute chart to find our 3 Bar Play. Before we do, it is important to note that Tesla exploded out of a consolidation on the daily chart, which provided us the impetus to get long on this 3 bar play.
Notice the daily chart first with the resistance line drawn:
TSLA key levels daily
Zooming in now on the premarket and opening bell, we see that this line was a key level in the premarket as well. The importance here is that if this line is broken, we have nothing but “green pastures” above us.
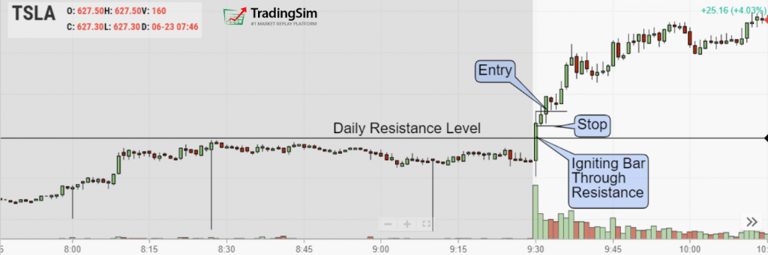
TSLA 3 Bar Play
Just as we have in our other examples, we get an igniting bar moving up and through resistance, a slight pause, and then a continuation.
Keep in mind, that the “pause” candle can be red or green, it doesn’t really matter. The important thing is that it doesn’t retrace too much of the first candle and forms near the top of that candle.
In this example with TSLA, we had a nice opportunity for a nearly $10 gain in a short amount of time. Great odds!
3 Bar Play Short Example
The great thing about the 3 Bar Play strategy is that it can be played in either direction. Just as you might look for stocks that are gapping up and/or breaking out on a daily time frame, the same can be applied for stocks breaking down.
To that end, let’s take a look at this example of OCGN.
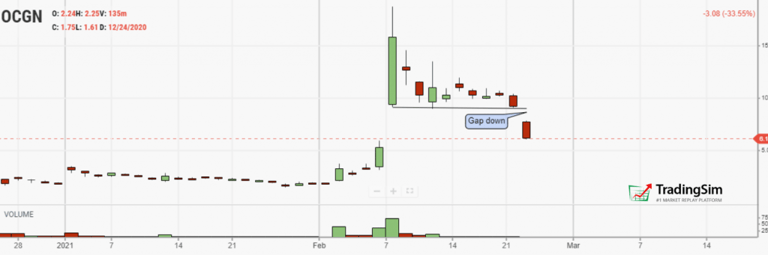
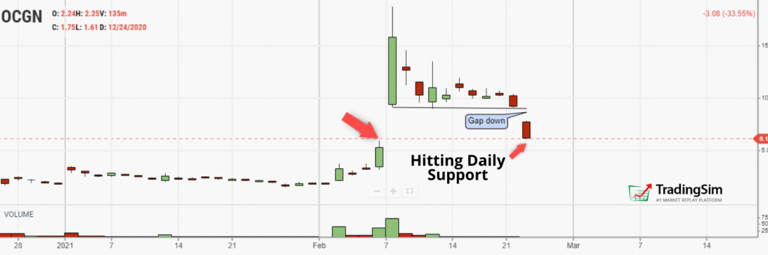
Notice that the daily chart here has a beautiful gap down through prior support. This sets the tone for us in the premarket.
OCGN daily chart gap down
The great thing about this strategy is that it’s easy to scan for gaps in the morning. All we have to do is analyze the bigger time frames for a nice continuation move once the market opens.
On that token, let’s look at the premarket and open for this particular day with OCGN:
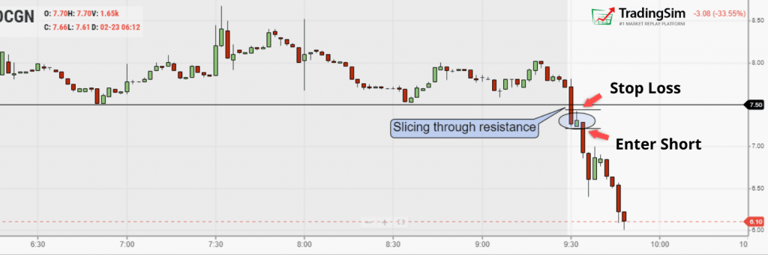
OCGN 2 minute 3 Bar Play
On this 2 minute chart, OCGN broke through premarket support at $7.50 very easily. We got a quick pause, then resumed with a beautiful trigger candle. This led to a quick $1.25 gain. Not bad for 15 minutes worth of work.
How to Manage a 3 Bar Play Position
At this point, you may be wondering how to manage a position when trading this strategy. There are a few things to consider for this.
If you are a beginner who is still exploring and educating himself on volume and price action, you may want to set hard and fast targets and stops.
We discuss this in other posts, but here are a handful of approaches you can take.
Take Profit at Specific R-values
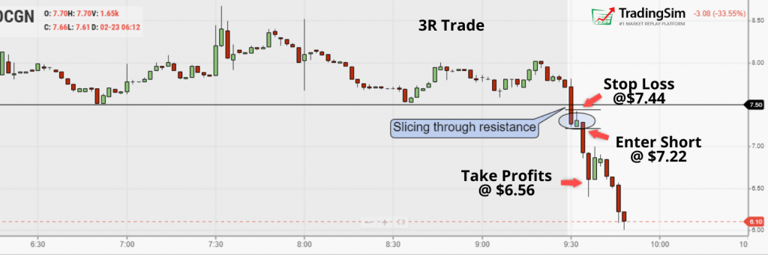
R-values are basically your risk/reward calculation. Let’s use the OCGN example above and say you entered short at $7.22. Using the $7.44 area as your stop noted on the chart, this means you’d be risking $0.22 for the trade.
To calculate your reward, you may think that a 2R or a 3R or a 4R is acceptable. If that is the case, you simple double, triple, or quadruple your risk.
For this example, a 3R trade would be 3 x $0.22 = $0.66. That means, from your entry, you’re looking to take profits at $7.22 – $0.66 = $6.56.
Therefore you would have set an order to take profits and cover at $6.56, which would have been towards the bottom of the second long-bodied red candle on the chart after your entry. Here’s what that would look like:
OCGN 3R 3 Bar Play
In other words, your trade was 1 risk unit to 3 reward units. And if this suits your personality, then stick to it. Granted, it’s a bit of an “all or nothing” type of strategy and you may stop out if your target isn’t hit and the stock reverses. But that’s the name of the game.
Over time, you may want to adjust your profit-taking rules to include trailing stops.
Now, you may be thinking, “But, look how much meat we left on that trade!”
Let’s take a look at how a higher time frame may have helped you gain more profit on this trade.
Higher Time-frame Support and Resistance
Returning to the daily chart of OCGN we can clearly see that it is “filling the gap” on the daily and running into potential support at this $6 level. As traders, we can use these levels to set potential targets.
OCGN daily support
Often times a stock is wont to find support at daily levels. This $6 level, which is also a “whole dollar” psychological level, did just that for OCGN. It coincided with the last candle high before the gap, as annotated on the chart.
Knowing this, the astute trader could have set this as a target regardless of the R-value. Or, he or she could have taken a partial at the 3R level at $6.56, and then taken the rest at this key level. It proved to be the bottom for OCGN on this day before reversing.
Even more advanced traders could have added to their position on the first pullback as the stock continued lower.
Either way, it’s usually best to keep things simple and pay yourself along the way.
Other Methods of Trade Management
Fibonacci lines and Pivot Points can be another great set of tools to identify areas to sell or cover. We cover those strategies in depth in the links provided.
To keep things simple, though, there is an old adage you should remember, “sell into strength.” The point here is to identify stocks that are “oversold” or “overextended” and sell or cover into those moves.
OCGN’s selloff was fast and furious off the open that morning. This kind of selling pressure isn’t sustainable for any normal stock.
Recognizing this, most traders will sell or cover into the excessive strength or weakness, knowing that a rally could be just around the corner.
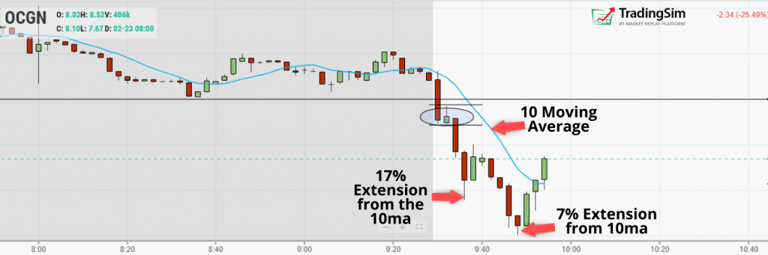
OCGN extension from 10 moving average
One way you might visualize an overextension is to judge how extended a stock is from its 10 or 20 moving averages. As shown in the chart above. OCGN was considerably extended from the blue 10ma on the chart. This is a good sign that the stock will reverse at some point.
There are a myriad of ways to manage trades, and all of them have their pros and cons. It’s really up to you to practice what works best for you in order to identify profit targets and take the emotions out of trading.
Practicing the 3 Bar Play
That brings us to our last point. No strategy is going to be perfect, but unless you know your probability for success through simulated trades, you’re literally gambling.
Untold amounts of stress and failure in the markets can be attributed to trading without an edge. For that reason, we suggest you do a quick search in the simulator for stocks that are gapping up or down in the premarket with some volume. Then, take that list of stocks and identify the best candidates for a 3 Bar Play.
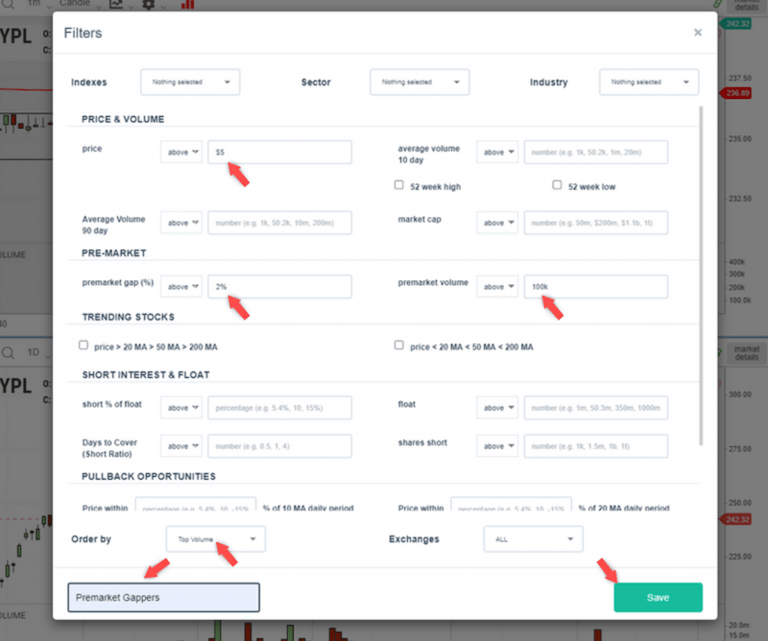
Here is an example of what that scan filter might look like for gap ups:
In this filter example, we’ve chosen stocks above $5 with a premarket gap minimum of 2% and at least 100k shares traded.
The rest is up to you. As we mentioned at the beginning of the article, there are a lot of great educators who teach this strategy through live trading and great video resources. Sami Abusaad, Jared Wesley, and Oliver Velez are just a few.
Be sure to check out their YouTube pages and give them a like.
How Oliver Velez Trades the Open Like a Boss: 4 Key Takeaways
How Oliver Velez trades the open is fun to watch. Thankfully, he shares a lot of his trading wisdom for free on YouTube. To that point, one really great free series he’s created is called “Trade the...
Most day traders have likely heard of the Opening Range Breakout (ORB) strategy popularized by Toby Crabel in his classic investing book Day Trading With Short Term Price Patterns and Opening Range...
In this article, I will cover two basic trading strategies you can utilize during the market open. But first, let’s discuss what drives the madness shortly after the opening bell. Like many other...


 Awesome Day Trading Strategies


