Volume is often considered the second most important data piece on a trading chart, right behind price. However, the truth is that they go hand in hand. Never has this been truer than with the inception of volume candlesticks.
In this article, we'll take a close look at how volume and volume candlesticks can benefit your trading. We'll analyze a few techniques for using volume. You'll want to add these to your playbook.
What Are Volume Candlesticks?
Whereas most price candlesticks tell you four bits of data, the open, the high, the low, and the close, volume candlesticks add a 5th dimension to the candle: volume. The width of the candle usually determines this. The fatter the candlestick, the more volume traded during that candle.

Essentially, the chart is taking the volume data from the bottom of the chart and adding it as an element of the candles themselves. Some may like this all-in-one approach, while others prefer to see volume only on a bar chart below the price candles.
Why Are Volume Candlesticks Important?
The answer to this lies in the importance of volume in general. As we have discussed before, volume is of utmost importance when trying to analyze a financial chart. Making trading decisions without volume is akin to reading a text message versus speaking face to face. Volume is the effort that goes into price action, and it tells us as traders a lot about what is going on behind the scenes.
For example, if the amount of volume falls off drastically, it could mean either a lack of demand or a lack of supply depending on the context. Similarly, an unusual amount of volume could signal high demand or high distribution depending on the context of the chart.
All of these things are tell-tale signs for experienced chartists. You should study volume and incorporate it into your technical analysis.
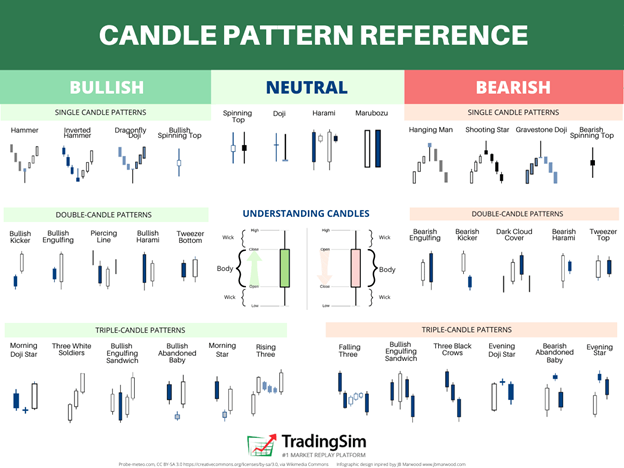
We've gone in-depth on how to understand candlestick patterns. If you haven't checked that guide out, head over and give it a good read or two. The only difference in candlestick patterns and volume candlestick patterns is the influence that volume has on the confirmation of these patterns.
More often than not, without a volume confirmation, you'll see candlestick patterns voided. This is why paying attention to the volume associated with patterns is so important.
To that end, let's take five of the most common volume candlestick patterns and analyze the importance of volume in these trade signals.
1. The Rising or Falling Three Pattern
The Rising Three Pattern is a simple pullback pattern when a financial instrument is increasing in value. The three small candles that pullback can provide a quick opportunity to jump on board while the progression pauses.

Notice in the example provided above that TSLA advanced above the $750 level on higher-than-average volume on the 21st of July. This was a solid breakout candle. It is easy to see how "fat" the candle is because of the excessive trading volume that day.
The ensuing 3 days allow you to take advantage of the advance by buying on a pullback into the body of the breakout candle. Notice the width of the volume candlesticks is discernibly narrower than the breakout candle, the body of the candles is much smaller, and the volume on these days is half what the breakout day brought.
This is confirmation that supply is drying up, allowing astute traders to purchase shares on the trendline break as volume resumes its uptrend along with price by the 27th.
Note that the Falling Three Pattern is the exact opposite of the Rising Three Pattern. It would allow you to short a stock on a snapback during a downtrend.
Bullish Shooting Star
The hammer (sometimes inverted) and shooting star are very similar reversal patterns. One occurs at the bottom of a trend reversal, and the other occurs at the top of a trend reversal. These usually work best on climactic volume signals. Let's take a look at an example of this on the daily chart of the S&P 500 index etf, SPY.

The first thing you should notice is the downtrend in the SPY from early February. However, this downtrend increased its intensity on the 7-10th of March. Notice those large, bold red volume candlesticks as the SPY declined down to the 380 level. This marked a climactic volume signature that culminated in an inverted hammer candle on the 13th of that month, denoted by the circle.
From that point, we see a rally in the opposite direction.
There are a few takeaways from this that you need to remember:
- The volume and price action both need to be accelerating in the direction of the trend.
- The volume on the day the hammer candle forms also needs to be elevated
- Price needs to reverse as volume carries it away from the hammer candle
Without the climactic price and volume confirmation, you may get an invalid hammer candle. This often occurs because there isn't enough washout to carry the instrument in a new direction. We call this a change of character.
The shooting star is very similar, it just occurs at the end of an uptrend.
Bullish Shooting Star
One of the best ways to signal exhaustion in a trend is to gap down or gap up above the prior day's price action, stall out, and then fall in the opposite direction. Think of it like an airplane that has gone straight up as far as gravity will let it, stalls out, and then begins free-falling back toward Earth. This is the thought process behind this pattern.
Let's analyze an example of when this happens.

Using TSLA as our guinea pig again, we see a very similar price action to the hammer pattern. The only difference is that the abandoned baby is a much smaller candle. Volume is still very high, as you can see. It increases into the reversal of the abandoned baby candle.
Price action is falling and accelerating rapidly, we gap down on the 18th, stall and churn volume as sellers are absorbed by buyers, and then the market makers gap it up the very next day. Whatever short sellers were still present are now capitulating, which adds to the volume of the second day -- the confirmation day.
This leads us to an extended rally out of the recent downtrend, enough for a very lucrative long opportunity.
As you can imagine, the bearish abandoned baby is just the mirror image of this. As a stock climbs and climbs, it eventually has a climactic gap, churns volume and price, then gaps down on the confirmation day.
4. Tweezer Top and Bottom
The tweezer top and tweezer bottom are also reversal patterns that give investors and traders clues as to the direction markets may go next. They occur at the top and bottom of trends. Let's look at an example of a tweezer top.

AAPL presented with a tweezer top recently. Whether or not it will lead to a longer-term correction is yet to be determined. (And that is something for you to be aware of -- not all trading signals will work long-term. For example, in a strong bull market, you might not expect a short-term reversal to last very long.) Yet, you can see the formation very clearly.
The tweezer top forms when you have two days that look almost like a mirror image of themselves. Bill O'Neil may have referred to these as railroad tracks because they are side-by-side with almost equal heights and widths, opens and closes. Additionally, the two upper wicks give off a nice "tweezer" look to the pattern.

Like with most reversal patterns, the tweezer bottom is nothing more than this exact pattern that reverses a downtrend. You'd look for the same qualities and take a long position once the pattern breaks the second day's highs.
Again, volume is important if you want to see a solid reversal. Notice that in the example we share above, volume doesn't appear to be very elevated, which may lead to a retest of the supply present in those candles.
5. The Bullish and Bearish Engulfing Volume Candlestick Patterns
The engulfing candles are particularly worrisome for trend followers as they can often signal a sudden shift in sentiment. It doesn't always come immediately following the candle, but it can at the very least signal a change of character.
The qualifications are a large engulfing candle that gaps in the direction of the prevailing trend, reverses course, and ends the day lower or higher than the prior day's candle. The key here is for it to occur on elevated volume.
Let's look at an example in the SPY that gave us a temporary shift in sentiment.

Notice how the three examples of volume candlesticks completely engulfed the prior day's candles. These candles occurred on a noticeably elevated volume signature, denoting weakness. Any short-term bulls should have been super cautious or peeling off their risk on these days.
You can see that these candles occurred very close to the top of the trend reversal. The last example actually occurred at the top.

Advanced Techniques and Tips
Combining volume candlesticks with other indicators may enhance your trade analysis. For example, combining volume candlesticks with indicators like MACD or moving averages can help you. Let's take a look at an example of each of these.
Using the 10 and 20 Simple Moving Averages
Here is a beautiful example of a 3-bar pullback on lighter volume at the edge of a breakout in NVDA. Notice how the first big candle occurs with big volume as well. Then, we get a series of three smaller candles, each with decreasing volume before the price breaks higher once again.

What's important about this picture is the retest of the 10 simple moving average on the third pullback day. This area provided support for the retest of supply, which as we can see from the diminishing volume signature was all but dry. This results in a move to higher prices as demand is in control at this point.
These prove to be great buy points as price pulls back on a retest after a breakout. It shakes out the weak hands and allows institutions and market makers to add those shares before taking the price of the stock higher. If you're a buyer here, you take the trade on the break higher after the third day.
MACD is a great way to analyze dying trends. A great way to use this is with the 5-minute MACD on an intraday chart right at the open. What you'll often find is that over-extended stocks will try to put in new highs but stall out. A great way to watch this play out is with the MACD.
In this example of NVDA, we have a 5m chart around 10 am New York Time. You'll see the circles denoting a cross in the moving averages on the chart as well as on the MACD simultaneously. The chart is using a 10 and 20 sma while the MACD is set to 6 and 20. Notice the decisive break lower shortly after the MACD cross.

What's great about this is that the signal flashes a reversal on the MACD around 11:20 am, signaling time to cover your shorts. This is a great little tool to take advantage of early morning breakouts or breakdowns.
One way to manage the trade would be to take the short as soon as the MACD crosses and set a stop near the most recent highs. Then simply cover some into a big washout and hold the rest into the reversal MACD cross.
Pitfalls to Avoid
As with any strategy in trading, one of the best ways to profit is to avoid silly mistakes. You'd be surprised at how much simple mistakes can cost you. With that in mind, let's look at five major pitfalls you'll want to avoid when relying on volume candlesticks for your trading strategies.
1. Ignoring Context
Volume nor price exist in a vacuum. You have to pay attention to the context the chart gives you. For example, ask yourself more questions like whether or not the stock is in an uptrend, downtrend, or sideways consolidation. What technical indicators are in play? What are the market dynamics? Be sure to consider the broader context of price action and market analysis before you take a gamble on a simple volume pattern.
2. Failing to Distinguish Between Accumulation and Distribution
Much like ignoring context, you may be considering other aspects of the chart, but fail to determine whether or not there is buying or selling in the tape. Not all volume spikes are going to represent accumulation. They could be distribution events where strong hands are selling into the hands of breakout buyers. This takes time, trial, and error to read. Make sure you analyze the differences with multiple charts in the trading simulator before assuming they are all equal.
3. Not Considering General Market Conditions
Bill O'Neil and Richard Wyckoff were famous for saying that most stocks follow the general market. To that end, if the market indices are weak or in a downtrend, you can usually expect stocks to follow. And vice versa. Consider this when analyzing volume trends and patterns. Is the volume spike at the end of a bull run or the start of a bull run? Is the market giving you favorable conditions for a continuation after a big volume spike? Consider these things.
4. Misinterpreting Low Liquidity Markets
Low-volume stocks, or illiquid stocks, can be difficult to read. This is because a single volume spike can send price into a frenzy. This may not be an accurate reflection of legitimate buying and selling interest. Be cautious in low-liquidity environments and take any volume spikes with a grain of salt.
5. Not Considering Time Frames
Multiple time-frame analysis is important no matter what strategy you use. This is especially true when you are day trading. A trade signal on the 1-minute chart may not represent the same on the 5-minute. We advocate for longer time-frame confirmations unless you're a hyper-scalper. The higher time frames usually lend credence to the volume signals and give you a bigger opportunity for profit.
How Can TradingSim Help?
These strategies may be a lot to digest. We get it. So to help you put it all into practice, we offer new subscribers a 7-day free trial of our trading simulator. It's a great way to get your feet wet and test new strategies without risking real money. Join us today and give volume candlesticks a trial run!

Key Takeaways [Updated May 2026]
- Volume candles size each bar by traded volume rather than time, which makes it easier to spot accumulation and distribution patterns the eye misses on a fixed-time chart.
- A wide-range up bar on rising volume is bullish confirmation; the same wide-range up bar on falling volume is a low-conviction move that often fades.
- Climax volume — the largest volume bar of a multi-day move — frequently marks short-term exhaustion. Trail stops, do not chase.
- Volume dry-up (a series of progressively smaller volume bars) inside a base is a constructive setup; it usually precedes a breakout, especially in stocks with strong relative strength.
- Pair volume candles with VWAP and relative volume (RVOL) to filter for the days where the pattern matters — TradingSim's replay engine lets you rehearse this read across thousands of historical sessions.
Frequently Asked Questions
What are volume candles?
Volume candles are candlestick charts where each candle's width or weighting reflects the volume traded during that bar, not just time. They surface accumulation and distribution that a standard time-based chart can hide because high-volume bars visually dominate low-volume bars.
How do you confirm a breakout with volume?
A valid breakout typically prints a wide-range up candle that closes near its high on at least 1.5x the 20-period average volume. Anything less — narrow range, weak close, or below-average volume — is a low-quality breakout that frequently fails inside the first 30 minutes.
What is climax volume in candlestick analysis?
Climax volume is the largest single-bar volume of a sustained directional move. After a multi-day rally, an outsized volume bar that fails to make meaningful price progress is often a short-term top — a sign that the supply/demand imbalance has shifted.
Do volume candles work for day trading?
Yes, especially on 1-minute and 5-minute charts during the 9:30–11:00 a.m. ET high-liquidity window. Day traders use volume candles to identify the bar where a stock changes character — for example, a wide-range up bar on outsized volume coming off VWAP.
What is volume dry-up?
Volume dry-up describes a sequence of declining volume bars while price consolidates inside a base or pullback. It signals that sellers are no longer pressing the stock. When volume returns alongside a breakout candle, it's a high-probability long entry trigger.
Related Reading from TradingSim
Want to test these ideas without risking capital? TradingSim's market replay simulator lets you practice on real historical sessions for both equities and futures, including micro futures.


 Volume Indicators


