

Trading Basics
Brush up on your trading basics from types of orders to money management you'll learn it all!
.png?width=594&height=198&name=TRADING%20BASICS%20(1).png)
Trading Basics
Trading stocks, forex or other financial instruments can be a profitable venture. Every day, new traders step into financial markets to trade in an effort to earn a profit on their capital, yet only a handful of them end up becoming professional and profitable traders. So, to start your trading journey, your first step should be to learn a few trading basics to increase your chances of becoming a successful trader.
We’ll answer the common questions you have like “What are the different types of orders in stocks?” and “How to manage money when trading stocks?” We’ll even tell you how much you might need to get started, the type of salary you can expect, and more.
Let's start with understanding the types of orders you can place when trading stocks or other financial instruments.
Types of Orders
Brokers offer online trading platforms to traders for buying and selling stocks, and traders can place different types of orders to trade stocks on their platforms. Order types give traders greater control over their trading and give them plenty of options to set different conditions and parameters for buying and selling stocks.
In the following section, we list and explain common types of orders, which you can use to buy and sell stocks at the best possible prices.
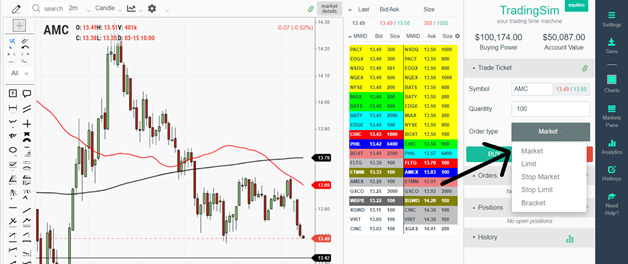
Market Order
A market order allows you to buy or sell a stock or security at the best available market price. For example, if you want to buy Apple stock (AAPL) at its current market price of $174 per share, you can do so by placing a market order.
Similarly, if you want to sell the stock at the current market price, you need to place a market sell order.
The market order is a quick way to buy or sell stocks or securities as your order would be fulfilled at the current market price rather than at the price above or below it.
Limit Order
A limit order allows you to buy or sell a stock or security at your specified price, which can be above or below the market price. A limit order has four types: buy limit order, sell limit order, buy stop order, and sell stop order.
Buy Limit Order
A buy limit order allows you to buy a stock below the market price. For example, if the market price of Facebook is $20 but you think that the price is too high and, instead, want to buy it for $15, you can place a buy limit order for $15.
Your order would remain pending until the market price drops to your specified price of $15 per share. If the price does not decline to your specified price, the order won't be fulfilled.
Sell Limit Order
A sell limit order allows you to sell a stock above the market price. If you want to sell a stock at a price higher than the market price, you need to place a sell limit order.
For example, if the market price of a stock is $20 but you want to sell it for $25, you can place a sell limit order and input $25 as your desired price. The order will be executed when the market price climbs to your specified price. But if the price does not rise to your specified price, the order will remain unexecuted.
Buy Stop Order
Buy stop order is a limit order that allows traders to buy or sell a stock after the price reaches a specified level.
For example, if you want to buy a stock if it breaks its price range of $9 and $10, you can place a buy stop order and specify a price a few cents above $10. The order would be triggered as soon as the market price hits the strike price, turning the order into a limit or market order, which would fulfill your order at the market price or your specified price.
Buy stop orders can also be used for covering your short position. For example, if you have opened a short position in a stock, you would sustain losses if the stock price rises.
To cover your downside risk, you can open a buy-stop order and set the strike price above your entry price. If the price rises and reaches your specified strike price, the order would turn into a limit or market order, which would close your position and limit your losses on your short position.
Sell Stop Order
Sell stop order, like a buy stop order, is triggered when the price reaches a certain level specified by you. It can be used to cover your downside risk on a long position and to execute a short-sell strategy.
For example, if you have bought a stock for $20 per share, you would like to cover your downside risk by placing a sell stop order with a strike or trigger price of $18 or any other level below the current market price.
If the price falls and reaches $18 or lower, the order would be turned into a limit or market order and fulfilled at the best price available.
Stop-Loss Order
Stop-loss orders, as the name suggests, protects you from losses if a trade goes against you. The order works for both long and short positions and will close your positions once the price hits your target level.
A stop-loss order remains dormant but turns into a market order as soon as the price reaches your strike or stop-loss point. In contrast, buy and sell stop orders remain active from the onset and turn into a market or limit order when the price hits your specified point.
Take Profit Order
Unlike a stop-loss order that limits your losses, take-profit order protects your gains from eroding and helps you lock in some of your profits from a position.
For example, if you bought a stock for $50 and the price rises to $60, your gain from the position is $10 per share. However, if you fear that the prices might recede, you can input a take profit order and set a take-profit point at anywhere below $60, the current market price, to lock in your gains. If the price recedes below $60 and hits your take-profit point, the order would be triggered and your position would be closed.
Money Management
Money management is one of the most important concepts of trading. In this section, we will explain in detail what money management is, why you should employ risk management techniques, and how you can mitigate risk using money management strategies.
What is Money Management?
Money management refers to keeping downside risk on each of your trades at manageable levels so as to preserve your capital. Money management is based on the idea that protecting your capital should be your first goal and that every trade you open should be based on money management principles.
Risk and Money Management in Trading
Failing to employ risk management principles is one of the primary reasons why most traders remain unprofitable in trading. Some traders rely on trade setups and exotic trading strategies that might work in some cases, but without risk management measures, they won’t yield desired results in the long run.
Why Should You Employ Risk Management Techniques in Your Trading?
Money management detaches you from your trades, which means that you are unconcerned with your trade’s outcome as it is based purely on your trading system and risk management techniques.
When you use risk mitigation techniques, the stop-loss triggers automatically. So, you don’t have to cling to your losing trades, hoping against hope that they would recover their losses, only to see them getting deeper into losses.
How You Can Mitigate Risk Using Risk Management Techniques?
Let’s discuss some common yet effective risk management techniques that you can implement in your trading:
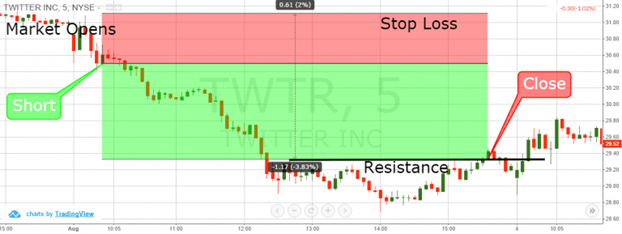
Choose Stop-loss and Take-Profit Points
You should plan your stop-loss and take-profit points for every trade even before placing a buy or sell order. When you set take-profit and stop-loss points beforehand, you take emotions out of the equation, eliminate the need for trade management, and reduce stress.
A stop-loss ensures that the losses are kept at a minimum while you strive to generate disproportionate profits.
Here’s an example of what this might look like in a winning short position:
Never Risk More Than 1% of Your Account on a Trade
Experienced traders never risk more than 1% of their account balance on a single trade. For example, if your account balance is $5,000, you can open a trade worth $5,000 - or higher if you use leverage - but risk only 1% of your balance ($5,000 x 1% = $50) or $50 on each trade.
This would ensure that you stay in the market for the long term and not blow up your account quickly in a few trades. We discuss this technique and the Kelly Criteria more in-depth in our SimCast interview with Kris Verma.
Determine Optimal Position Size
Optimal trade size means opening a trading position that corresponds with your risk level and stop-loss point.
For example, if you have determined that you can only risk 1% of $5,000 ($50) on a particular trade, you can buy 100 shares worth $50 each with a $0.50 stop-loss point. Alternatively, you can consider buying 50 shares worth $100 each with a $1 stop loss point.
A higher account balance gives you more leeway in setting stop-loss points and position size. Even if you use leverage, you should still keep your risk down to 1% of your account balance on each trade.
Take Trades with High Risk-Reward Ratios
Even the best risk management strategy cannot protect your capital if the risk-reward ratio of your trades is not favorable. Risk-reward ratio determines the amount of money you want to generate for every dollar you risk on a trade.
For example, if you are risking $50 or 1% of your $5,000 account, you should aim to earn at least $150 or 3% of your account balance. Expert traders recommend taking high-probability trades with a risk-reward ratio of at least 1:3. A risk-reward ratio of 1:3 means that you earn $3 for every $1 you risk.
With a risk-reward ratio of 1:3, you can be profitable or at a good standing even if you have one winning trade after every two losing trades because you earn as much as three times on your winning trades in comparison with your losing trades.
Starting Capital for Day Trading
In the United States, the legal minimum balance requirement for starting day trading is $25,000. You need to keep your balance above the $25,000 level to continue trading. If at any point your balance drops below the legal minimum level, you will be barred from day trading. This is called the Pattern Day Trading (PDT) rule.
There are some caveats to this rule, however. For example, there are international brokerages which can circumvent this rule. You might also be able to open multiple cash accounts, but your available day trades will always be limited. We discuss this rule more in depth here.
What is a good starting capital for day trading?
While you can start day trading with a $25,000 initial balance, you should start from a balance higher than the minimum threshold as your balance might drop below the minimum requirements after your initial trades. To give yourself some wiggle room and the flexibility to execute different trading strategies, $30,000 could be a decent capital to start with.
You can risk $300 per trade and place stop-loss points comfortably at strategic levels with a balance of $30,000. The minimum lot size of most stocks is 100 shares with a tick size of $0.01, which means that you can set stop-loss as wide as $3 per share and trade even volatile stocks with ease.
Day traders are allowed to use leverage up to four times their account balance. You can open trades worth $120,000 ($30,000 x 4) if you take leverage equivalent to four times your account balance of $30,000.
However, you should remember that you should not risk more than 1% of your account balance excluding the leveraged amount. Also, you should calculate the optimal trade size keeping in view your stop-loss point and risk per trade because leverage can lose you a significant amount of money if you are not careful.
Day Trading Salary
Day trading, undoubtedly, has the potential to earn you plenty of money. You might have seen various personalities on the internet and social media platforms claiming to have earned fortunes from day trading.
New traders often ask how much they can earn on average as beginner day traders. The question is an important one, but sadly there is no definite or absolute figure. The average amount you can earn day trading depends on countless factors and varies from trader to trader.
As per estimates, around 90% of retail traders lose money, which means that there is a greater likelihood that you would be among the 90% of unprofitable traders. But that also doesn't mean that you should give up trading altogether assuming that you can never make money trading.
You need to be disciplined and set smaller, achievable goals. In fact, your priority during your early days of trading should be to protect your capital and not try to achieve large profits.
When you get yourself familiar with the market and have mastered the art of risk management, you can go for making money. Some traders take high leverage and open large positions to generate hefty profit, but they end up struggling with managing their position as emotions start to kick in.
As soon positions turn red, you do not find the courage to close your losing trade to stop your losses, but you find the courage to end your winning trade midway and leave the money on the table.
While there is no definitive answer on the average amount of money you can make as an independent day trader, you can vie to become a better trader with each passing day.
Day Trading Average Salary
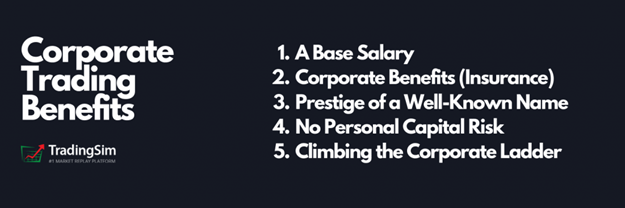
While you can start day trading on your own without much difficulty, you can also get a job at trading firms where you can earn a reasonable salary without risking your own money.
As we discuss in another article, an average day trader earned around $82,000 per year in 2020 based on 1,694 salaries posted on the website. On the flip side, traders at premium banks, such as Bank of America and Morgan Stanley earn around $280,000 per year on average.
The remuneration of a trader in CitiBank can be as high as $500,000. Private hedge fund managers and high net worth money managers get even higher salaries.
How to Make a Salary Day Trading?
If you want to get a job as a day trader in a trading firm or a financial institution, you might require a Series 7 or Series 63 license. The Series 7 license allows you to trade within the Federal level, whereas the Series 63 license allows you to trade within the boundaries of the state.
The base salary of an entry-level day trader as of 2020 was in the $50,000 to $70,000 range. However, you need to deliver decent returns and continue your performance in order to continue your job. The salary you get as a day trader, as per some estimates, is around 10% to 30% of the profit you generate for the firm.
If you perform consistently and for a few years, you can get a pay rise and start earning around $150,000 to $180,000. In the nutshell, if you earn money consistently for the firm, you would keep your job and also earn a decent amount of money.
Stock Earnings
Earnings represent the net income or net profit generated by a company in a particular period. It is found by deducting all kinds of expenses the company incurred during a period from the company’s revenue or sales it generated during the period.
For example, if a company's revenue or sales amounted to $100 million in a year, whereas its cumulative expenses amounted to $50 million in a year, the company’s net profit or earnings for the year would be $50 million.
What are Stock Earnings?
Analysts try to estimate the earnings of many popular companies to determine the future direction of their stocks and make an investment case. Earnings are reported in various forms, such as gross income, net income, and earnings per share.
The gross income of a company is calculated by subtracting the cost of goods sold from revenues. Net income is calculated by deducting operating expenses and taxes from its gross profit. However, if the company’s revenues are not sufficient to cover its expenses, it would report a gross and net loss.
Earnings per share or EPS of a company is calculated by dividing its net income by the total number of common stock shares outstanding. For example, if a company’s net income for a period was $10 million, whereas its average number of common stock outstanding during the period was 5 million, the earnings per share or EPS would be $2 for the period.
How Earnings Affect Stock Price?
Investors analyze various financial metrics, such as revenue, earnings, Earning Per Share (EPS), EPS growth rate, and a range of other measures to determine the financial health of a company.
The growth rate in EPS denotes that the company is growing its earnings over a period, which usually lifts its stock price on the stock market. If the earnings growth rate beats analysts’ estimates, the stock usually rises appreciably as investors price in new information in its stock price.
Sometimes, when a company releases its earnings reports overnight or after the market closes, depending on the market’s interpretation of the results, its stock price gaps up or down at the start of the next trading day.
For example, if a company reports upbeat earnings and healthy overall financial results, its stock usually gaps up the next trading day, which means that investors are willing to buy its shares at a premium. Similarly, if a company reports disappointing earnings and results, its stock usually gets a beating and plummets. This doesn’t always happen that way, however, and many investors are often confounded by the contrary reaction to earnings.
How to Calculate Potential Stock Earnings?
Seasoned investors and analysts closely analyze the financial statements of a company and follow company-related developments in the news to estimate its potential earnings for the upcoming period.
Some companies also provide future earnings guidance along with their financial results that can be a reasonable benchmark to predict their potential stock earnings. In a nutshell, you need to consume all the publicly available information about the industry and the company to make a knowledgeable guess about its potential earnings for the upcoming period.
We suggest leaving it to the pros. After all, the price of the stock will be the final arbiter regardless of the earnings report or estimate.
Systems and Platform
A trading system is a program that identifies trading opportunities based on defined criteria and conditions. When these conditions and criteria are met, the system notifies you or places a trade as per the programmed instructions in the system.
Day trading requires you to process information quickly and act fastly to benefit from small profitable opportunities. While you can execute day trading manually, a vast number of traders are investing in advanced automatic trading systems and platforms to come at par with big financial institutions who have access to the most advanced trading systems and expertise.
Characteristics of a Robust Trading System
There are plenty of trading systems and trading platforms available on the market. A good trading system should have the following important characteristics.
Sound Strategy
An efficient trading system is based on a sound strategy that is practical and backed by verifiable results. The strategy should be easily programmable to create a trading system.
Be Simple
Your trading system should be simple and not overly complex as it can be confusing and may generate false signals. A simple trading strategy can be easily programmed into a trading system. While it may generate fewer signals, the signals generated by a simple system are more likely to be strong and yield better results.
Work in different market conditions
Market conditions change quite often, and your system should be capable of adapting to those changing conditions. It should perform reasonably well when the market is in a trend or when it is in a range-bound condition. It would be even better if you backtest the system under various scenarios and also use it in real market conditions in demo mode.
High Profitability
Your trading system should be able to identify high profitability trades as small gains can be quickly decimated by one or two large losing trades. High probability and profitability trades are what make a trading system worth your time, effort, and money.
Trading Platform
A trading platform allows you to place your trades online and execute your trading strategies using various built-in tools, such as price charts, technical indicators, and others. Brokers offer different third-party and proprietary trading platforms to their clients for trading the markets.
The market is replete with countless trading platforms, but only a handful of them are popular and are being used by millions of traders.
If you’re looking for a good comparison of the best simulation platforms available, we’ve compared the top 4 simulator platforms for you here.
Characteristics of a Robust Trading Platform
You should look for the following qualities in a trading platform:
Order Types
Day traders have to frequently place different types of orders under different market conditions to execute their trading strategies. Traders also use stop-loss orders and take-profit orders as part of their risk management strategies.
Trailing stop loss is another frequently-used order that traders like to have in their platforms. So, a trading platform should have all the important order types, which would give you great control over your trading.
Trading Charts
A trading platform should give you access to a wide range of price charts for analyzing the price action. Candlestick charts, bar charts, and line charts are some of the common types of charts that your trading platform should have.
It is important that trading charts are also available on mobile platforms so that you never miss an opportunity even when you are away from your computer.
Technical Indicators
Technical indicators aid traders in understanding price action, which help them execute their trading strategies effectively. Some trading strategies require a combination of indicators, so it is essential that your trading platform has all the necessary indicators to successfully carry out those strategies.
Mobile and Web Trading
Your trading platform should be accessible on all devices, including smartphones, and work across all operating systems. Nowadays, various brokers offer trading platforms with complete functionalities and features even on smartphones.
A trading platform should also be accessible on the web so that you don't have to install the package before operating it, which removes a lot of inconveniences.
Trade Automation
Day trading has become extremely fast, and a delay of seconds could deprive you of profitable trading opportunities. To remove the limitations of manual trading, many trading platforms now allow you to automate your trading.
With automatic trading, your trading platform places trades automatically for you, based on the trading criteria set by you. It is an essential feature that can set you apart from other traders and significantly improve your trading performance.
Day Trading Taxes
The returns you earn from day trading are taxable, so it is important to understand how taxes can impact your earnings. In this section, we explain the types of taxes you have to pay on your earnings from day trading and the impact of day trading on the amount of taxes you pay.
Taxes on Day Trading
The IRS (Inland Revenue Service) identifies stocks as capital assets and levies a capital gain tax on the gains generated from trading them for profit.
For example, if you bought a stock for $100 and sold it for $110, you made a gain of $10 per share, on which you will have to pay capital gain tax. However, if you sold the same stock for $90, you would have a loss of $10, which is called a capital loss.
The rate of capital gain tax you pay depends on how long you held the asset for generating profit. The IRS charges variable capital gain tax rates of 0%, 15% or 20% tax rates on securities held for longer than a year. The higher the holding period, the lower the tax rate charged.
In contrast, if you generate profit on securities held for periods shorter than 12 months, you would be charged capital gain tax at your ordinary income tax rate. Gains generated from day trading can increase your income and may push you into a higher income tax bracket and, consequently, increase your tax liability.
Theoretically, you can be taxed as high as 37% for your short-term capital gains, which is the tax charged on the highest ordinary income bracket.
How Much Taxes Do You Pay on Day Trading?
Day-trading transactions are reported on IRS Form 8949. However, you should ensure that the transactions on the form match with the statement reported by your broker on Form 1099-B. The capital gain or losses are calculated on Schedule D form, which is attached with Form 1040.
You can reduce your income tax liability if you incur net capital losses. The IRS allows you to deduct capital losses up to $3,000 from your income if you are filing individually. The deduction limit is $1,500 if you are married and filing jointly.
However, you must understand the wash sale rule while gaining income tax deduction. The rule states that you can’t hold stocks within 30 days before or after the holding period for which you are claiming a tax deduction.
The IRS doesn’t allow deduction of capital losses for tax purposes on wash sales.
How Does Day Trading Affect Taxes?
Gains from day trading and long-term investing are taxed at different rates. If you are involved in day trading, you will be taxed at the same rate as your normal income tax rate. The ordinary individual income tax rates in the U.S for the year 2021 range between 10% and 37%.
If day trading is your only income, you will be taxed at the rate anywhere between 10% and 37%, depending on your income bracket.
Market Cap
Market capitalization, or simply market cap, refers to the total market value of a publicly listed company. It is calculated by multiplying the total number of outstanding shares by their current market price.
For example, if a company has 1 million shares outstanding and the market price of its share is $20, the market capitalization would be $20 million.
Market capitalization is used to compare the relative sizes of different companies.
Companies with a market capitalization of $10 billion or more are called large-cap companies. Mid-cap companies have a market capitalization between $2 billion and $10 billion. Companies with a market capitalization below $300 million are categorized into small-cap companies.
Liquidity
The liquidity of an asset or a security refers to how quickly and easily it could be sold and converted to cash on the market without impacting its price.
For example, most stocks are highly liquid as they could be sold in a matter of seconds on the stock exchange without impacting their prices. Real estate, on the other hand, is considered an illiquid asset as it could not be sold as quickly as financial securities like stocks. You might not find a buyer for your real estate property, and even if you do find a potential buyer, you might not settle on the price.
Liquidity could also refer to the ability of a company to use its short-term or liquid assets such as cash to meet its short-term liabilities. One common measure of a company's liquidity is the current ratio, which is calculated by dividing its total current assets by its total current liabilities.
A ratio of 1 is considered a healthy number, but the number is not absolute and more insights could be gained if you compare it with that of other companies.
Float Data
Float refers to a company's total number of shares outstanding less the shares that are under some form of restriction from being traded. For example, if a company has 1 million shares outstanding with 0.1 million shares under sale restriction, the company's float would be 0.9 million shares.
The float determines the total number of shares available for trading. The restricted shares are mostly held by company insiders that are barred from selling them on an exchange. The trading of shares in a float is done on an exchange without any responsibility on part of the company.
Float differs from authorized shares, which refer to the total number of shares a company is legally authorized to issue. Outstanding shares consist of all the shares of a company available for trading to the general public, including the restricted shares, in the secondary market.
Key Takeaways
As you can see, there are quite a few topics to discuss when it comes to day trading basics. We hope this has served as a starting point for you. We also encourage you to continue your education in the markets by using our free resources here at TradingSim. There’s really no better place to start with zero risk.
Love these and want more?
Stay in the know
Make the most out of every trade!