The classic version of the abcd trading pattern is a harmonic pattern consisting of two equal legs A-B and C-D. As a day trading pattern, these two intraday swings are connected by a countertrend (smaller) leg from B-C. There are variations of the pattern, like an ABCD extension, as well an interpretation that is more like a cup and handle pattern popularized by InvestorsUnderground.com
In this tutorial, we'll cover all the bases and discuss the basics of the abcd pattern and how to trade it.

Bear Flag Pattern
The abcd pattern in trading is an intraday chart pattern that reflects the natural movement of the market. It consists of an initial leg up or leg down followed by a short consolidation and then another leg up or down in the direction of the original move. It looks a lot like a zig-zag.
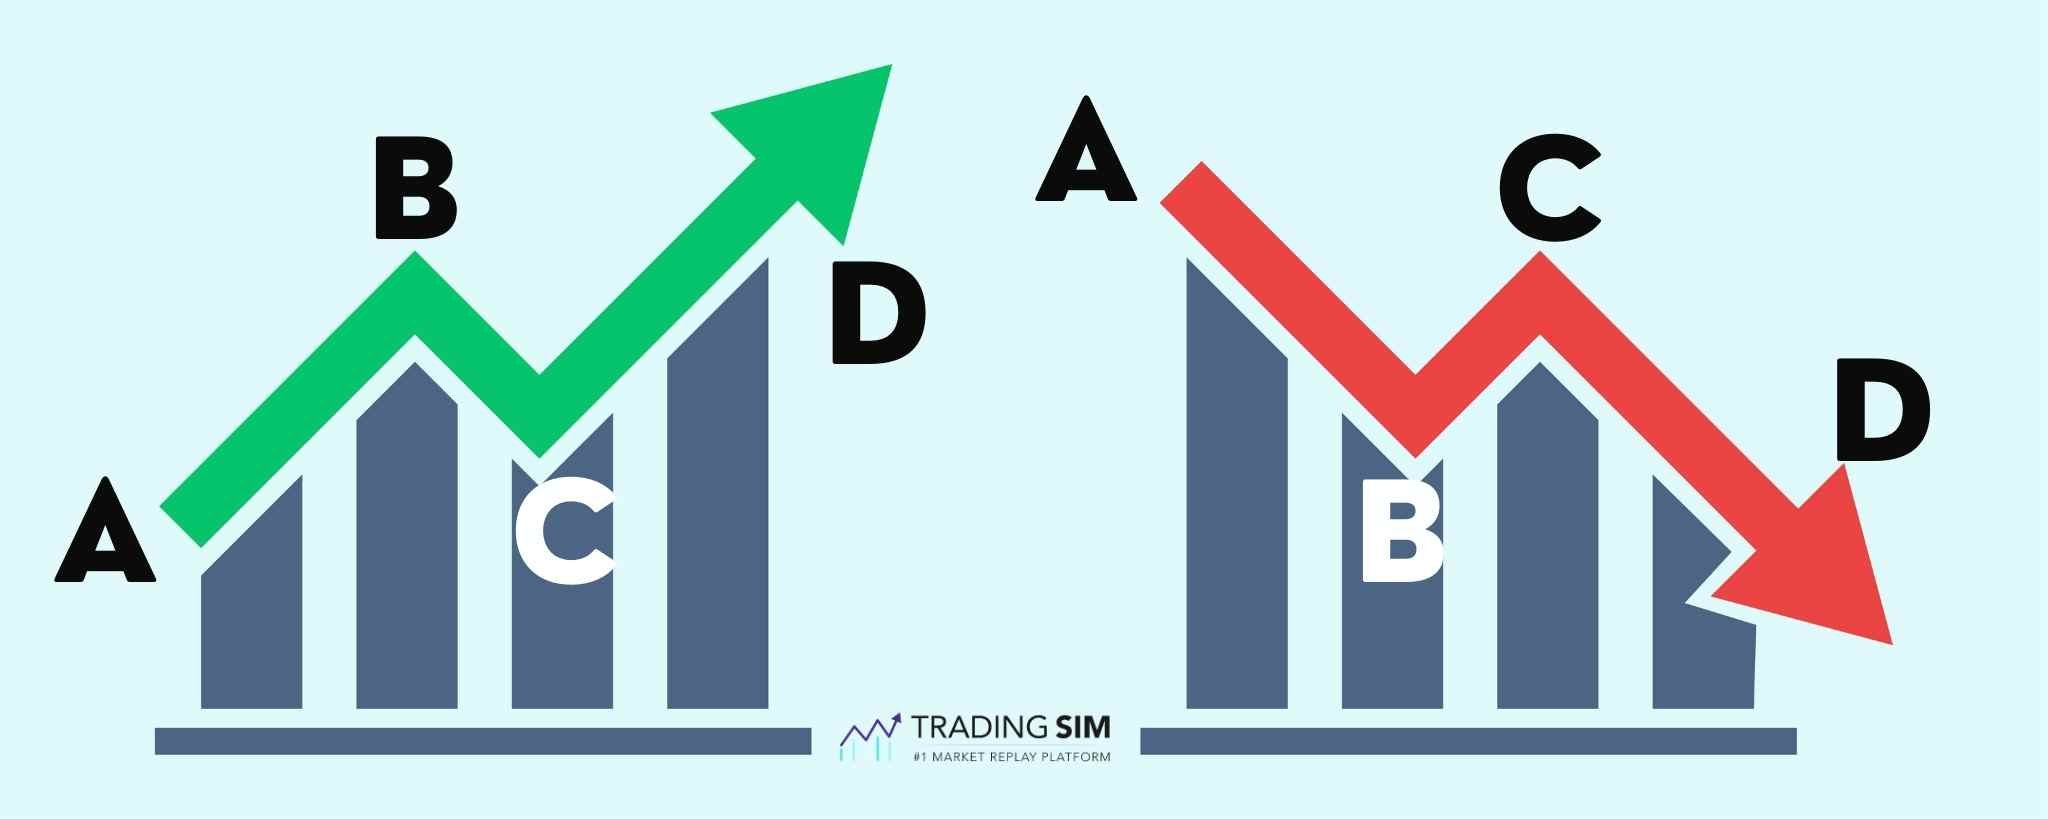
The pattern is often used to predict a trend continuation or a trend reversal depending on where your entry is taken. This also depends a lot upon where the "D" area of the pattern coincides with support or resistance.
Bear Flag Pattern
Typically, an abcd pattern in trading that is pointing upward is an indication of a bearish reversal. The initial intrada swing from A to B consolidates briefly in B to C. Then, once the C to D portion of the move is complete, it often signals a bearish reversal. From A-B and C-D bulls are pushing the stock higher and higher with aggressive demand. It is also why the consolidation in C produces a higher low.
Conversely, in a downtrend, sellers are in control the entire way from A to D. However, like the long example, the idea is that once sellers have a "three-wave" move down, it will likely result in a near-term reversal pattern at D. Thus, the classical example of an abcd pattern predicts that in a downtrend "D" is an area to go long.
The ABCD pattern is a four-point reversal pattern that I have traded thousands of times over the past 20 years. It forms when price moves from point A to B in a strong impulse, retraces to point C, then extends to point D creating a predictable structure. What makes the ABCD pattern reliable is its alignment with Fibonacci retracement levels. When point C holds at a 61.8 percent or 78.6 percent retracement of the AB move, and D extends to a 127 percent or 161.8 percent projection, you are looking at a high-probability entry zone. I use this pattern because it removes guesswork from my trading. Instead of chasing random price action, I wait for this specific geometry to develop on the chart. The pattern works across all timeframes and markets because price behavior is fractal, repeating the same structure whether you are watching a 5-minute chart or a weekly chart.
Identifying an ABCD pattern on a chart requires training your eye to spot four specific price points. First, look for a clear impulse move from A to B with strong momentum and ideally above-average volume. Then watch for the retracement from B to C, which should land between 50 percent and 78.6 percent of the AB distance. If the pullback is too shallow the pattern lacks power, and if it retraces too deep it is likely just noise. The final leg from C to D extends beyond point B, measured using Fibonacci projections at 127.2 percent or 161.8 percent of the BC move. I always confirm the pattern with volume analysis. The AB leg should show expanding volume, the BC retracement should have declining volume, and the CD leg needs to show volume picking back up as price approaches the D completion zone.
How to Draw an ABCD pattern?
In order to draw the ABCD pattern for day trading, you will need to identify the first leg from A to B. This needs to be a strong move up or down. Once you identify this first leg, you can then anticipate the B to C pullback. To draw it correctly, wait for the top or bottom to form on the B to C pullback, then you can attach this line to the first line you draw from the high of A to the low of B. Lastly, you'll start your third and final trendline from the high of C to the low of D.
It should look something like this:

Another school of thought connects the middle of the trend. You can see in this next image that we have connected the middle of the B to C pullback instead of the high and low. This creates a more symmetrical abcd pattern.
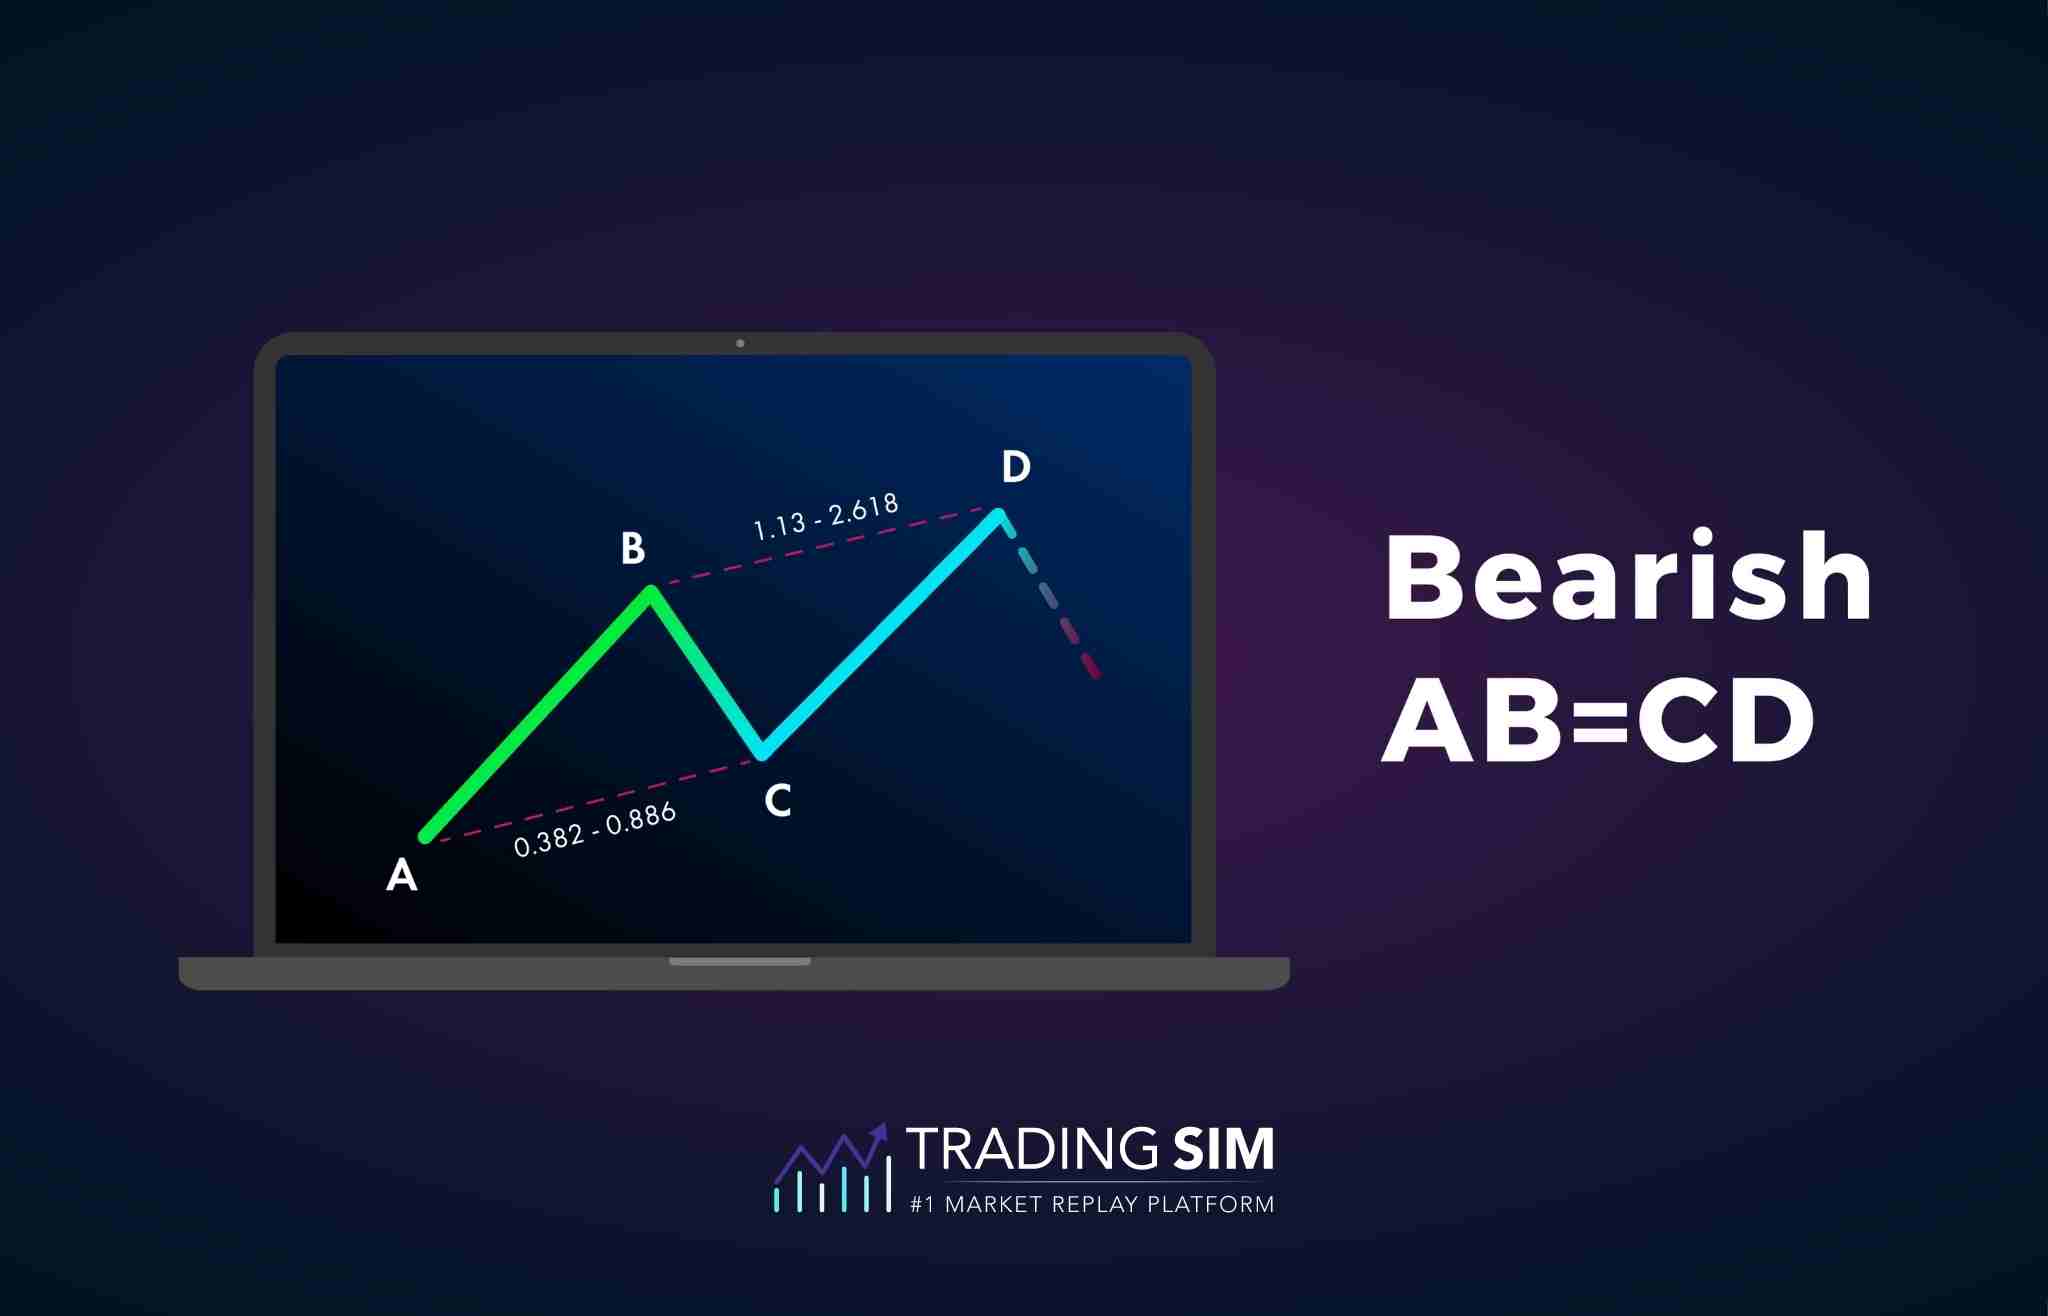
Classical harmonic pattern theory suggests that you measure the distance between the AB and BC move as well as the BC and CD moves. Generally, these calculations should be as follows:
- BC is 61.8% or 71.6% of AB
- CD is 127.2% or 161.8% of BC
You can also use the formula of AB=CD, where the length of AB equals the length of CD, or the Time for AB to complete equals the time for CD to complete.
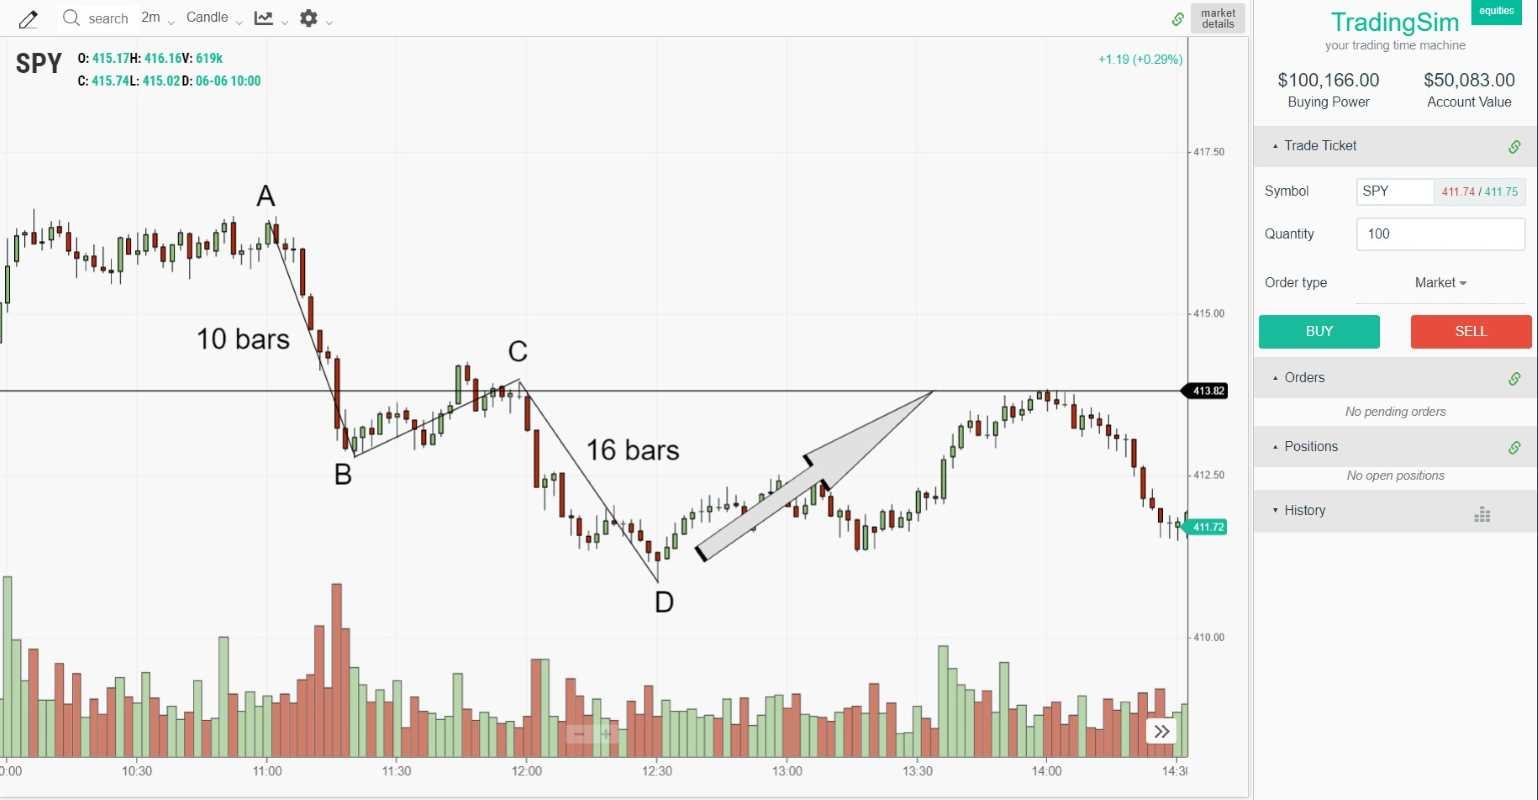
Lastly, in an ABCD Extension, you'll find that the CD extension is 127.2% or 161.8% longer than AB. Our SPY example above matches this pattern of an ABCD extension.
Let's look at how this might show on a chart:
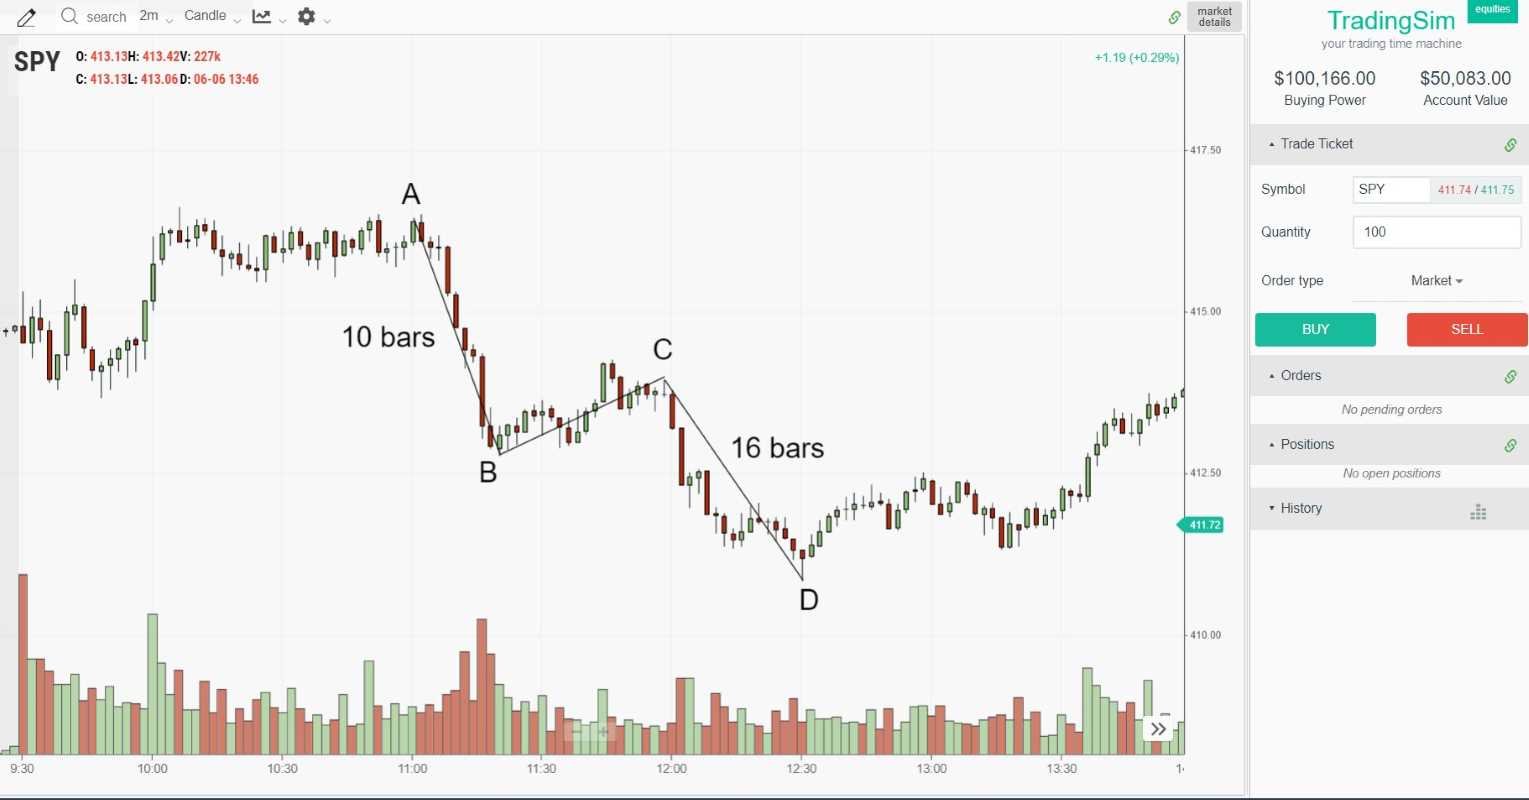
Notice that in this example, the ABCD extension from C to D occurs in 16 bars vs the 10 bars for the AB. That gives us a nice 161.8% compared to the first leg (AB). While this isn't an exact science, we recommend that you look through the trading simulator for different examples of abcd patterns and measure them to find your best fit.

How to trade an abcd pattern
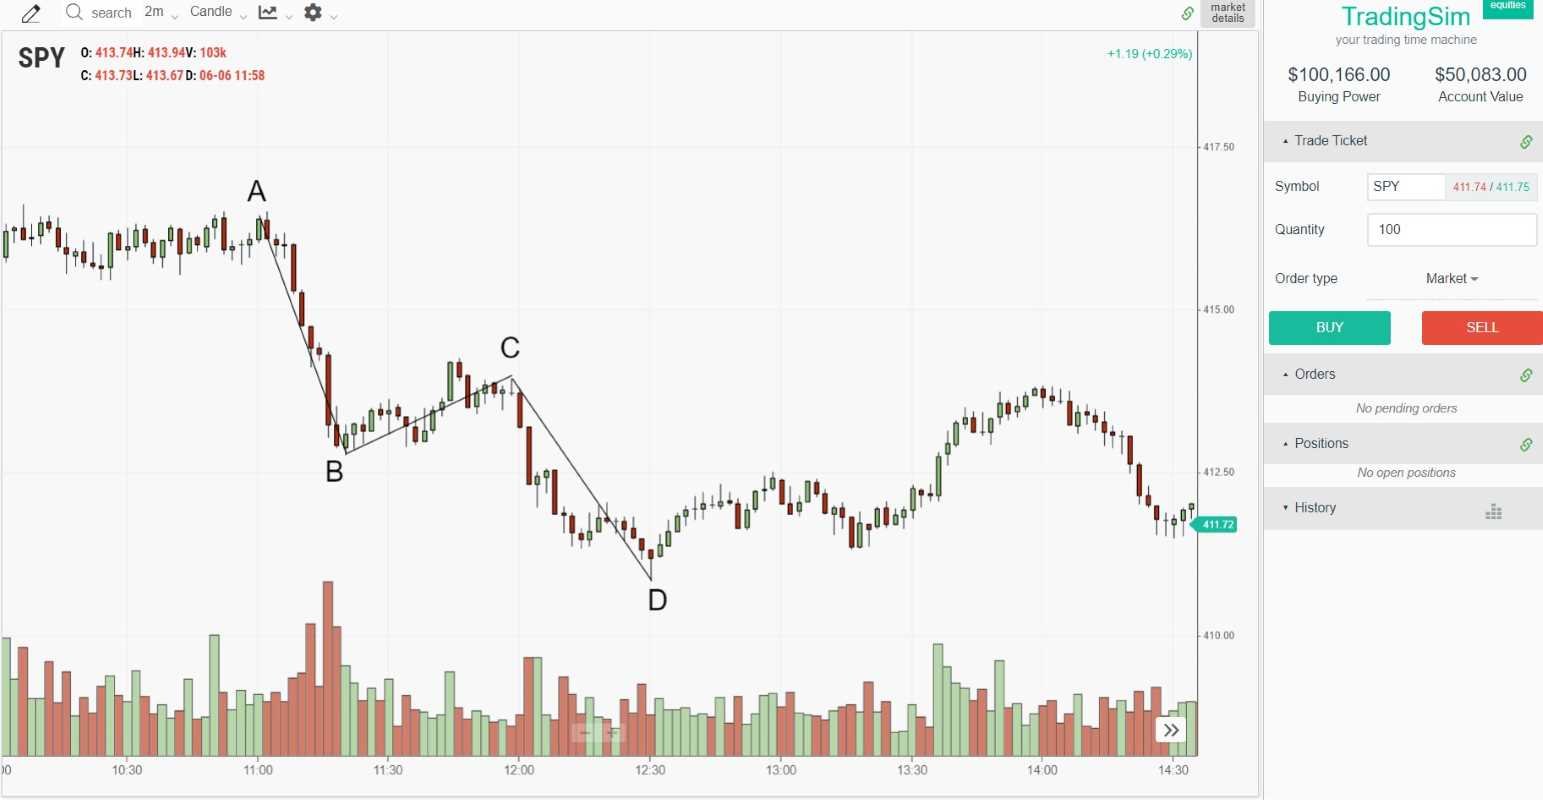
Using the SPY as an example chart, you can see the classic way to trade the abcd pattern is to wait for the D extension to form, and then place a trade on a counter-trend move. In short, the pattern calls for buying at "D" when the stock is downtrending, or selling at "D" when the stock is uptrending.
As you can see in the image above, if timed correctly, buying at D would have give you a nice rally trade back to the "C" congestion area from before:
You should also take note of the candlestick patterns that form at the D reversal area. We've written extensively about bullish candlestick patterns and bearish candlestick patterns, so be sure to check those links out.
![hammer <a href=]() candlestick pattern TradingSim" loading="lazy" src="https://www.tradingsim.com/hubfs/hammer%20candlestick%20pattern%20TradingSim.png" style="color: #444444; background-color: transparent; width: 159px; float: left; margin: 0px 22px 0px 0px;" width="159"/>
candlestick pattern TradingSim" loading="lazy" src="https://www.tradingsim.com/hubfs/hammer%20candlestick%20pattern%20TradingSim.png" style="color: #444444; background-color: transparent; width: 159px; float: left; margin: 0px 22px 0px 0px;" width="159"/>
In this particular case, we have a perfect bullish reversal candle in the form of a hammer candle.
What is a hammer candle? It looks just like a hammer with a mallet on top and a handle beneath. When you spot this pattern toward the end of a downtrend, or an uptrend, it can often signal that the trend is ending. When played correctly, you can take an entry after the candle closes and put your stop below the hammer handle.
ABCD Pullback Strategy
There are other variations for trading the abcd pattern as well. Many intraday scalp traders look to trade the BC pullback as an opportunity to join the AB/CD trend. In other words, if the stock is trending upward on the AB leg, some traders will anticipate the BCD portion of the move by going long and buying the breakout.
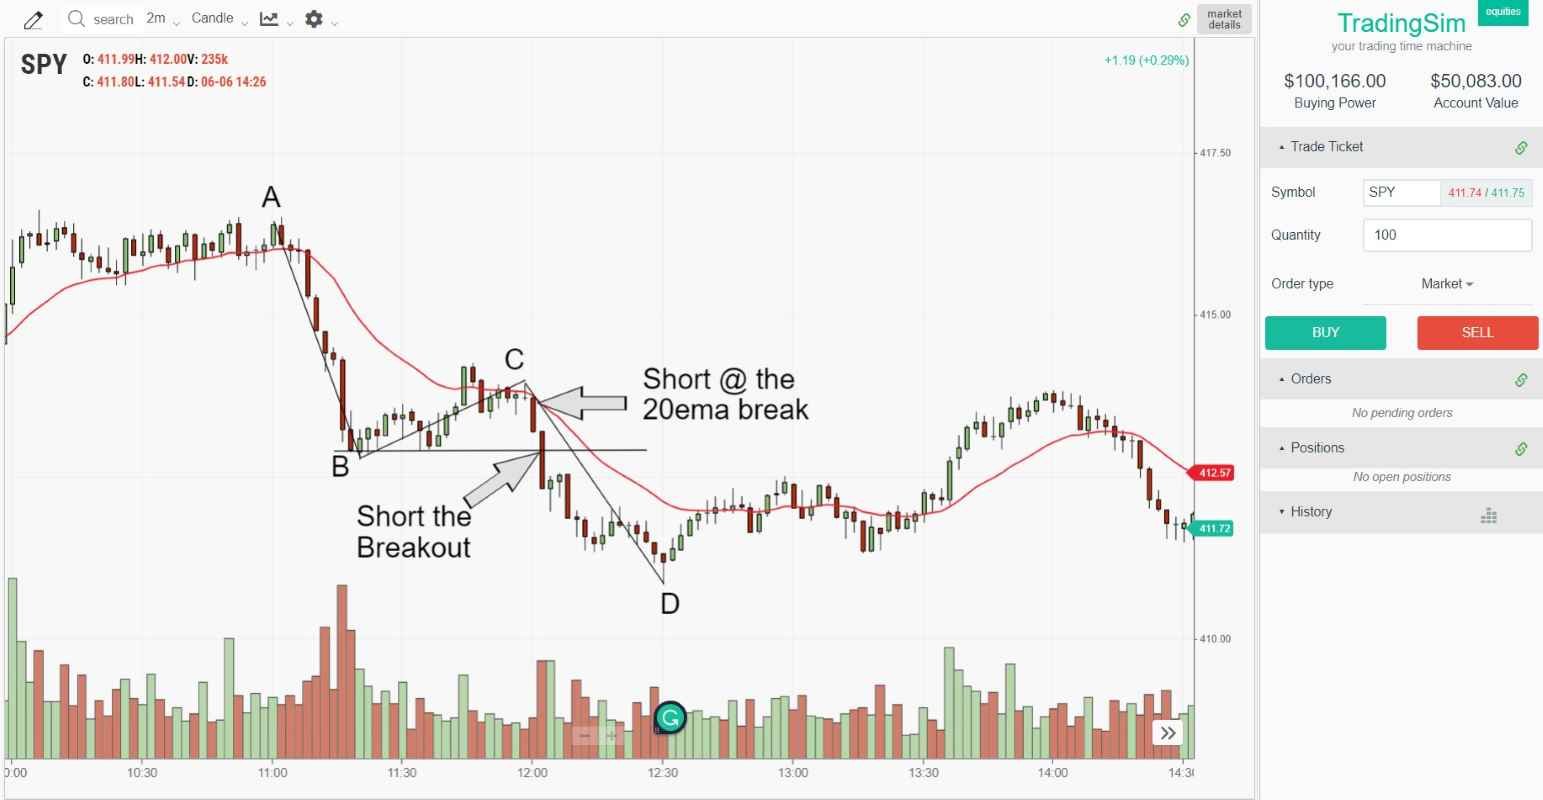
In addition to buying the breakout, many traders will look for a popular moving average like the 20ema. If a stock is creating a "BC" leg into resistance at a moving average like the 20, it could signal an entry. The breakout would then become an add-on entry point, as seen in the example above.
ABCD bull flag and bear flag strategy
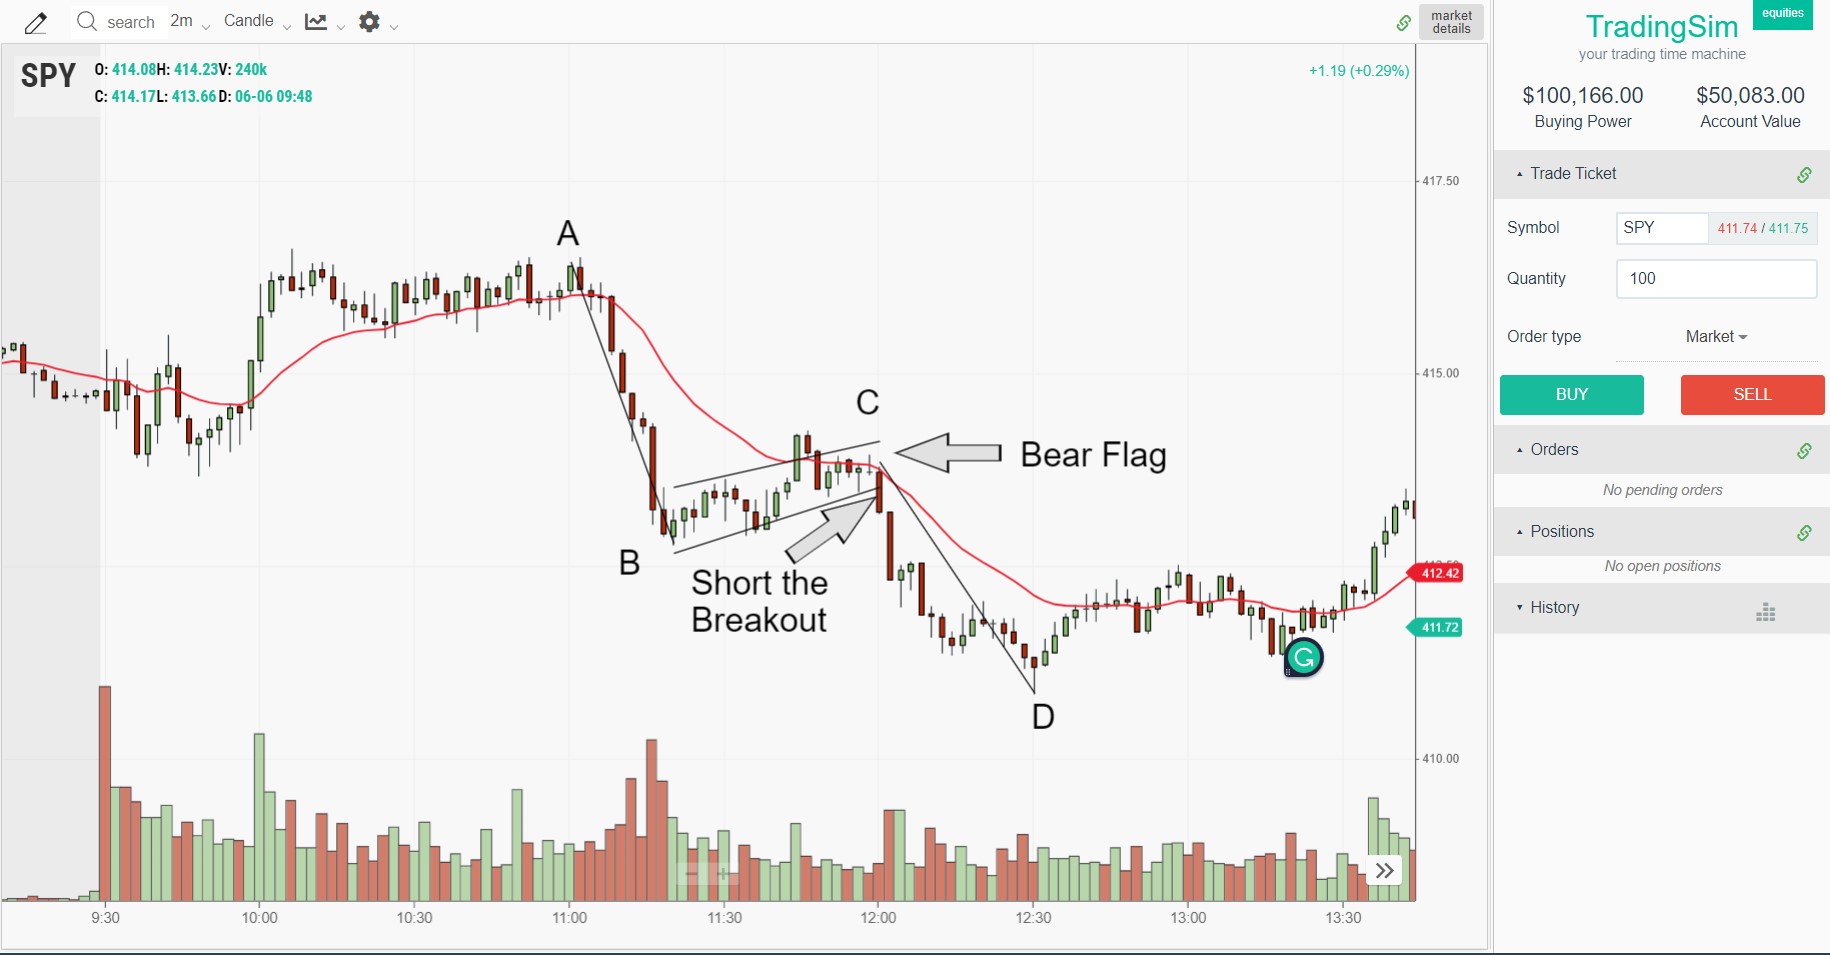
As you can probably tell from the visual pattern of an abcd, the CD leg of the pattern looks a lot like a bull flag or a bear flag depending on the context and the trend. In the example we have been using with the SPY chart, this would be a bear flag. Often these look like wedges, flags, or pennants depending on the structure of the pullback.
With this example, you have the CD forming a perfect bear flag pattern. You would take the stock or ETF short on the breakdown, as seen below, placing your stop above the most recent high inside the pullback.
How to read an abcd pattern?
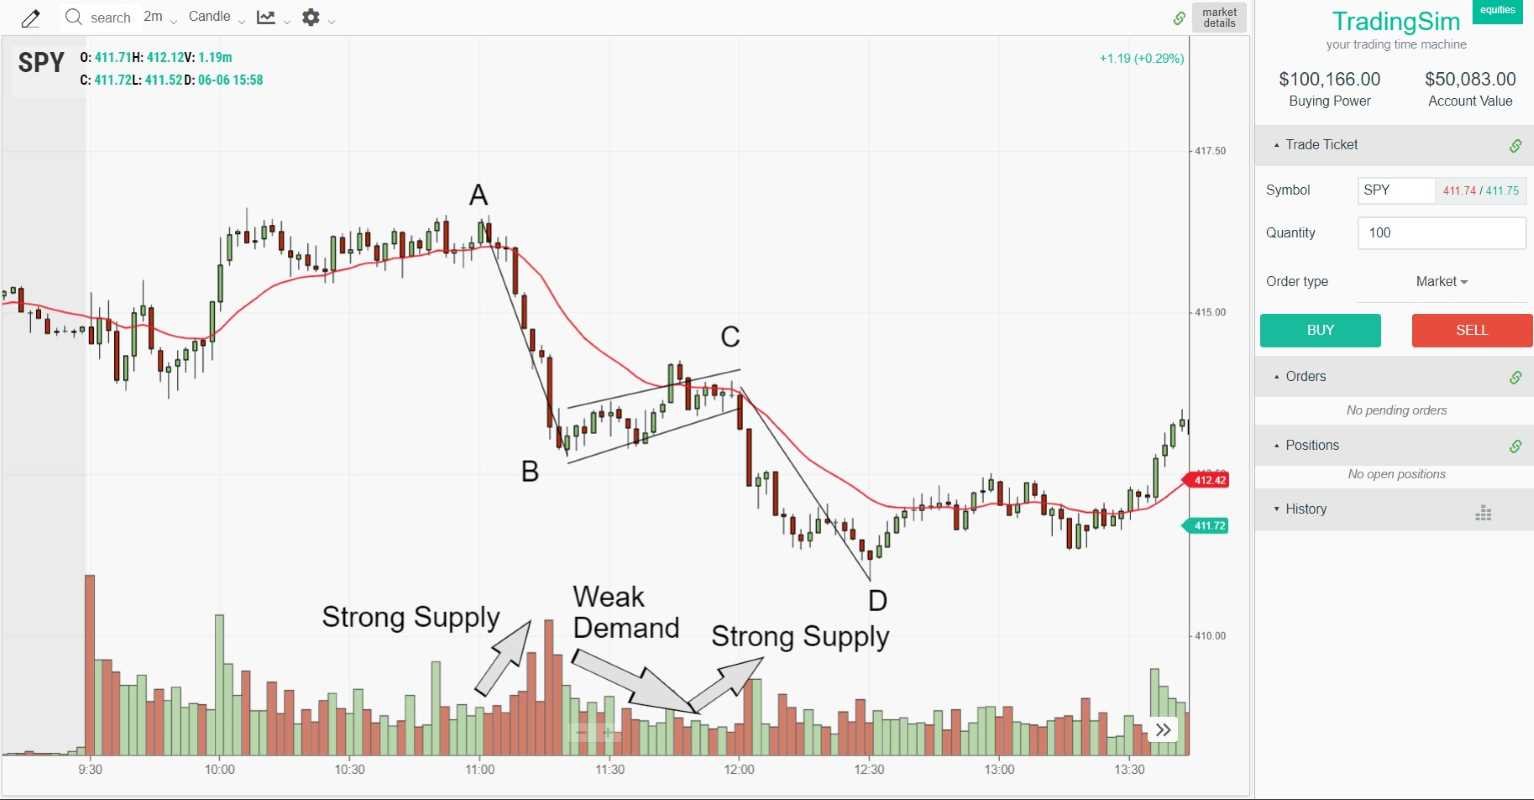
One of the best ways to read an abcd pattern, or any pattern in trading, is to pay close attention to the volume signature that accompanies the pattern. In an abcd trading pattern, you want to see volume increase on the downward/upward initial leg, then recede on the BC consolidation, and then increase again on the last leg of the pattern.
What this tells us is that supply or demand is coming in strong to create the initial move. Then, when the initial move is complete, you want to make sure that the BC pullback isn't too strong, otherwise, you might have a "V bottom" reversal pattern. Then, as the stock continues in the original direction, you want to see volume pick up again.
What this tells us is that the trend is strong. Volume correlates with the prevailing tailwind in either direction of the abcd pattern. If the pattern is moving upward, you want to see strong demand, then weak supply, then strong demand once again. Vice versa for the downtrend.
How to scan for abcd patterns?
The best way to scan for abcd patterns is to look for intraday momentum. Often times, right after the market opens, you'll find stocks that are trending upward or downward. One of the best ways to look for this is on the high/low scanner that your brokerage or charting platform provides. If you are watching this scanner and notice that a stock is trending up or down and making new highs, you should take note.
After putting a stock on your watchlist that is making new highs on good volume, you'll want to monitor it for pullbacks. Depending on which strategy for the ABCD pattern that you employ, you'll want to watch it closely. If you decide to buy the pullback for a scalp to D, then you'll need to be aware of your moving averages and support. Or, if you decide to trade the classic pattern by shorting at D, you'll still need to monitor the stock.
While you're monitoring the stock, be sure to identify any pivot points, Fibonacci levels, or vwap boulevard lines that could give you an area of confluence to bolster your short thesis. The more confirmation you have for your trade, the better.
My preferred ABCD entry strategy after years of testing comes down to three approaches depending on your risk tolerance. The aggressive entry is buying when price breaks above point C with volume confirmation, which gives the best risk-reward but lower win rate. The moderate approach that I use most trading days is waiting for price to reach the D zone near a Fibonacci level and entering on the first pullback with a tight stop. The conservative play waits for D to hold and price to close above previous resistance before entering. I always set my stop-loss just below the D completion point and target profits using Fibonacci extensions of the CD leg. Taking partial profits at the 138.2 percent extension and trailing the stop on the remainder has consistently produced the best results in my trading. The key is picking one approach and sticking with it rather than switching between methods.
ABCD Pattern vs Harmonic Patterns: What Is the Difference?
I get this question constantly, and it took me years to stop confusing the two. The ABCD pattern is the foundation of harmonic trading. It is the simplest four-point reversal structure with the A to B impulse, C retracement, and D extension. Harmonic patterns like the Gartley, Butterfly, Bat, and Crab all build on top of the ABCD structure but add strict Fibonacci ratios and extra legs.
Here is my take after trading both for over a decade: start with ABCD. It is more forgiving, works across all timeframes, and you will spot these setups everywhere once your eye is trained. Harmonic patterns offer tighter entry zones and potentially higher win rates, but that precision means you miss more setups chasing perfection.
In my own trading, I use the ABCD pattern as my initial scanning filter. When I find one, I then check if the structure qualifies as a harmonic pattern. If it does, I size up my position. If it does not, I still take the trade with slightly wider stops. Master the ABCD first and layer in harmonics once you are consistently profitable.
ABCD Pattern Summary
The abcd pattern should be in every trader's arsenal of trading patterns and trading strategies. It is one of the most recognizable patterns and can lead to nice gains if traded properly.
The classic abcd pattern is a reversal pattern. In other words, when the pattern reaches the "D" in the abcd, it's time to take a counter-trend trade. If the trend is up, you go short. If the trend is down, you go long. However, there are many alternative ways to trade the abcd pattern as a scalper in the direction of the primary trend.
We hope this tutorial helps with your knowledge of the abcd pattern. Keep in mind that there is no better way to test your strategies than in a simulated environment. Here at TradingSim, we give you the tools to trade and replay the REAL market with over 3 years of historical market data. Test your abcd strategy and record it in our analytics page to see your best results!

Related Trading Patterns
Key Trading Concepts to Master
The ABCD pattern works best when combined with other technical tools. Sharpen your edge by studying these related strategies:
Frequently Asked Questions
What is the ABCD pattern in trading?
The ABCD pattern is a harmonic chart pattern consisting of four price points (A, B, C, D) that form two distinct price legs. The AB leg is the initial move, BC is a retracement (typically 38.2%–78.6% Fibonacci), and CD is the final extension that often equals the AB leg in both distance and time.
How do you trade the ABCD pattern?
To trade the ABCD pattern, first identify a completed AB and BC leg. Enter near the D point completion where CD equals AB in length. Place your stop loss below point D (for bullish) or above point D (for bearish). Target a move equal to the AD range or use Fibonacci extensions for profit targets.
Is the ABCD pattern bullish or bearish?
The ABCD pattern can be both bullish and bearish. A bullish ABCD pattern moves down from A to B, retraces up to C, then drops to D where you buy. A bearish ABCD pattern moves up from A to B, retraces down to C, then rallies to D where you sell short.
What timeframe works best for ABCD pattern trading?
The ABCD pattern works across all timeframes, but day traders typically find the best results on 5-minute to 15-minute charts for intraday trades. Swing traders may use daily or 4-hour charts. The pattern is fractal, meaning it appears at every timeframe.
How reliable is the ABCD pattern?
The ABCD pattern is considered one of the more reliable harmonic patterns because it has clear, measurable rules based on Fibonacci ratios. When the BC retracement falls between 38.2%–78.6% and the CD leg approaches equality with AB, the pattern has a higher probability of success. Always use stop losses and risk management.
ABCD Pattern Trading — Master the ABCD pattern for day trading with real chart examples. Learn how to identify, trade, and profit from ABCD chart patterns in stocks and futures.
Source: TradingSim | Author: Al Hill, Co-Founder of TradingSim | Updated: April 2026


 Chart Patterns


