Day Trading Strategies

All you need to know about trading strategies and how to implement them.

TRADING-STRATEGIES-optimized

Trading Strategies

Trading Strategies: they’re infinite. But, thankfully, you don’t have to know ALL of them! And that’s what we are here for. Standing at the edge of your trading career before jumping in can seem scary, and the pit of information so deep.

However, it doesn’t have to be that daunting.

Sure, there is certainly a learning curve. As we’ve said before, it’s a lot like learning a new language. And that’s not an exaggeration. Think about how hard it was to learn a new language in school. How many years did it take to reach some level of fluency? Did you give up along the way?

Learning the markets is no different. Thankfully, we have the benefit of many proven trading strategies to help guide us. They’re a lot like knowing when to use verbs, when to use nouns, and how to put the whole sentence together. When you learn this trading strategy, that trading strategy, and can see the big picture trade plan, it eventually all comes together.

But, where do you start? Well, there are no right or wrong answers to this. The bigger question is: will you start? And if you do, how far will you go? And, to that end, we’ve compiled this Trading Strategies 101 so that you can get a taste of what some of the most popular strategies in the market will look like. In turn, you can judge for yourself which path you want to take for further education.

After all, learning never ends in the market. It is ever-evolving. So, stay on your


Futures Strategies

What Are Futures in Stocks?

Futures are a type of derivative in the markets. What makes them a derivative? The value of the contract is “derived” from the underlying asset.

They aren’t actually “stocks.” Unlike equities, you aren’t buying a share of a company, per se. Instead, you are buying a contract. And that contract is an agreement between buyers and sellers to make the transaction at the close of the expiration date on the contract.

Unlike stocks, futures may require you, the buyer, to take possession of the underlying commodity when the contract expires. For example, if you are buying December gold futures, your contract will expire at the end of December and you must either take possession of the commodity or its cash equivalent, which will depend upon the exchange in which the contract was bought.

That being said, futures are often bought and sold much like stocks. They are an opportunity for speculators to bet on prices going up or down in a certain commodity or index. Also, they are often used as a hedge for other portfolio positions like stocks. In fact, there are quite a few asset classes that you can trade as futures. Here is a handful:

  • Metals futures for gold, silver, nickel, copper, etc.
  • Index futures for markets like the Dow, NASDAQ, and S&P500
  • Commodities like wheat, corn, crude oil, soy
  • Currency futures, Bitcoin futures, and treasury bonds

Regardless of what futures you buy or sell, you’ll want to make sure you have a good understanding of the dynamics of supply and demand, technical analysis, and even world events. We’ll discuss some of these futures strategies in a moment.

How to Trade Futures

There are many strategies that can help you learn how to trade futures, but you must first begin with a broker who offers futures trading. There are plenty to choose from and we won’t go into them here. Instead, let’s discuss the ramifications of margin, speculation, buying and selling, and hedging.

Most brokers offer traders the ability to trade using margin. In other words, your buying power is leveraged with only a small amount of upfront capital. This allows you to trade contracts without putting up 100% of the value of the contract. Some brokers will give you 20:1, others 100:1, or even higher leverage to your initial deposit.

As we’ve said before, this can be a Catch 22. Know what you’re doing, or that amount of leverage will eat away your account quickly.

Speculating on futures is one of the more popular ways to trade futures. It is like any other speculation. Buy a contract betting that it will go up in price, and you will have a profit once you sell the contract. You can also trade futures to the short side, betting on the price of a commodity to go down. We call this short selling.

If you sell a futures contract short and it goes down in price, you’d then cover your short position and make a profit once it reaches a targeted, lower price.

Lastly, many institutions and traders trade futures for the purpose of hedging. Hedging is a fancy term for protecting your positions in the market. As an example, let’s say you have a long position in the S&P500. As a longer-term investment vehicle, you expect the S&P500 to continue upward. However, in the short term, you expect it to make a correction and go downward.

In order to protect your long-term position, you short sell the S&P500 futures until the correction is over. This hedges you from any real losses in your main portfolio.

Futures Trading Strategy

Much like the world of stocks, there are tons of futures strategies to choose from. Some are quantitative, some are discretionary. Regardless, most futures strategies are going to be based upon repeatable patterns. Along those lines, let’s discuss the importance of liquidity zones, and use an example of a reversal strategy to illustrate how to trade futures.

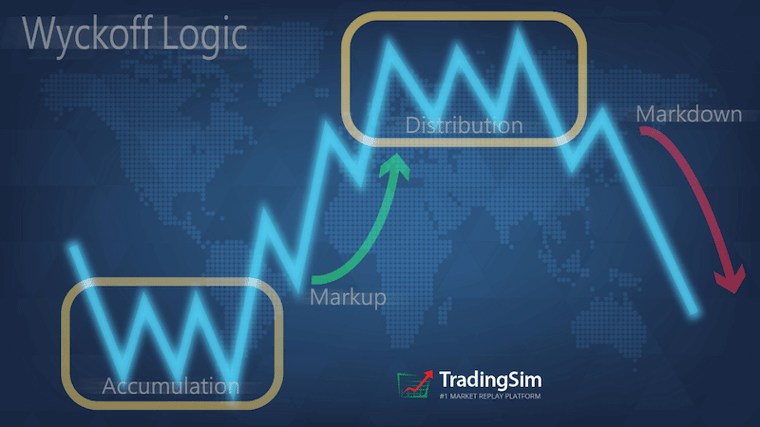
Liquidity zones are areas on a futures chart that tell you where big players are either accumulating or distributing their contracts. Typically price will congregate in these areas as long as there is supply or demand present. However, once supply is exhausted, or vice-versa, the price will move away from the area in the direction of least resistance.

Take a look at this daily chart of Crude Oil Futures:

Crude Oil Futures TradingSim

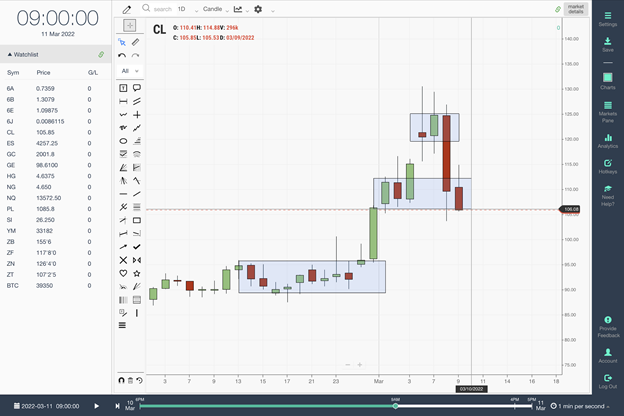
Notice the key liquidity zones that we have highlighted with rectangles. When a futures contract is under accumulation, it will often remain in an area long enough for institutions to accumulate contracts. Once enough contracts have been bought, the price is marked up. Hence, you see how price moves higher out of these liquidity zones.

In contrast, when the price of a commodity has gotten too extended, you are liable to see the distribution of those contracts that were accumulated at much lower prices. The result is “ease of movement” back to the liquidity zones that supported the asset before.

Finding a Setup within a Futures Trading Strategy

Now that you’ve seen the big picture idea of how a futures asset can move, you’ll want to add a pattern, or “setup” to your arsenal. This will give you a way to define your risk before you take a position, long or short.

For example, let’s look at the long side.
We’ve written about the volatility contraction pattern and short traps before. The volatility contraction pattern is usually an indication of great demand in a commodity, stock, or another asset. It reveals that supply is hard to come by and that demand is steadily supporting the price of the asset.

In the Crude Oil example above, if we dial into the 30m charts, we see this pattern playing out before we get a launch from the entire base. Have a look:

Crude Oil Futures 2 TradingSim

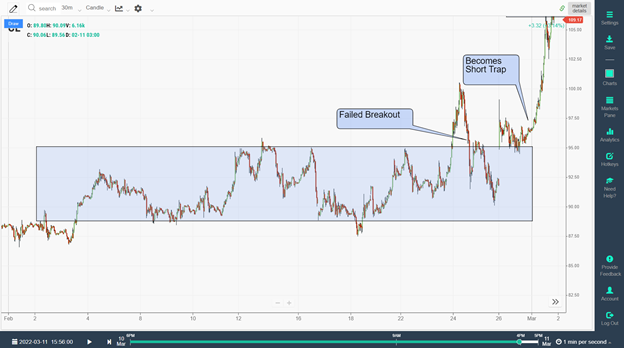
Notice that despite the failed breakout, crude oil continued to maintain higher lows. In addition, we can assume that the selling pressure that came in on the failed breakout only fueled the price of the commodity higher. Why? If there were any short sellers in that selling pressure, they eventually had to cover their positions as the price went higher.

We hope you’ll see that many of the same patterns we use in equities trading can be used as futures trading strategies as well. For that reason, be sure to practice your own strategies in our simulator to determine your best possible outcomes before putting real money to work.


Options Trading Strategies

Perhaps one of the more confusing trading strategies to beginners, options require a little more planning than just clicking the buy or sell button. Somewhat similar to futures, you aren’t actually buying shares of a company. Options are a contract.

What are Options?

Options are just that, the option to buy a certain amount of shares of a stock at a specified price. It is essentially a contract, albeit instantaneous, between buyer and seller, for a certain number of shares (usually 100 per contract) at a predetermined price (strike) to be executed by a certain date in the future (expiration).

On the contract expiration date, you have the right to either allow the option to expire or to exercise your right to the shares at whatever price the stock is currently trading.

Here’s an explanation of how this works in what we would call a basic naked call option.

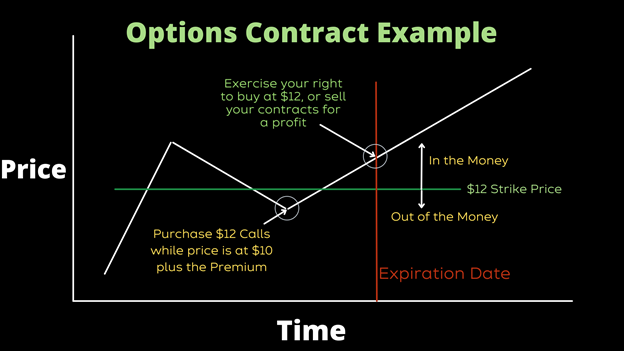
Stock XYZ is trading at $10. You expect the price of the stock to rise to $20 over the next 6 months. You search for options with a “strike” price of say…$12, just above the current price of $10. The expiration date will be a few weeks or months out.

If the price of the stock goes above your $12 strike, you are in the money. However, to initiate the option, you must pay a “premium”. A premium is a fee charged by the options desk (writer) of the contract. It is quoted as a dollar amount per share, and each contract usually contains 100 shares of the underlying security.

The price of the premium can range anywhere from around $1 to $10, (or more) on popular and volatile stocks like Tesla or the SPY. This premium that you pay grants you the right to the contract. To understand the math: if you bought 1 option contract of TSLA for $10, it would cost you around $1000 for the premium.

1 option contract = $10/share

100 shares per contract x $10 = $1000 premium

To wrap up the simple explanation of a contract, here’s a quick visual for you:

Options Contract Example TradingSim

List of Options Trading Strategies

There are many different options trading strategies to choose from. In fact, the names get pretty creative. To that end, there are many types of spread options, covered options, married options, strangle and straddle options, etc.

Here is what we would consider a list of the top 10 options trading strategies.

Sounds like an interesting contestant challenge from a naked reality tv show, doesn’t it? Well, it may be less entertaining than that, but hopefully, we can make sense of these for you. Each of these options trading strategies has a very specific purpose. We’ll detail four of our favorites from this list.

Naked Calls and Puts Options Strategy

When you want to bet on the long side of a stock using options, you have two choices: either buy calls or sell puts. If you want to bet on the short side of a stock movement using options, you buy puts, or you sell calls.

As part of this process, if you don’t already have a position in the underlying stock but want to buy or sell options, you are going “naked” on calls or puts. One benefit to this strategy is that it limits your risk to only the premium you pay for the options.

This doesn’t mean that you have no risk at all. After all, when an options contract expires without exercising your right to purchase the shares, you will lose the entire premium you paid. However, as we discussed before, it can be an easier way for smaller accounts to leverage buying power while limiting their risk.

Here’s an example of this using TSLA. If you have a $5,000 account and you want to purchase one contract of TSLA at a $10/share premium. In total, you’ll pay $1000 for the contract. If TSLA goes up in price and reaches or exceeds your strike price before the expiration, it is very possible to double your premium.

This, of course, is a very simple example and will have a lot of determining factors that can influence your premium – things like decay, volatility, etc. But, for all intents and purposes, it is at least one options trading strategy and perhaps the simplest.

Covered Call Options Strategy

A covered call is an options strategy that allows you to buy a stock and sell (write) a call option at the same time.

It works like this. At the same time, you purchase shares of a stock, you automatically sell a call option on the same shares at a higher strike price. Why would you be doing that, you might ask? Essentially, to collect the premium from writing the calls in addition to the sale of your shares.

You are protecting your initial investment on the purchase of the stock by selling call options and collecting a premium. The only caveat is that you must be willing to sell the equity shares you purchased at the short strike price of the call. When the options are exercised, you will have collected your premium, and sold your shares at the strike price.

Married Put Options Strategy

A married put is a lot like a prenuptial agreement. No pun intended. It allows an investor to use options trading to hedge his downside risk while purchasing stock.

It works like this: you buy a certain amount of equity shares and then buy put options for the same amount of shares. As you recall from earlier, buying puts is a bet that a stock will go down. In the event that this happens, you’re hedging your long position from any catastrophic P/L swings.

However, if the price of the stock goes up, you’ll only lose the premium you paid for the put options.

Bull Call Spread Options Strategy

A bull call spread strategy is an options trading strategy for the same underlying asset, with the same expiration date. However, one call option is bought at one strike price while the other is sold at a higher strike price. Hence the spread between strike prices.

It is what we would call a vertical spread if thinking about the price on the y-axis.

Your premium is reduced using this options strategy because of the premium you would collect on the sale of the call option. The downside is that your profit is limited if the price of the stock continues to rise. Nonetheless, it is a bullish strategy that requires the price to rise.

Options Strategies Cheat Sheet

When it all boils down to it, you are better off trading options with a sound understanding of technical analysis. Along those lines, the same technical patterns that you see while trading stocks will more than likely aid your options trading strategy as well.

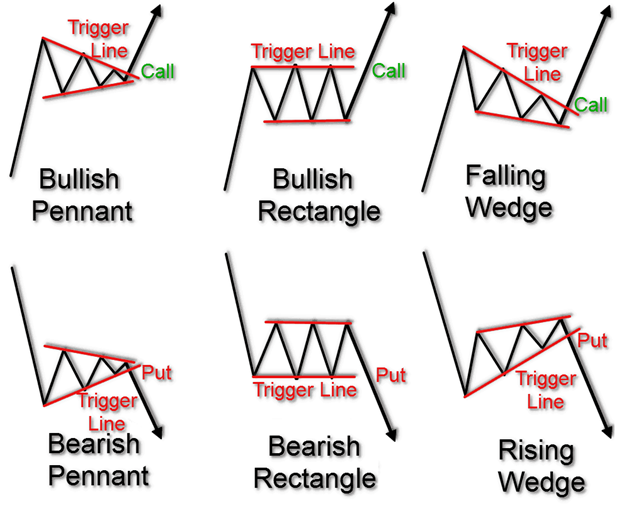
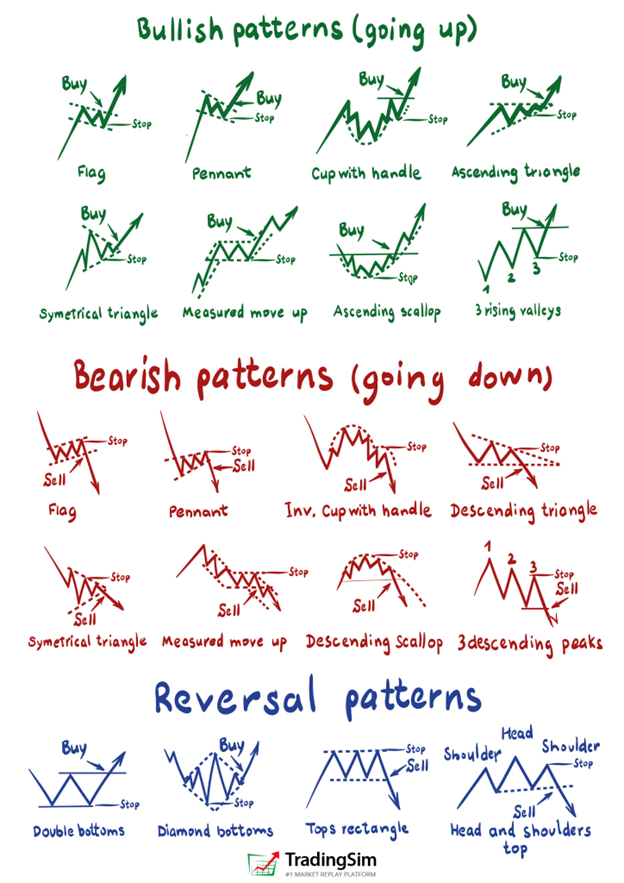
For example, if you expect a breakout is imminent for a specific trading pattern, you could employ an options trading strategy to take advantage of the move. Here are a handful of examples of the types of strategies and patterns you could use compiled into an options strategies cheat sheet.

Options Strategies Cheat Sheet TradingSim

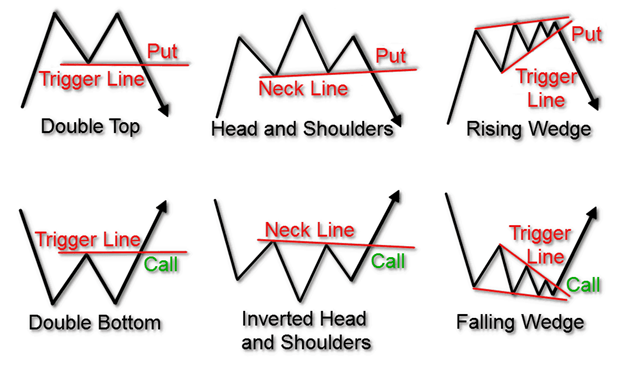
These are some of the more common trend reversal chart patterns. And while we’ve given you an idea of where to take a naked call option, you could easily employ any type of options strategy that fits your setup.

Here are some trend continuation charts as an options strategies cheat sheet for where to trigger your options contracts:

Options Strategies Cheat Sheet 2 TradingSim

And speaking of patterns, this is a great segue into our next topic, Trading Patterns. Let’s look at some of these examples more in-depth.


What Are Trading Patterns

Learning trading patterns might be the best way to make consistent money in the stock market.

For centuries, the market has displayed the same characteristics, over and over again. After all, it’s all about the buying and selling, supply and demand – human emotions plotted on a graph in ticks and candles and lines and bars.

To that end, the more you learn about these repeatable patterns, the more insight you’ll have. It’s a lot like learning a new language. At first glance, it all seems very confusing. For that reason, it’s the trading patterns that give charts their meaning.

Trading Chart Patterns

Trading patterns are often referred to as chart patterns. They are a way for traders to recall repeatable price action in an effort to capitalize on a probable outcome.

As we show above in our options trading cheat sheets, pennants, flags, wedges, and double bottoms are all examples of typical trading chart patterns. They represent accumulation or distribution within a definable trading range.

The benefit to these patterns is that they give traders an idea of where price may go next, up or down.

Good traders don’t gamble, they take educated guesses based upon historical data. That data can either be implicit or explicit. Regardless of which it is, chart patterns are the ultimate way to reaching consistency in the markets. Otherwise, every opportunity you find in the market would have no precedent.

Day Trading Patterns

The great thing about trading patterns is that they usually work on any type of asset class or time frame. Day trading patterns are no exception. We’ve written extensively about some of the patterns you can find in day trading, like the Opening Range Breakout, the Head and Shoulders Pattern, and many others.

The difference between day trading patterns and swing trading patterns is that day trading patterns play out much faster, obviously. You aren’t holding positions overnight.

Usually, the best day trading patterns occur on high volume, intraday momentum. Without enough volume, it can be more difficult for these patterns to play out. It’s also important to know that most day trading patterns occur on stocks that may be less manipulated.

As a rule of thumb, larger caps typically react well to classical day trading patterns. However, even penny stocks will have their own repeating patterns.

Head and Shoulders Trading Pattern

Head and Shoulders Trading Pattern Example TradingSim

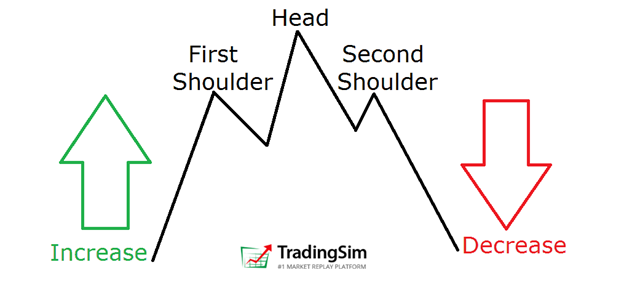
One of the most recognizable patterns in all of trading is the head and shoulders pattern. It’s a reversal trading strategy, which can develop at the end of bullish or bearish trends.

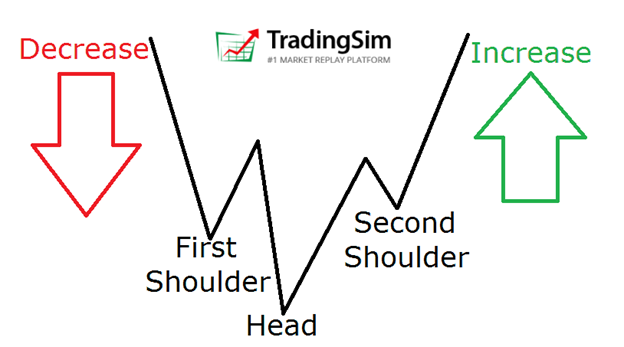
Often referred to as an inverted head and shoulders pattern in downtrends, or simply the head and shoulders stock pattern in uptrends, the pattern foretells the slowing momentum in either direction as the stock is unable to put in further highs or lows.

Inverted head and shoulders pattern cheat sheet TradingSim

Traders like to trade head and shoulders patterns as the price targets are very predictable and the formation has an overall high success rate.

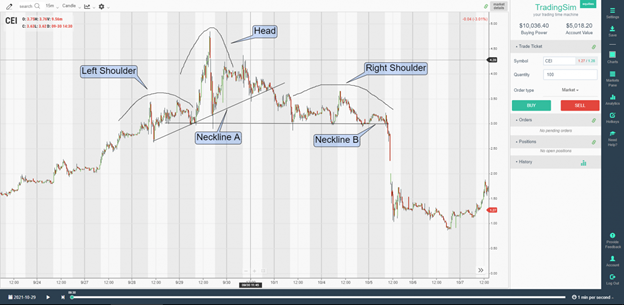
Since the pattern is easy to see, it’s also easy to execute. You can either initiate a position as soon as you see the right shoulder form or on the break of the “neckline.” Your stop-loss order would be just above the right shoulder.

To visualize this on a stock chart, here is an example with the symbol CEI. Notice that you have an early entry neckline, and a standard neckline. Often, traders may take the earliest entry.

Head and shoulders trading pattern in TradingSim Simulator

Trading Patterns Cheat Sheet

There are many different trading patterns, and no single pattern is going to be perfect. For that reason, we suggest trying out as many as you can. Study the ones that you connect with and recognize most often.

Better yet, we recommend observing the market in order to find your own patterns. It may be that you find something new, or something that has been discovered before. Regardless, it will be important for you to understand the patterns well enough to have confidence in your trades.

Here is a short list of trading patterns that we put together as a cheat sheet for you to consider:

Trading Patterns Cheat Sheet TradingSim

New call-to-action


Profit Taking Strategies

When to Take Profits from Stocks

No trading strategy would be complete without knowing how to profit from your trade. You’re going to not only need to know what the patterns are in the market, but you also have to develop entry criteria, and a solid profit-taking strategy.

To understand when to take profits from stocks, let’s look at the bigger picture of how stocks work.

How Do Stocks Work?

Stocks work in a price cycle. You can think about them in terms of phases to simplify things. We’ll look at those in just a moment.

First, to understand how stocks work, you need to know that the big players in the market are no different than a big box retail company. Just like a retailer, certain stakeholders in a stock want to create a market for their product: company shares.

In order to do this, they first buy up as many shares at a low price. Then, with their portfolio (warehouse) full of shares, they need demand for the stock to rise. This can be done through PR campaigns, innovative ideas, products, a new CEO, or any other fresh idea that might generate interest in the company.

image8

Once the demand is set, the price markup begins. This is phase 1 and the beginning of phase 2.

Eventually, as the price of the stock rises and rises, more investors want to buy shares. All the while, the stakeholders begin offloading (distributing) their original shares once their profit targets are reached. They take advantage of the demand in order to sell their shares: phase 3.

Once they sell, the price is marked down (phase 4) until they have a chance to fill their storehouses again at a lower price. Rinse and repeat. That is how stocks work.

What Is Profit Taking from Stocks?

Profit-taking in stocks can be one of the hardest things to master. Everyone wants to time the top, but it’s really, really hard to do. We suggest a few strategies for taking profits in our post on this subject. Our favorites are:

  • trend breaks
  • channel trades
  • candlestick patterns

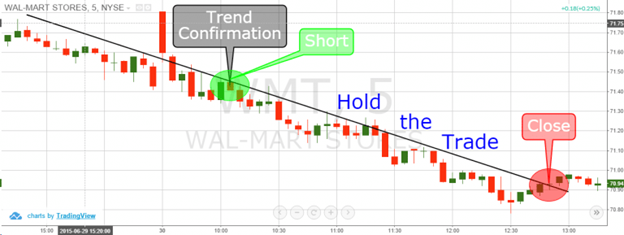
For Trend breaks, you ride a stock until it breaks the trend on climactic action. An example might be a parabolic run. This is your signal that the stakeholders are exiting.

On the flip side, you could take profits on the inside break of a trend. It might look like this:

Profits on the inside break of a trend TradingSim

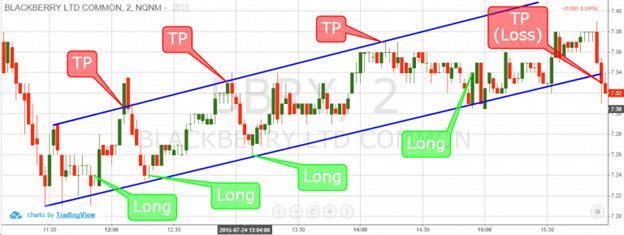
For channel trades, you will need a solid trend with channel markers, but also knowledge about reversal candlestick patterns (which we will discuss in a moment). As a stock bounces between the sides of the channel, it can give you the opportunity to go long or short along the edges.

Here’s an example of when to take profits from stocks that are channeling:

When to take profits from stocks that are channeling TradingSim

How Do Taxes Work on Stocks?

Speaking of profits. It goes without saying that you’re going to have to share those profits with Uncle Sam. Most traders may not need a lot of accounting work, but if you are a bonafide daytrader making a ton of trades every day, you’re going to need a trading accountant.

Short-term trades will land you in the short-term capital gains bracket. You need to hold stocks longer than a year to qualify for long-term capital gains. They are some elections you can choose with the help of your accountant, like mark-to-market, which may help you offset some of your trading taxes. However, it can be a tricky thing to accomplish depending on how full-time you trade.

Just know that unless you are set up like a business and have been trading for many years, you’re likely just going to pay short-term capital gains. That being said, you won’t be able to write off much, if anything, for your trading losses. So don’t expect much in the way of tax write-offs unless you treat it like a business.


Candlestick Trading Strategies

For beginner traders, reading candlestick charts can seem like an insurmountable learning curve. There appears no rhyme or reason, and no end to the amount of price and volume data being thrown your way.

It’s daunting, for sure. Especially when you’re just getting started.

But, there is a method to the madness. The method is in the patterns. The patterns reveal probabilities. And the right probabilities create opportunities.

More importantly, the right opportunities can create profits!

How to Read Candlesticks

A stock chart candlestick is a plot of price over a period of time. For example, a one-minute candle is a plot of the price fluctuation during a single minute of the trading day.

The actual candle is just a visual record of that price action and all of the trading executions that occurred in one minute.

How to read candlesticks TradingSim

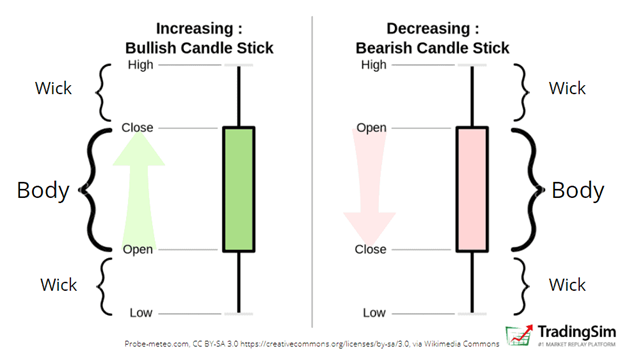
Similarly, a daily or weekly candle is the culmination of all the trading executions achieved during that day or that week.

How to should you read a candlestick? Well, the open tells us where the stock price opens at the beginning of the minute. The close reveals the last recorded price of that minute. The wicks (also known as shadows or tails) represent the highest and lowest recorded price from the open and close.

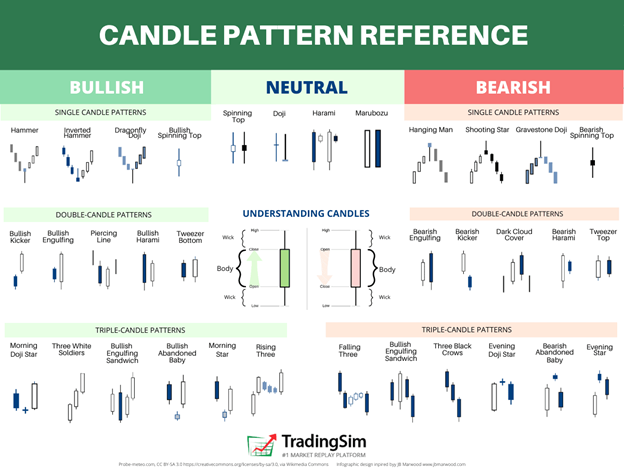
Candlestick Patterns Cheat Sheet

When you put many candlesticks together, you can often get candlestick patterns. Just like the trading patterns above, there are many individual candlestick patterns as well. They often come with fancy names like the following:

  • Abandoned baby
  • Three White Soldiers
  • Shooting Star
  • Hammer
  • Gravestone Doji

These are just a few examples of candlestick patterns. The best way to learn them is to keep a candlestick patterns cheat sheet handy while you’re trading or practicing. This way, if you see a nice reversal coming, you can consult your cheat sheet to see what candlestick pattern could be forming.

To that end, we’ve create this candlestick patterns cheat sheet just for you! Feel free to use it for your own purposes.

Candlestick Pattern Reference Sheet TradingSim
 

Consolidating Stock Trading Strategies

What Does It Mean When a Stock Is Consolidating?

When a stock is consolidating, it is essentially going sideways. As you recall from our chart above of the four phases of the stock price cycle, there are times when a stock is not trending up or down. Instead, it is consolidating.

What does this mean? It means that some investors are selling their shares, while others are buying. When the supply and demand are balanced, it usually results in a stalemate with price. Not until someone gains the upper hand does the stock move in either direction.

For example, if a stock is consolidating for after a sharp rise in price, it could just be a momentary pause during some profit-taking. Later in the consolidation process, the selling has stopped and the accumulation of shares continue. Hence the price continues to rise.

Here is an example of a consolidation and what it means for a stock:

example of a consolidation and what it means for a stock TradingSim

How to Tell if a Stock Is Consolidating?

You’ll know if a stock is consolidating when it is range-bound vs. trending. The best way to see this is on a chart or a diagram. A trading range is defined by upper and lower bounds.

A stock may not always respect the upper and lower bounds of a consolidation range exactly. However, if it is consolidating, it will more than likely return to the trading range sooner than later. Here is what that might look like for a head and shoulders pattern:

consolidating stock head and shoulders pattern TradingSim

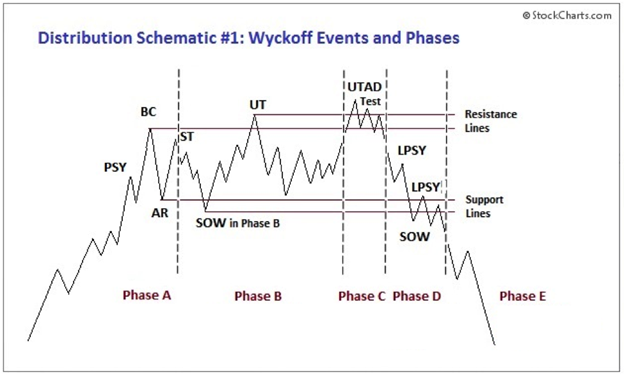
Notice how the stock reaches a “buying climax” denoted as BC on the chart above. It then carries forward a series of bounces between the highs and lows of the buying climax (BC) and the automatic rally (AR).

After the Phase C distribution event at the highs, the price is marked down and it reverses the trend. It is these characteristics that help you tell if a stock is in a consolidation.
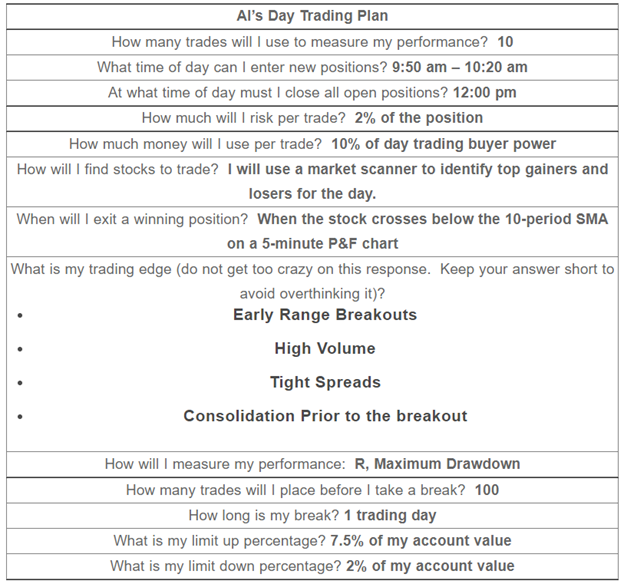


Creating a Trading Plan with a Trading Strategy

Most traders will never create a trading plan. They may risk more money in the markets than they ever will in any other business. However, they’ll never create a plan like they would if they were starting a business.

What is a Trading Plan?

A trading plan is a roadmap for what you are going to do in the markets. It will tell you things like:

  • Your strategy
  • Criteria for entries
  • Stop-loss levels
  • Amount of account per position
  • Max loss levels
  • When to trade
  • When to take breaks
  • Variables for success or failure
  • Trade management rules
  • Exit criteria

All of these will help you in the heat of the moment to stay true to your plan. It is crucial to work out your plan long before you trade real money. In fact, we recommend documenting your trading plan as part of your trade book.

You trading plan should include any and all relevant data that pertains to your trading day. However, to get this data, you must first know what to track. Once you have determined a subset of trades to track, you can add as many criteria as you want.

Creating a Consistent Trading Plan

In order to be consistent in the market, you need to have a detailed trading plan and keep it updated. Discipline is the number one factor that will affect your P/L in the market. You can have all the setups in the world, but sticking to your trading plan is what will give you consistency.

To help you with creating your own trading plan, we’ve created a list of 10 items that will be important to include. You can tweak this to your own likes and dislikes. However, make sure you can stay in your lane and stick to this trading plan in order to be consistent.

  1. How Many Trades will You Use to Evaluate Your Performance?
  2. Identify Your Key Performance Metrics
  3. What Time of Day Will You Trade?
  4. Define Your Trading Edge
  5. Identify Stocks to Trade
  6. Place Your Stop Loss
  7. When to Exit
  8. How Much Money Can You Use per Trade?
  9. When to Take Breaks
  10. Limit Up/Limit Down

Sample Trading Plan

Once you put it all together, you should be able to write down the data you need. To help you visualize this, we’ve put together a sample trading plan for you.

Sample Trading Plan TradingSim
 

Trade Management Strategies

Trade management is very important, but also subjective. We like to simplify it into two camps: the discretionary camp and the systematic trading camp.

In the discretionary trade management camp, managing your trade depends largely on price action, volume, and the character of the stock. Along those lines, you might ask yourself the following questions to create a trade management strategy:

  • Is this stock breaking out on heavy volume expansion?
  • What does the trend look like?
  • Should you add on a pullback to a moving average or support level?
  • Does price and volume contract on pullbacks?
  • What are some logical target areas overhead?
  • Is there enough momentum to carry the stock higher?

All of these are just suggestions but should be going through your mind as a discretionary trader. It will help with how you manage your trade, make adjustments, and take profits.

In the systematic trading camp, there is more of an appeal to risk versus reward. In other words, many systematic traders will take profits at specified reward levels despite the price action of the stock.

There are drawbacks to this if the stock continues higher. But, it can also be a way to mitigate emotional trading that many discretionary traders succumb to.


What are Stock Guru Strategies?

The trading world is chocked full of gurus. You really have to be careful who you follow. Some gurus will flash money and big profits at you like it’s easy to come by. Others will alert you to stock ideas only to sell you their shares when you (their followers) drive the stock price up.

However, there are some gurus' strategies that are worth learning. We try to profile quality educators and gurus on our podcast, the SimCast regularly. Like with any new hobby or job, you should take what you can from whomever you can. Toss out the bad stuff, and keep what works for you.

How to Use Guru Strategies?

The best way to use guru strategies is to test them first. If you have a guru who touts a certain strategy, get in the simulator and trade that strategy for a large subset of trades first. Determine your outcome criteria, and then you will know how well it works or not.

You may also find that many guru strategies are just renamed. Many gurus want to coin their own strategies for marketing purposes, but they are really just old, tried and tested techniques with a new name. For that reason, we suggest starting with classic technical analysis strategies and trading patterns before you spend a bunch of money on gurus.

Lastly, we would just point out that you need to develop your own strategies to be successful. The best traders are good observers and reviewers. They observe patterns over time through implicit learning and remember them. This is key to understanding market dynamics. Relying too heavily on a guru will only handicap your performance over time.

Our Two Favorite Guru Strategies

If we had to pick our top two guru strategies for beginners, we’d go with one long strategy and two that can go either way. This way, if you find yourself in any kind of market, you can have a strategy to fit that market.

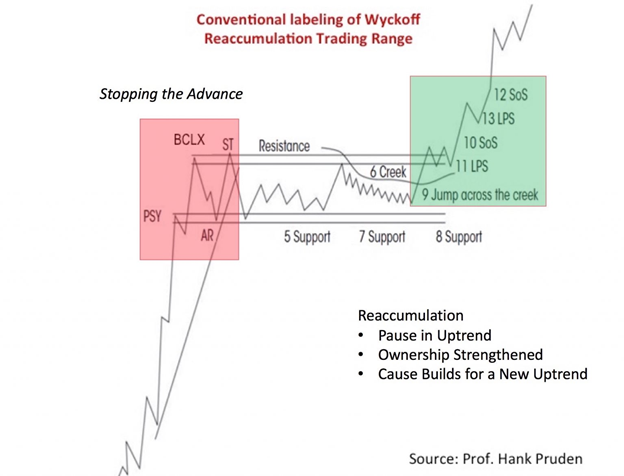
The Minervini Volatility Contraction Pattern

The Volatility Contraction Pattern, or VCP, as it has come to be known, has been popularized by Mark Minervini in his books Think and Trade Like a Champion and Trade Like a Stock Market Wizard. Despite the pattern’s success for swing trading, it can be very useful in day trading as well.

The VCP, which dates back to Richard D. Wyckoff’s “wave pattern,” carries a high rate of success when executed properly. It essentially looks like a bull flag.

Wycokoffs Wave Pattern TradingSim

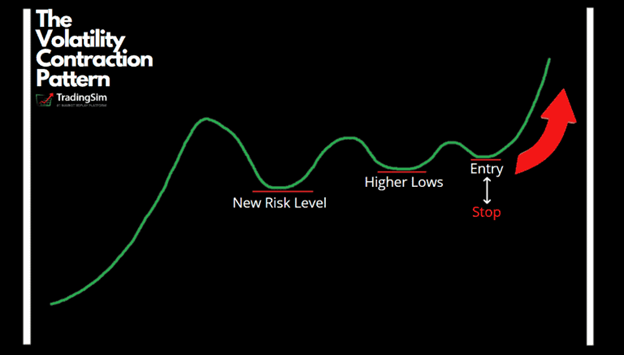
Many successful traders may refer to the pattern as simply a “high tight flag.” However, that pattern implies certain criteria that may not fit the VCP. You can see from the image above that it helps traders define their risks while offering exponential returns.

The VWAP Boulevard Trading Strategy

VWAP Boulevard got started by Twitter personality @team3dstocks. Since sharing the strategy with the community, thousands of day traders are now implementing this strategy to trade momentum stocks.

Here are the basics on what to look for with the VWAP boulevard strategy:

  • Find the VWAP from large volume days on a chart
  • Identify their daily VWAP levels on those days
  • Draw a line on your chart

And that’s pretty much the gist of it. Obviously, there is more to it, and we cover that in our ultimate guide to VWAP boulevard. But, for all intents and purposes, this level can become a key support or resistance level for your current trading day. This allows you to go long or short depending on the price action at that level.


Stock Trading Scans Strategies

Penny Stocks Trading Scans

Some of the best ideas for trading strategies comes from scans. If you don’t have a scanner included with your broker, you need one. Penny stocks trading scans will help you discover momentum in lower-priced stocks.

When scanning for penny stocks, you want to narrow your results down to the following criteria to help you find the best candidates for each day:

  • Float size
  • Volume
  • Relative Volume
  • % Turnover
  • Price
  • % Gain
  • Premarket gap %

Ideally, your penny stock scanner will tell you if a stock is gapping up in the premarket. You can then organize your search results according to the top gainers, and the most volume. This is usually an indication of the stocks that have the most volatility.

Scanning for volatility is one of the best ways to find big opportunities. As long as you have a trading plan, your scans will help you find the right stocks.

Stock Scans for Swing Trading

Another way to scan for stocks is to look for high-volume days on a daily chart. There are some scanners that will do this. Stockcharts.com, for example, allows you to custom code your own scan criteria.

When scanning for swing trade ideas, we recommend scanning for gappers, stocks that are consolidating, stocks that are close to their moving averages, and stocks that have made recent 50-100% moves. This will allow you to narrow your swing trade ideas down to high reward and low-risk opportunities.

If you’d like some ideas for swing trades, be sure to check out our post on the power earnings gap strategy. To find these, all you need to do is look for stocks that have gapped up on earnings. We detail the rest of the strategy in the post!

New call-to-action


Trading Strategies Summary

As you can see, there are many ways to skin a cat in the stock market. There are many trading strategies to learn. What is most important is that you eventually bring all that learning into your own wheelhouse.

Too much information can lead to overload. Take your time learning trading strategies, but be sure to condense the information into something useful for you.

Here’s to good fills!


Love these and want more?

Stay in the know

Make the most out of every trade!