✓ Reviewed by Kunal Vakil, Co-Founder of TradingSim · Updated Sep 18, 2026
Level 2 and Time & Sales Practice in a Simulator
I have already written a full guide to reading Level 2 quotes and another on interpreting the Time and Sales window. Both explain what the panels mean. Neither one solves the actual problem, which is that reading the book and the tape is a speed skill, and speed skills are built through repetition, not explanation. You can understand every column in the montage and still freeze when prints start rolling at nine thirty.
This article is the practice half. It lays out five drills you can run in market replay, using real historical sessions, where you can pause the market mid print, say out loud what you think is happening, and then rewind to check whether you were right. That last part matters more than anything else I will say here. Live, the moment is gone forever. In replay, your reads become testable claims.
To practice reading Level 2 and Time and Sales, run structured drills in a market replay simulator rather than watching a live feed. Load a real historical session, pause it, and narrate the book out loud: inside bid and ask, spread, and where size is stacked. Then advance the replay and tag prints against the quote, noting whether trades hit the bid or lifted the offer. Rewind and rewatch any level break twice, once to form a read and once to verify it. Add a Wyckoff style effort versus result drill, comparing bursts of tape activity against actual price progress, and finish with speed laps at faster replay settings to build recognition under pressure. Keep a log of each read and its outcome. Replay makes this trainable because the same session can be repeated, slowed down, and checked, which a live feed never allows.
What the Two Panels Actually Tell You
A quick grounding, because the drills depend on it. Level 2 shows resting limit orders, prices at which traders have committed to buy or sell if the market comes to them. A limit order, as the SEC's investor education site puts it, is an order to buy or sell at a specific price or better, and until it fills or cancels it sits visibly on the book. That is what you are looking at: a queue of intentions, organized by price and venue. The investor.gov page on order types is worth five minutes if that sentence contained anything new.
Time and Sales is the other side of the ledger. It shows executed trades, the prints, each with a time, price, and size. In US equities those reports flow through the consolidated tape, the electronic system that reports last sale price and volume across US market centers. The distinction is the whole game. The book is what people say they will do, and orders can be cancelled in an instant. The tape is what actually happened. Hidden and reserve order types also mean the book never shows you all the liquidity that is really there, which is one more reason the tape gets the final word.
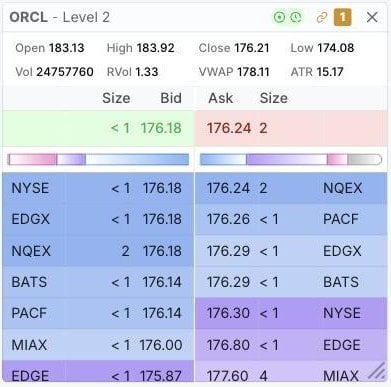
The Level 2 panel in TradingSim on ORCL, session of April 23, 2026, replayed to 2:30 p.m. ET. Inside market 176.18 by 176.24, with bids from NYSE, EDGX, NQEX, and BATS at the 176.18 and 176.14 levels and offers stepping up from 176.24 to 177.60 across seven venues. The header carries the session stats: open 183.13, high 183.92, low 174.08, last 176.21, VWAP 178.11.
Why Replay Is the Right Classroom for This
Nobody learns the tape from a definition. The traders who read order flow well got there by watching enormous amounts of it, and the honest problem with doing that live is arithmetic. The market gives you one opening drive per day. If reading the open off the tape is the skill you want, live practice hands you five repetitions a week, and every one of them arrives exactly once, at full speed, with no rewind.
Replay changes the arithmetic. In TradingSim you load a real historical session, press play, and the book and the tape move exactly as they did that day. You can pause mid sequence, jump back ninety seconds, run the same three minutes five times, or push the speed up once a pattern starts to feel familiar. One evening can hold a week's worth of opens. A word on scope before you build drills around it: the platform simulates equities and futures. Equity symbols carry both the Level 2 depth panel and Time and Sales. Futures symbols carry Time and Sales but no Level 2 ladder, so tape drills transfer to futures directly while book drills are an equities exercise. There is no options or forex simulation, and I would rather tell you that here than have you discover it mid drill.
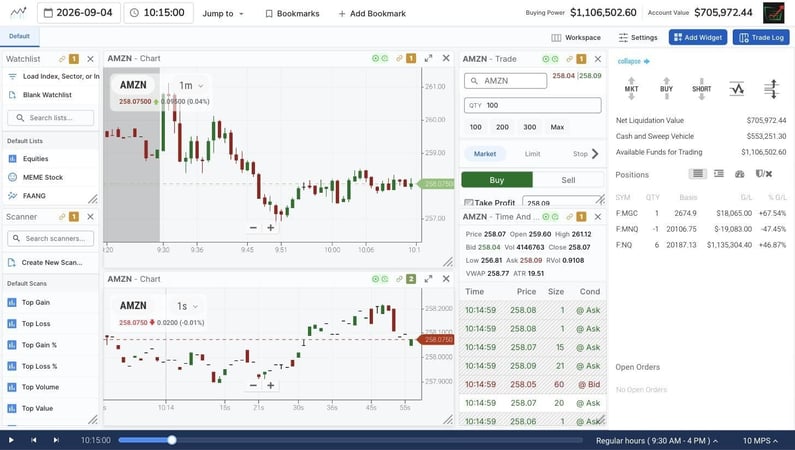
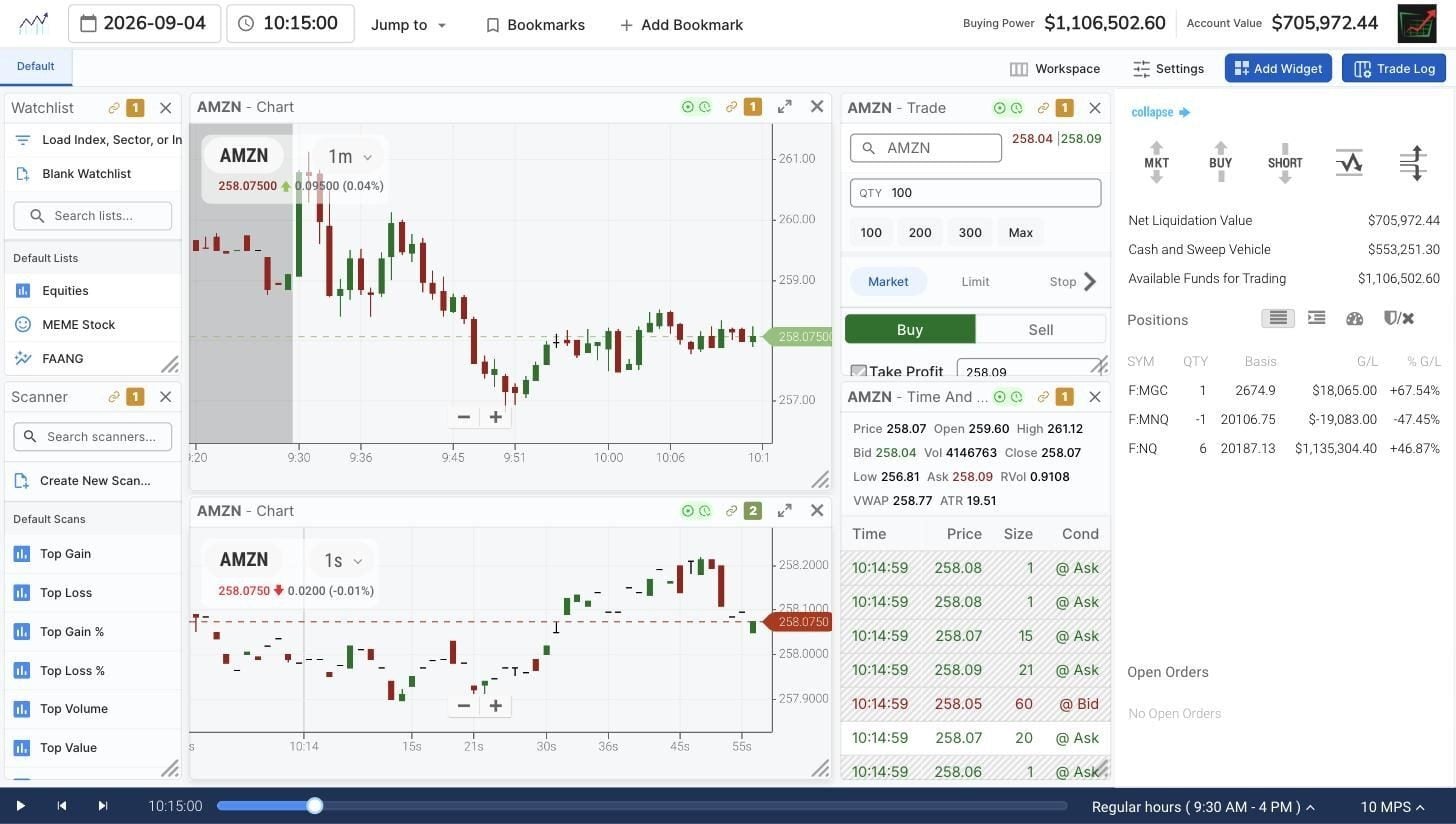
A replay workspace built for tape practice: AMZN, session of September 4, 2026, replayed to 10:15 a.m. ET. A 1-minute chart for context, a 1-second chart for execution detail, and Time and Sales on the right quoting 258.04 by 258.09, with the session having opened at 259.60 and printed a 261.12 high against a 256.81 low to that point.
Drill 1: Narrate the Book Out Loud
Load an equity session you have not studied, pause the replay somewhere mid morning, and describe the Level 2 panel out loud in complete sentences. Where is the inside market. How wide is the spread. Which side has more size stacked near the touch, and where is the first gap in the ladder. On the ORCL book above, that narration sounds like this: inside market 176.18 by 176.24, a six cent spread, three venues on the 176.18 bid with two more a step below at 176.14, offers layered every few cents up to 176.30 and then nothing until 176.80. That gap above 176.30 is a fact about the book worth saying out loud, because thin patches are where price moves fast when it moves.
Do this ten times per session at ten different timestamps. It feels remedial for about two days. What it builds is the ability to take in the whole panel as a single picture rather than reading it cell by cell, and that is the difference between knowing what Level 2 means and being able to use it while a position is open.
Drill 2: Tag Prints Against the Quote
Now let the replay run at normal speed and watch Time and Sales with one question: is this print a buyer crossing the spread or a seller. TradingSim tags each print for you in the condition column, at the ask, at the bid, or between, and the drill is to call it before your eye reaches the tag. Prints lifting the offer are buyers paying up. Prints hitting the bid are sellers paying up, in the only currency that matters to an impatient trader, which is price concession.
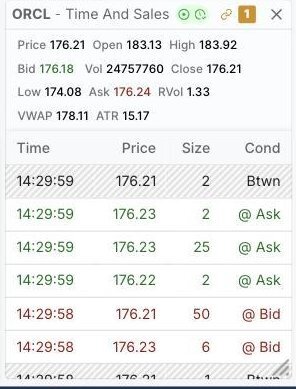
Time and Sales on ORCL, April 23, 2026, at 2:29:59 p.m. ET. In the same second the tape shows a size 25 print at the ask at 176.23 and, one second earlier, a size 50 print at the bid at 176.21. Each row carries the condition tag so you can check your call against the panel's.
One warning that belongs in this section and not in a footnote: a single print means almost nothing. The size 50 print at the bid in that ORCL sequence is not a signal, it is one data point inside a two way flow that was printing both sides of the quote within the same second. The drill trains classification, not prediction. Sequences are where meaning lives, and that is the next drill's territory.
Drill 3: Watch the Same Break Twice
Scrub the replay to a few minutes before an obvious level breaks, a prior low, the morning's range boundary, anything the chart makes plain. First pass: watch it live, no pausing, and write one sentence about what the book and tape did as price approached the level. Did the bids at the level thin out before the break or get eaten at full size? Did the tape speed up ahead of the move or only after it? Then rewind and watch the same approach again, slowly, checking your sentence against the replay.
Most traders discover their first sentence was partly fiction. That is the value. Live markets never offer a second viewing, so narratives go unchecked and bad pattern recognition compounds for years. Replay is the only environment I know where a tape read can be graded against ground truth within two minutes of making it, and the grading is the practice.
Drill 4: Effort Versus Result
This one is Wyckoff's law of effort versus result applied at tape resolution, and if that framework is new to you, my guide to the Wyckoff method covers it properly. The drill: when you see a burst of activity on Time and Sales, heavy printing, sizes larger than the session's normal rhythm, look at the chart and ask what price actually did. Effort with result is continuation. Effort without result, a flurry of prints at the offer while price goes nowhere, is absorption, someone with resting size taking everything the aggressors send without letting the market move.
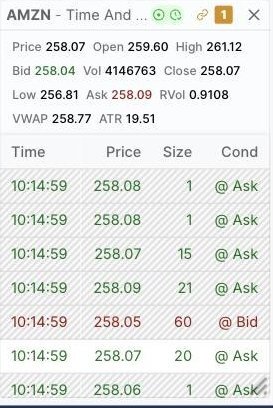
Raw material for an effort versus result read: AMZN, September 4, 2026, at 10:14:59 a.m. ET. Within one second the tape prints repeatedly at the ask between 258.07 and 258.09, including sizes 15, 20, and 21, while a size 60 print hits the bid at 258.05. Freeze a sequence like this in replay, form a read, then let it run and grade yourself against what price did next.
Run this drill on sessions with a clear trend day and again on a range day. The same tape behavior reads differently in the two contexts, and learning that contrast in replay costs you nothing, which is not the tuition rate the live market charges for it.
Drill 5: Speed Laps
Once your classification is reliable at normal speed, raise the replay rate and repeat drill 2 until your accuracy degrades, then back off one notch and hold there for a session. This is borrowed directly from the progression I laid out in my piece on scalping practice, where replay speed works as a difficulty dial. The point is not to read the tape at 10x forever. The point is that after twenty minutes at elevated speed, normal speed feels slow, and the reads that used to saturate your attention leave room to think about the trade.
Keep a Log You Can Check
Every drill above produces claims, and claims want a ledger. Mine has four columns: session and timestamp, what I read, what I expected over the next few minutes, and what actually happened. Nothing else. The last column is the one that separates this from journaling theater, because in replay you can always scrub back and fill it honestly. After two weeks the log tells you something no course can: which of your reads carry information and which are stories you like telling yourself. Keep the entries short and keep them falsifiable. A read you cannot grade is a read you cannot improve.
Where This Fits in a Practice Week
Tape work is one skill among several, and it earns two or three sessions a week, not all of them. I keep it inside the broader rotation I described in my day trading practice drills piece, alongside execution work and post session review. If you do not yet have a replay platform to run any of this on, my guide to choosing a day trading simulator covers what to look for, and the broader trading simulator pillar explains how the practice methodology hangs together. The panels themselves are ready the moment you load a session: pick a liquid name, scrub to 9:28 a.m., and start narrating. The first ten minutes will be humbling. The fiftieth replay open will not be.
Frequently Asked Questions
Does TradingSim include Level 2 and Time and Sales?
Yes for equities: equity symbols in replay carry a Level 2 depth panel showing bids and offers by venue and a Time and Sales panel with each print tagged at the bid, at the ask, or between. Futures symbols carry Time and Sales but not a Level 2 ladder. The platform simulates equities and futures only, with no options or forex.
Is the order book a guarantee of where price will trade?
No. Level 2 shows resting limit orders, and those orders can be cancelled at any moment. Hidden and reserve orders also keep some liquidity off the visible book entirely. Treat the book as a map of stated intentions and the tape as the record of what actually traded, and weight them accordingly.
Can I practice tape reading on futures in the simulator?
Yes. Futures symbols in TradingSim carry a full Time and Sales panel with session statistics, so print tagging, effort versus result, and speed drills all work on futures replay. The book narration drill is equities only, since futures symbols do not carry a Level 2 ladder in the platform.
How long until reading the tape feels natural?
It varies too much across traders for an honest number, and I distrust anyone who gives you one. What I can say from running these drills is that structure beats hours: ten narrated timestamps per session and a graded log move you faster than months of passively watching a live feed, because every read gets checked instead of forgotten.
Tags:
About the Author
Al Hill
Co-Founder & CEO, TradingSim
Alton Hill is the Co-Founder of TradingSim with over 18 years of trading experience. He completed the Design Thinking Bootcamp at Stanford’s D.School and brings expertise in Product Development to create the best trading simulation experience. His strategy focuses on trend-following systems, targeting high-volatility stocks with strong primary trends using the 15-minute chart.
10 Day Trading Practice Drills to Run in a Simulator
Ask a struggling trader what their plan is and you will usually hear some version of "more screen time." I spent years believing that too. Watch enough charts and the market will eventually reveal...
Scalping Practice: Building Speed on Replay Scalping punishes hesitation more than any other trading style. A swing trader who takes ten extra seconds to enter loses almost nothing. A scalper who...
Renko Charts Explained: How to Build and Trade Them [Updated September 2026]
What are Renko Charts You can trace renko chart’s origins to Japan and they were first introduced to the West by Steve Nison in his book “Beyond Candlesticks”. The actual word renko is derived from...








 Intro to Stock Charts