I know, Wyckoff sounds complicated. You've heard traders talk about "accumulation phases" and "composite man theory" and you think it requires a PhD in market structure to understand. It doesn't. Wyckoff is just a way of reading how institutional money moves through the market.
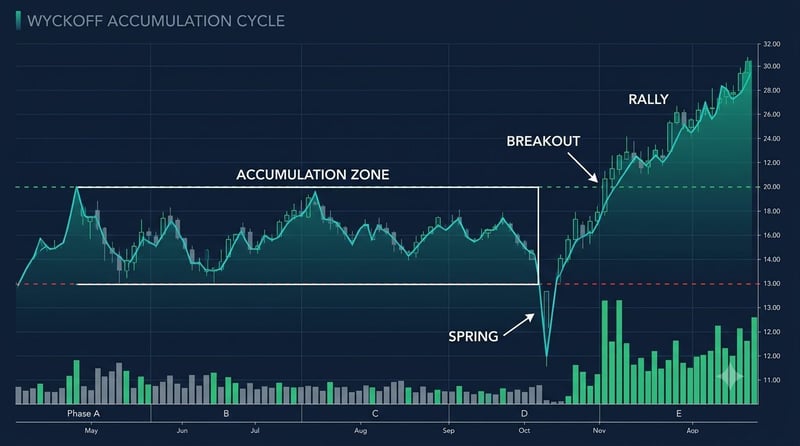
Remember: institutions move billions of dollars. They can't just buy 1 million shares at once or they'll push the price up and their average will be worse. So they accumulate slowly. They buy for weeks or months in a defined zone. This is the accumulation phase. When retail traders can't see the buying (because institutions are buying quietly), they panic and sell. Institutions shake them out with a fake breakdown (a spring). Retail sells at the worst possible time. Smart money covers the short sellers, and the stock rallies.
This is Wyckoff. Reading the footprints of smart money and fading the panic. Let me walk you through the laws, the phases, and exactly how to trade this on real charts.
What is the Wyckoff method? The Wyckoff method is a technical analysis framework developed by Richard D. Wyckoff in the early 1900s for reading how large institutions accumulate and distribute shares. It rests on three laws: supply and demand, cause and effect, and effort versus result. Price moves through four repeating phases: accumulation, where institutions buy quietly inside a range; markup, the uptrend that follows; distribution, where they sell into strength; and markdown, the decline that completes the cycle. Traders apply the method by reading price and volume together for signals like the spring, a failed breakdown below a range that shakes out sellers right before a rally, and the upthrust, a failed breakout above a range that traps buyers before a decline. Because it describes institutional behavior rather than any single indicator, the method works on stocks, futures, and most liquid markets on any timeframe.
The Three Laws of the Wyckoff Method
Richard D. Wyckoff developed this approach in the early 1900s and formalized it in the course he published in 1931. It's now 2026, and it still works. Why? Because human psychology hasn't changed. Institutions still need to accumulate slowly. Retail traders still panic. The same dance plays out over and over. If you want the full academic treatment, StockCharts' Wyckoff tutorial is a solid deep dive, and Wyckoff's own story is worth reading. He started as a stock runner at 15 and spent his career trying to level the field for the small trader.
The method rests on three laws, not fifty indicators:
Law 1: Supply and demand. When demand exceeds supply, price rises. When supply exceeds demand, price falls. Obvious on paper, but Wyckoff's insight was that you can actually read the balance between the two by comparing price bars with volume bars. Everything else in the method builds on this.
Law 2: Cause and effect. Price moves are never random. Accumulation is the cause; the markup that follows is the effect. Distribution is the cause; markdown is the effect. The size of the cause determines the size of the effect, which is why a stock that spent three months in accumulation tends to run further than one that based for a week.
Law 3: Effort versus result. Volume is effort. Price movement is the result. When there's heavy volume (effort) but price barely moves (result), something is wrong, and it usually means a reversal is close. This mismatch is the single most useful tell in the whole method.
These three laws are the foundation. Everything else is pattern recognition around them.
What Is the Composite Man in Wyckoff Theory?
Here's the powerful insight: instead of trying to figure out what thousands of institutions are doing, just imagine one "composite man" (smart money) doing it. This composite man has a playbook. He accumulates in a zone. He creates a spring to shake out retail traders. He tests his accumulation. Then he breaks out above it.
By understanding his playbook, you can predict his moves. Think of it like this: the composite man is a whale, and retail traders are minnows. The whale creates waves (price spikes and dips) to shake out the minnows. The whale doesn't care about the individual minnow. He's just trying to make space in the water to accumulate and distribute. Once the minnows are out, he moves in the direction he planned.
You're not betting on where the stock "should" go. You're betting on the composite man's plan, which is encoded in price and volume.
The Four Phases of the Wyckoff Market Cycle
Wyckoff breaks price action into four distinct phases. Understanding these phases is the entire edge.
Accumulation is when smart money buys quietly over weeks or months in a defined zone. They don't push price up yet because they want lower prices for more shares. Price bounces between a low (point of accumulation) and high (retail sellers) without breaking out. Volume spikes on down days (institutions buying dips) and runs lighter on up days. If you want a companion tool for spotting this, the accumulation distribution indicator was built to quantify exactly this behavior. The longer accumulation lasts, the bigger the eventual breakout.
Markup is when accumulation ends and smart money starts buying aggressively. Price breaks above the zone, creating higher highs and shallower pullbacks. Retail FOMO buys in. Volume expands on the breakout and stays healthy on rallies, lighter on pullbacks. Markup can last weeks or many months.
Distribution is when smart money takes profits. It looks like accumulation but isn't, and that's the trap. Institutions sell into every rally slowly, without pushing price down yet. Rallies get weaker even though price still reaches new highs. High volume shows up on up days (institutions selling), low volume on down days. The opposite of accumulation.
Markdown is the sell-off after distribution. Retail panics. Lower lows and lower highs. Rallies stay weak and don't hold. High volume on down days, lower on rallies. It can be fast and sharp or a slow grind.
What Is a Wyckoff Spring?
Here's the money trade in Wyckoff: the spring. A spring is a failed breakdown that happens during the accumulation phase. The stock breaks below the support level of the accumulation zone. Retail traders panic and short it. Then smart money covers the shorts and buys aggressively, and the stock bounces back above the zone.
Why do springs happen? Smart money is accumulating in a defined zone. They want to buy more shares, but retail traders are in the way. So they create a false breakdown to scare retail out. Retail sees the support break and panics. They sell. Some traders even short it, expecting a crash. Smart money quietly buys all this selling. Then they bounce it back up. The shorts are now underwater. They cover, which creates more buying pressure. The stock rallies sharply. The retail traders who sold at the low are devastated. "I got stopped out right at the bottom!" If that sentence stings, you've already met the spring; brushing up on support and resistance is how you stop being on the wrong side of it.
Identifying a spring. A spring has these characteristics:
- The stock has been consolidating in a range (accumulation zone)
- It breaks below the support of the range on unremarkable volume
- It stays below the support for only one or two candles
- It then bounces sharply back above the support zone
- The close is often back at or near the high of the zone
Volume pattern: low volume on the breakdown (no conviction), high volume on the reversal (smart money buying). The key difference from a real breakdown: real breakdowns have expanding volume and keep going lower. Springs have low volume on the break and reverse immediately.
Trading the spring. The spring is a setup to buy, not sell. Once you identify one: wait for the reversal back above the support level. When price closes back above support on expanding volume, that's your entry. Stop loss goes below the spring low. Target is the high of the accumulation zone, or above it.
To make the mechanics concrete, suppose a stock accumulates between $100 and $105 for three weeks, breaks below $100 on light volume, then reclaims $100 the next day on heavy volume. Your risk is the distance from entry to just below the spring low, call it a point and change. Your target is the top of the zone and beyond. That asymmetry is the entire appeal of the setup.
What Is a Wyckoff Upthrust?
The upthrust is the spring's mirror image at the top of a range, and in classic Wyckoff it's the signature of distribution. An upthrust is a move above the high of the range that fails. The stock breaks above the zone, retail FOMO buys the breakout, then smart money sells into that buying and the stock rolls back inside the range.
Identifying an upthrust. An upthrust has these characteristics:
- The stock has been trading in a defined range
- It breaks above the high of the range, often on strong volume
- It trades outside the range only briefly
- It then reverses and closes back below the range high
- Often it closes back inside the range entirely
The break and reversal might happen in a day or two, or take a week. But the upthrust fails to hold, and that failure is the information.
Trading the upthrust. The upthrust is a signal to fade the move, not chase it. Don't buy the break above the zone. Wait to see whether it holds. If it gets rejected and price falls back inside the range, smart money is not supporting the move. That's a warning that distribution is underway and the phase is changing. Experienced traders sometimes short the failed break; for most, the better lesson is simply to stop buying breakouts that smart money is selling into.
Which Markets Work Best for Wyckoff Trading?
The Wyckoff method works on any liquid instrument, but the execution differs.
Futures (ES, NQ) give you the cleanest patterns. Why? E-mini S&P 500 futures trade nearly around the clock, roughly 23 hours a day on CME Globex, with only a short daily maintenance break. There's no overnight gap-and-reset ritual like stocks have, so institutional campaigns leave smoother footprints. Springs and upthrusts are easier to see, and phases are more distinct. I like 15-minute or hourly charts for day trades and 4-hour charts for swings.
Individual stocks follow Wyckoff too, but patterns develop more slowly because the market is only open six and a half hours a day and every session opens with a gap risk. Stocks also frequently show a "test" after the spring, where price comes back down toward the spring low on lighter volume before breaking out. That test is a second entry opportunity, and honestly it's often the better one.
Longer timeframes suit swing and position traders. On daily and weekly charts, accumulation might last months, and the resulting markup can run for quarters. If that's your speed, the same logic applies, just slower; my swing trading guide covers how to manage trades that unfold over weeks instead of minutes.
How Volume Confirms Wyckoff Setups
Wyckoff is a volume-based method. Volume tells you whether smart money is actually in the trade. If you're shaky on reading raw volume bars, start with my volume analysis guide, then come back to this framework.
High volume at support with recovery. When price is at the bottom of a range, volume spikes on a down move, and price recovers instead of collapsing, that selling was absorbed. Someone big was on the bid. That's accumulation behavior.
Weak volume on rallies to new highs. When a stock grinds to new highs on shrinking volume and each rally gives back its gains faster, the buying is running out of participants. That's distribution behavior.
Effort versus result mismatch. This is Wyckoff's third law in action. Huge volume with almost no price progress means one side's effort is being fully absorbed by the other. Near the top of a trend, extreme effort with minimal result is often the top. Near the bottom, it's often the bottom. Reading these mismatches takes practice, but once you see it, you can't unsee it.
Entry and Exit Rules for Wyckoff Trades
Let me give you exact rules so you can execute without guessing.
The spring entry. Setup: an accumulation zone at least two weeks old, a break below support on light volume, then a reclaim of support on expanding volume. Entry: the close back above support, or the next open if it opens above support. Stop: just below the spring low. Target: the top of the zone first, then the height of the zone projected above it.
The test entry. Setup: a spring has already occurred and price bounced. Price then drifts back down toward the spring low on lower volume and holds. Entry: the reversal off the test level. Stop: just below the test low. Target: the top of the zone or beyond. Why it works: traders who bought the spring bounce get nervous at the test and sell. Smart money buys their shares. You're buying weakness alongside the composite man instead of chasing strength with the crowd.
The breakout entry. Setup: accumulation looks complete, no fresh springs or tests, and price breaks above the top of the zone on expanding volume. Entry: the breakout candle, or a pullback within the first few candles after it. Stop: back inside the zone. Target: project the height of the zone above the breakout point. This is the same trade logic I walk through in my day trading breakouts guide, with the Wyckoff phase work telling you which breakouts deserve your trust.
How to Train Your Eye for Wyckoff Patterns
Here's how to train your eye on the day trading simulator:
Step 1: Load a stock or index future that had a major rally.
Step 2: Go back six to eight months before the rally started. You want to see the entire cycle: accumulation, markup, distribution, and the start of markdown.
Step 3: Replay it slowly, day by day on daily charts or bar by bar intraday. As you watch, ask: Where is the accumulation zone? Did I see a spring? Was there a test? When was the breakout, and did volume expand? How long did markup last? Where did distribution start? How far did markdown carry?
Step 4: Trade it virtually. Mark the zone on the chart. When you see the spring, enter. Track whether you'd have been profitable. Exit at your target.
Repeat this twenty or thirty times with different symbols and timeframes. By the time you're done, you'll spot accumulation from across the room. You'll feel the spring coming. And you'll have built the skill on replayed market data instead of tuition paid to the market.
Wyckoff Method FAQ
Does the Wyckoff method work in downtrends?
Yes. The cycle simply inverts. Distribution forms at the top, upthrusts trap the buyers, and markdown is the tradeable trend. You can short failed rallies inside distribution the same way you buy springs inside accumulation. Learn the long side first; it's easier to internalize.
How do I tell accumulation from ordinary sideways consolidation?
Volume structure. Accumulation shows heavy volume on dips that recover and quieter volume on rallies, and it's usually punctuated by a spring. Random consolidation has random volume and no shakeout. If you can't find the volume story, assume it's just chop.
How long does accumulation need to last before a breakout is trustworthy?
Longer causes produce bigger effects. On a daily chart, a base measured in weeks beats one measured in days. Intraday, the same principle scales down. There's no magic number; the point is that the size of the range and its duration set the expectation for the move.
Can I trade Wyckoff on crypto or forex?
The logic applies to anything institutions accumulate, but the patterns read cleanest on liquid stocks and index futures. While you're learning, stay where the volume data is most honest.
What if I buy a spring and it fails?
You exit at your stop. Some springs are false and price breaks down again. That's normal. No pattern works every time, and the spring's edge comes from its asymmetry: small defined risk below the spring low against a target across the full range. Take the stop and move to the next setup.
In Summary
Wyckoff is the institutional playbook. Accumulation, spring, test, breakout, markup, distribution, markdown. The cycle repeats because human psychology hasn't changed since Wyckoff wrote it all down.
Your edge is recognizing accumulation before retail does, buying the spring when retail panics, holding through markup, and understanding distribution so you don't donate your gains back in the markdown. Volume is your confirmation tool throughout, and price action is the language the phases are written in.
The best way to learn Wyckoff is to replay it on real charts. Load TradingSim, find a symbol that had a major move, go back six months, and replay the entire cycle bar by bar. Watch the accumulation form. Feel the spring. See the breakout. Do this thirty times and you'll have an edge most retail traders never develop.








 Awesome Day Trading Strategies