

3 min read
Intro to Stock Charts

8 min read
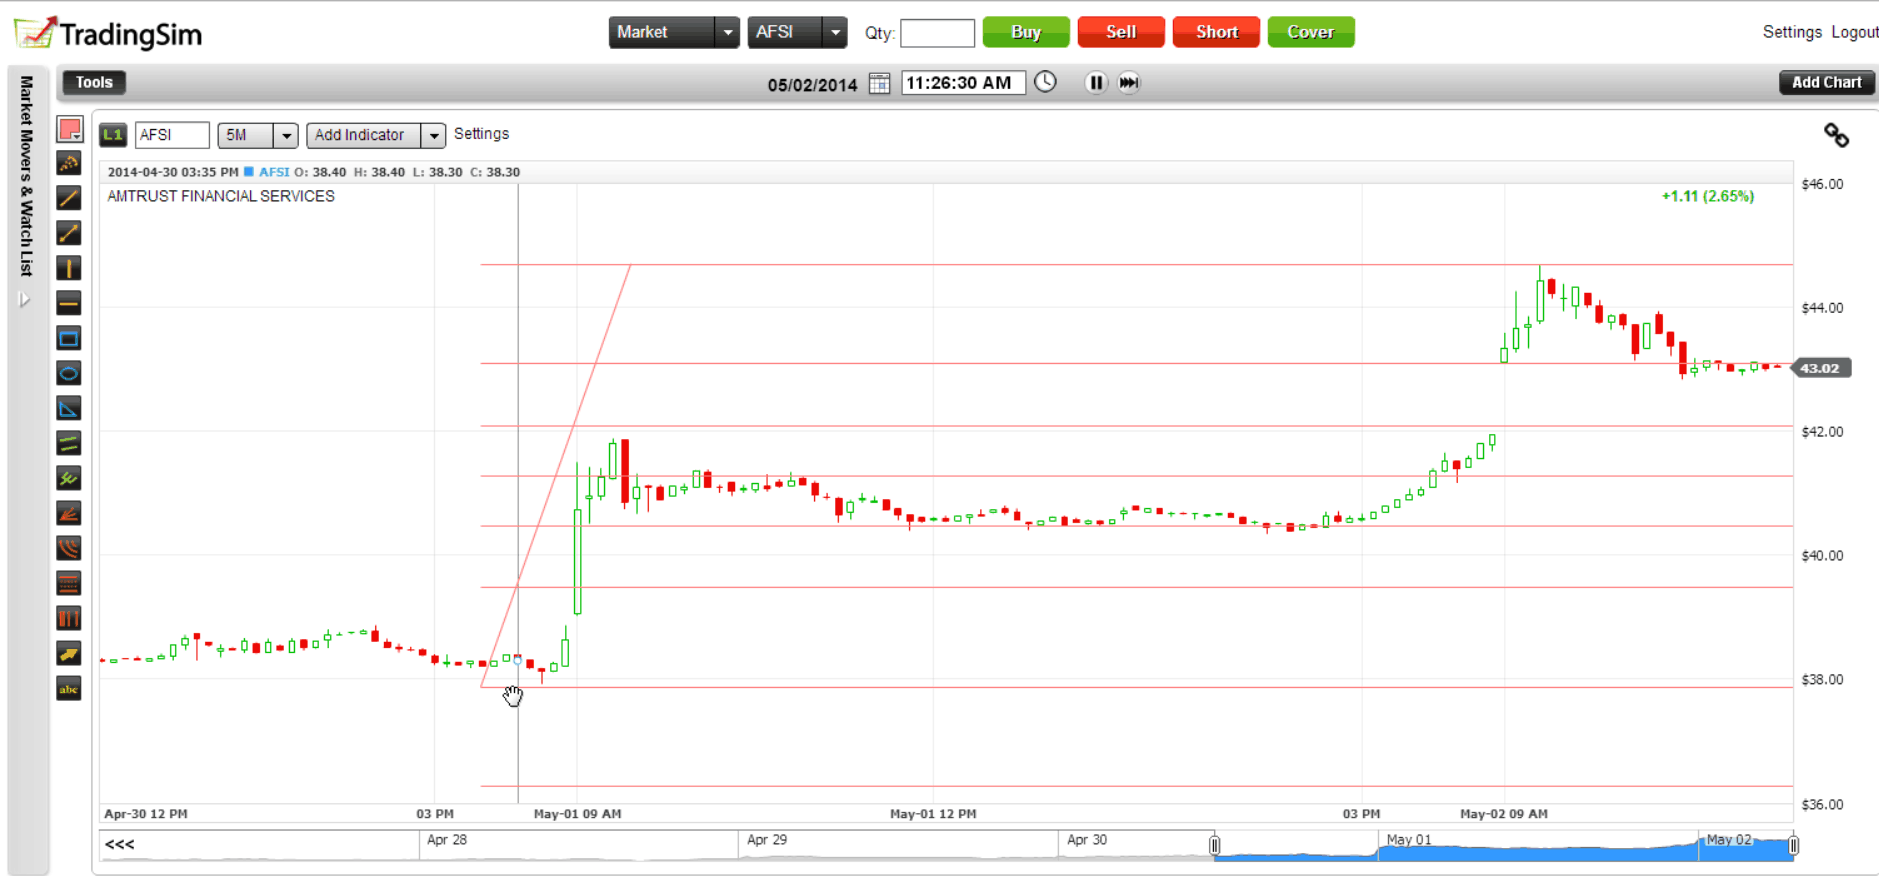
Best Free Stock Charts for Day Traders [Updated May 2026]
Last reviewed and updated by Al Hill on May 20, 2026. Links verified, schema refreshed, and an expanded FAQ added at the bottom of this guide.
Free...
4 min read
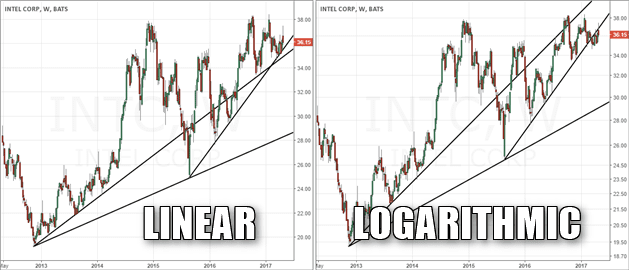
5 Key Differences between Logarithmic Scale and Linear Scale
Last Updated: March 31, 2026
Every stock chart contains two axes – x-axis to plot time and the y-axis to plot price.
There are basically two ways to plot price – linear and...
5 min read
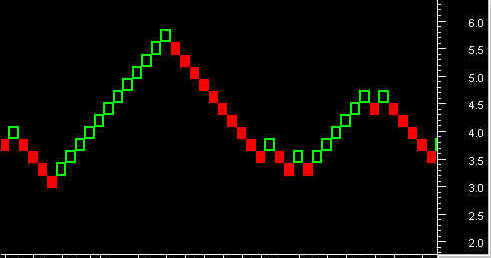
How to Trade Using Renko Charts
Last Updated: March 31, 2026
What are Renko Charts
4 min read
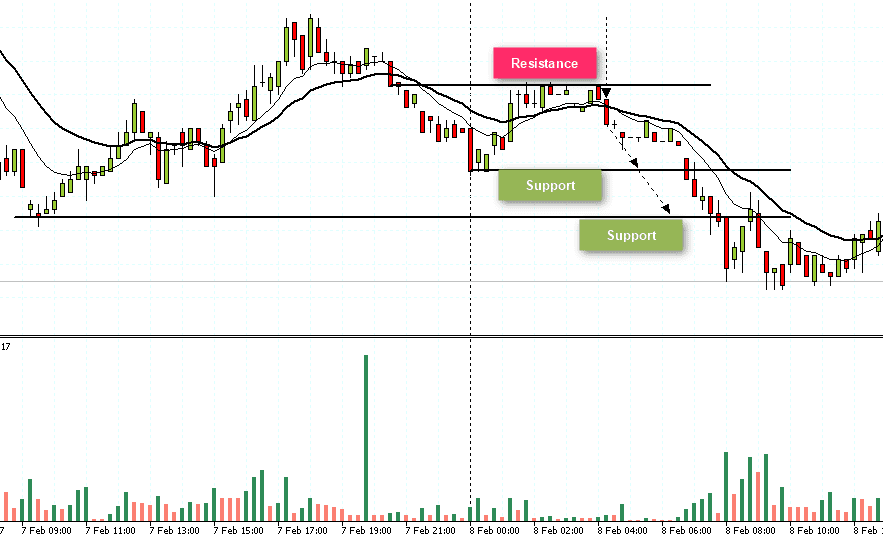
What are the components of a stock chart
Last Updated: March 29, 2026
7 min read
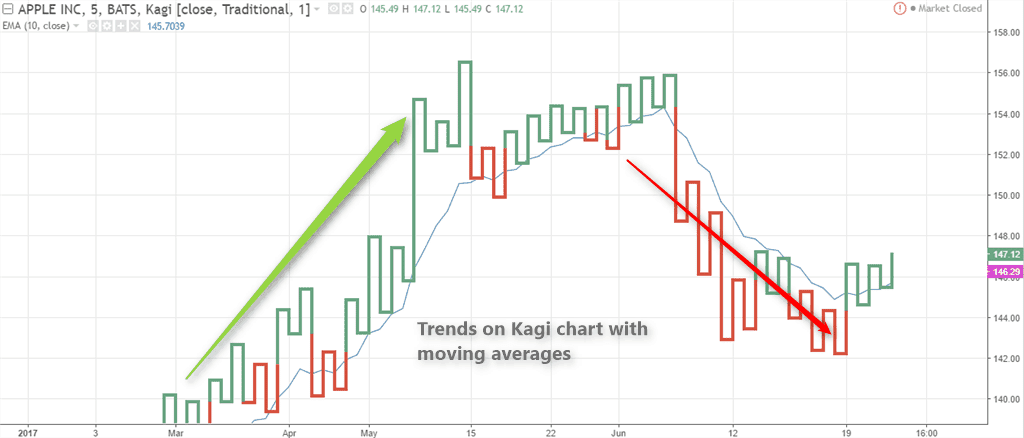
Kagi Charts – 7 Things You Need to Consider
Last Updated: March 29, 2026