Pre Market Trading: What It Is, How It Works, and How Traders Use It
Apr 3, 2026
Written by: Kunal Vakil
✓ Reviewed by Al Hill, Co-Founder of TradingSim · Updated Apr 3, 2026
🎧 Listen to this article (6 min 23 sec)
What Is Pre Market Trading?
Pre market trading accounts for roughly 6% of daily U.S. stock volume — about 1.02 billion shares changing hands every morning before 9:30 AM ET (NYSE Research, Q1 2025). That number has grown 15-fold since 2019. If you trade U.S. stocks, the session before the opening bell is no longer optional knowledge. This guide breaks down exactly how pre market trading works, what moves prices during those early hours, and how to build a rules-based approach around it.
Pre market trading is the buying and selling of stocks before the regular U.S. stock exchange session opens at 9:30 AM Eastern. The session runs from 4:00 AM to 9:30 AM ET, though the bulk of activity clusters between 7:00 AM and 9:30 AM. The SEC defines regular trading hours as 9:30 AM to 4:00 PM ET — anything outside that window falls under “extended hours.”
During pre market hours, trades go through electronic networks (ECNs) instead of the main exchanges. Buyers and sellers match up directly, without the full set of market makers who work the regular session.
Why does this session exist? Because news doesn't stop at 4:00 PM. Earnings reports, jobs data, moves in Asian and European markets, and world events happen around the clock. Pre market trading lets you react to — or get ahead of — those events before the crowd shows up at 9:30.
Who Trades Pre Market — and How Much Volume Is There?
Extended hours trading now represents over 11% of all U.S. equity volume, with more than 1.7 billion shares traded daily outside regular hours (NYSE Research, January 2025). Pre market alone captures the majority of that — over 55% of all extended-hours volume happens before the opening bell.
This wasn't always the case. Ten years ago, pre market was mostly big firms reacting to news that broke overnight. Retail traders had few ways in and little reason to try. That shifted fast. NYSE Arca data shows pre market volume has surged 15-fold since 2019, pushed by brokers opening up access and retail traders chasing an edge on morning catalysts.
J.P. Morgan reported that retail order flow hit 36% of total market trades on April 29, 2025 — an all-time high. A big chunk of that retail trading now happens before the bell. Brokers like Schwab, Fidelity, Interactive Brokers, and Webull all offer pre market access, though each sets its own start times and order rules.
The takeaway: pre market is no longer a niche session for Wall Street insiders. It's a real trading environment with real volume.
Pre Market Trading Hours: When the Action Actually Happens
The official pre market window runs from 4:00 AM to 9:30 AM ET, but not all hours are equal.
Pre-market trading hours: activity and liquidity by time window
4:00 AM – 7:00 AM ET: The Early Session
This window is thin. Liquidity is low, spreads are wide, and most of the action comes from big firms. Unless a major catalyst dropped overnight — a large-cap earnings beat, a Fed statement, or a big world event — there's little reason for most traders to be here. Some brokers don't even let you trade before 7:00 AM.
7:00 AM – 8:00 AM ET: Volume Builds
More traders log on. Key economic data (jobless claims, GDP, inflation) often drops at 8:30 AM ET, so traders start setting up ahead of those prints. Spreads begin to tighten as more market makers and ECN players show up.
8:00 AM – 9:30 AM ET: The Core Pre Market
This is where the real action is. Volume picks up, spreads narrow (still wider than normal hours), and prices start to find their levels. Most retail brokers give you full access here. Stocks that gapped overnight lock in their pre-market ranges, and traders start mapping out the setups they'll trade at or after the open.
How Pre Market Orders Work
FINRA notes that most brokers require limit orders during pre market — market orders are typically disabled. This is a protective measure because of the thinner order book.
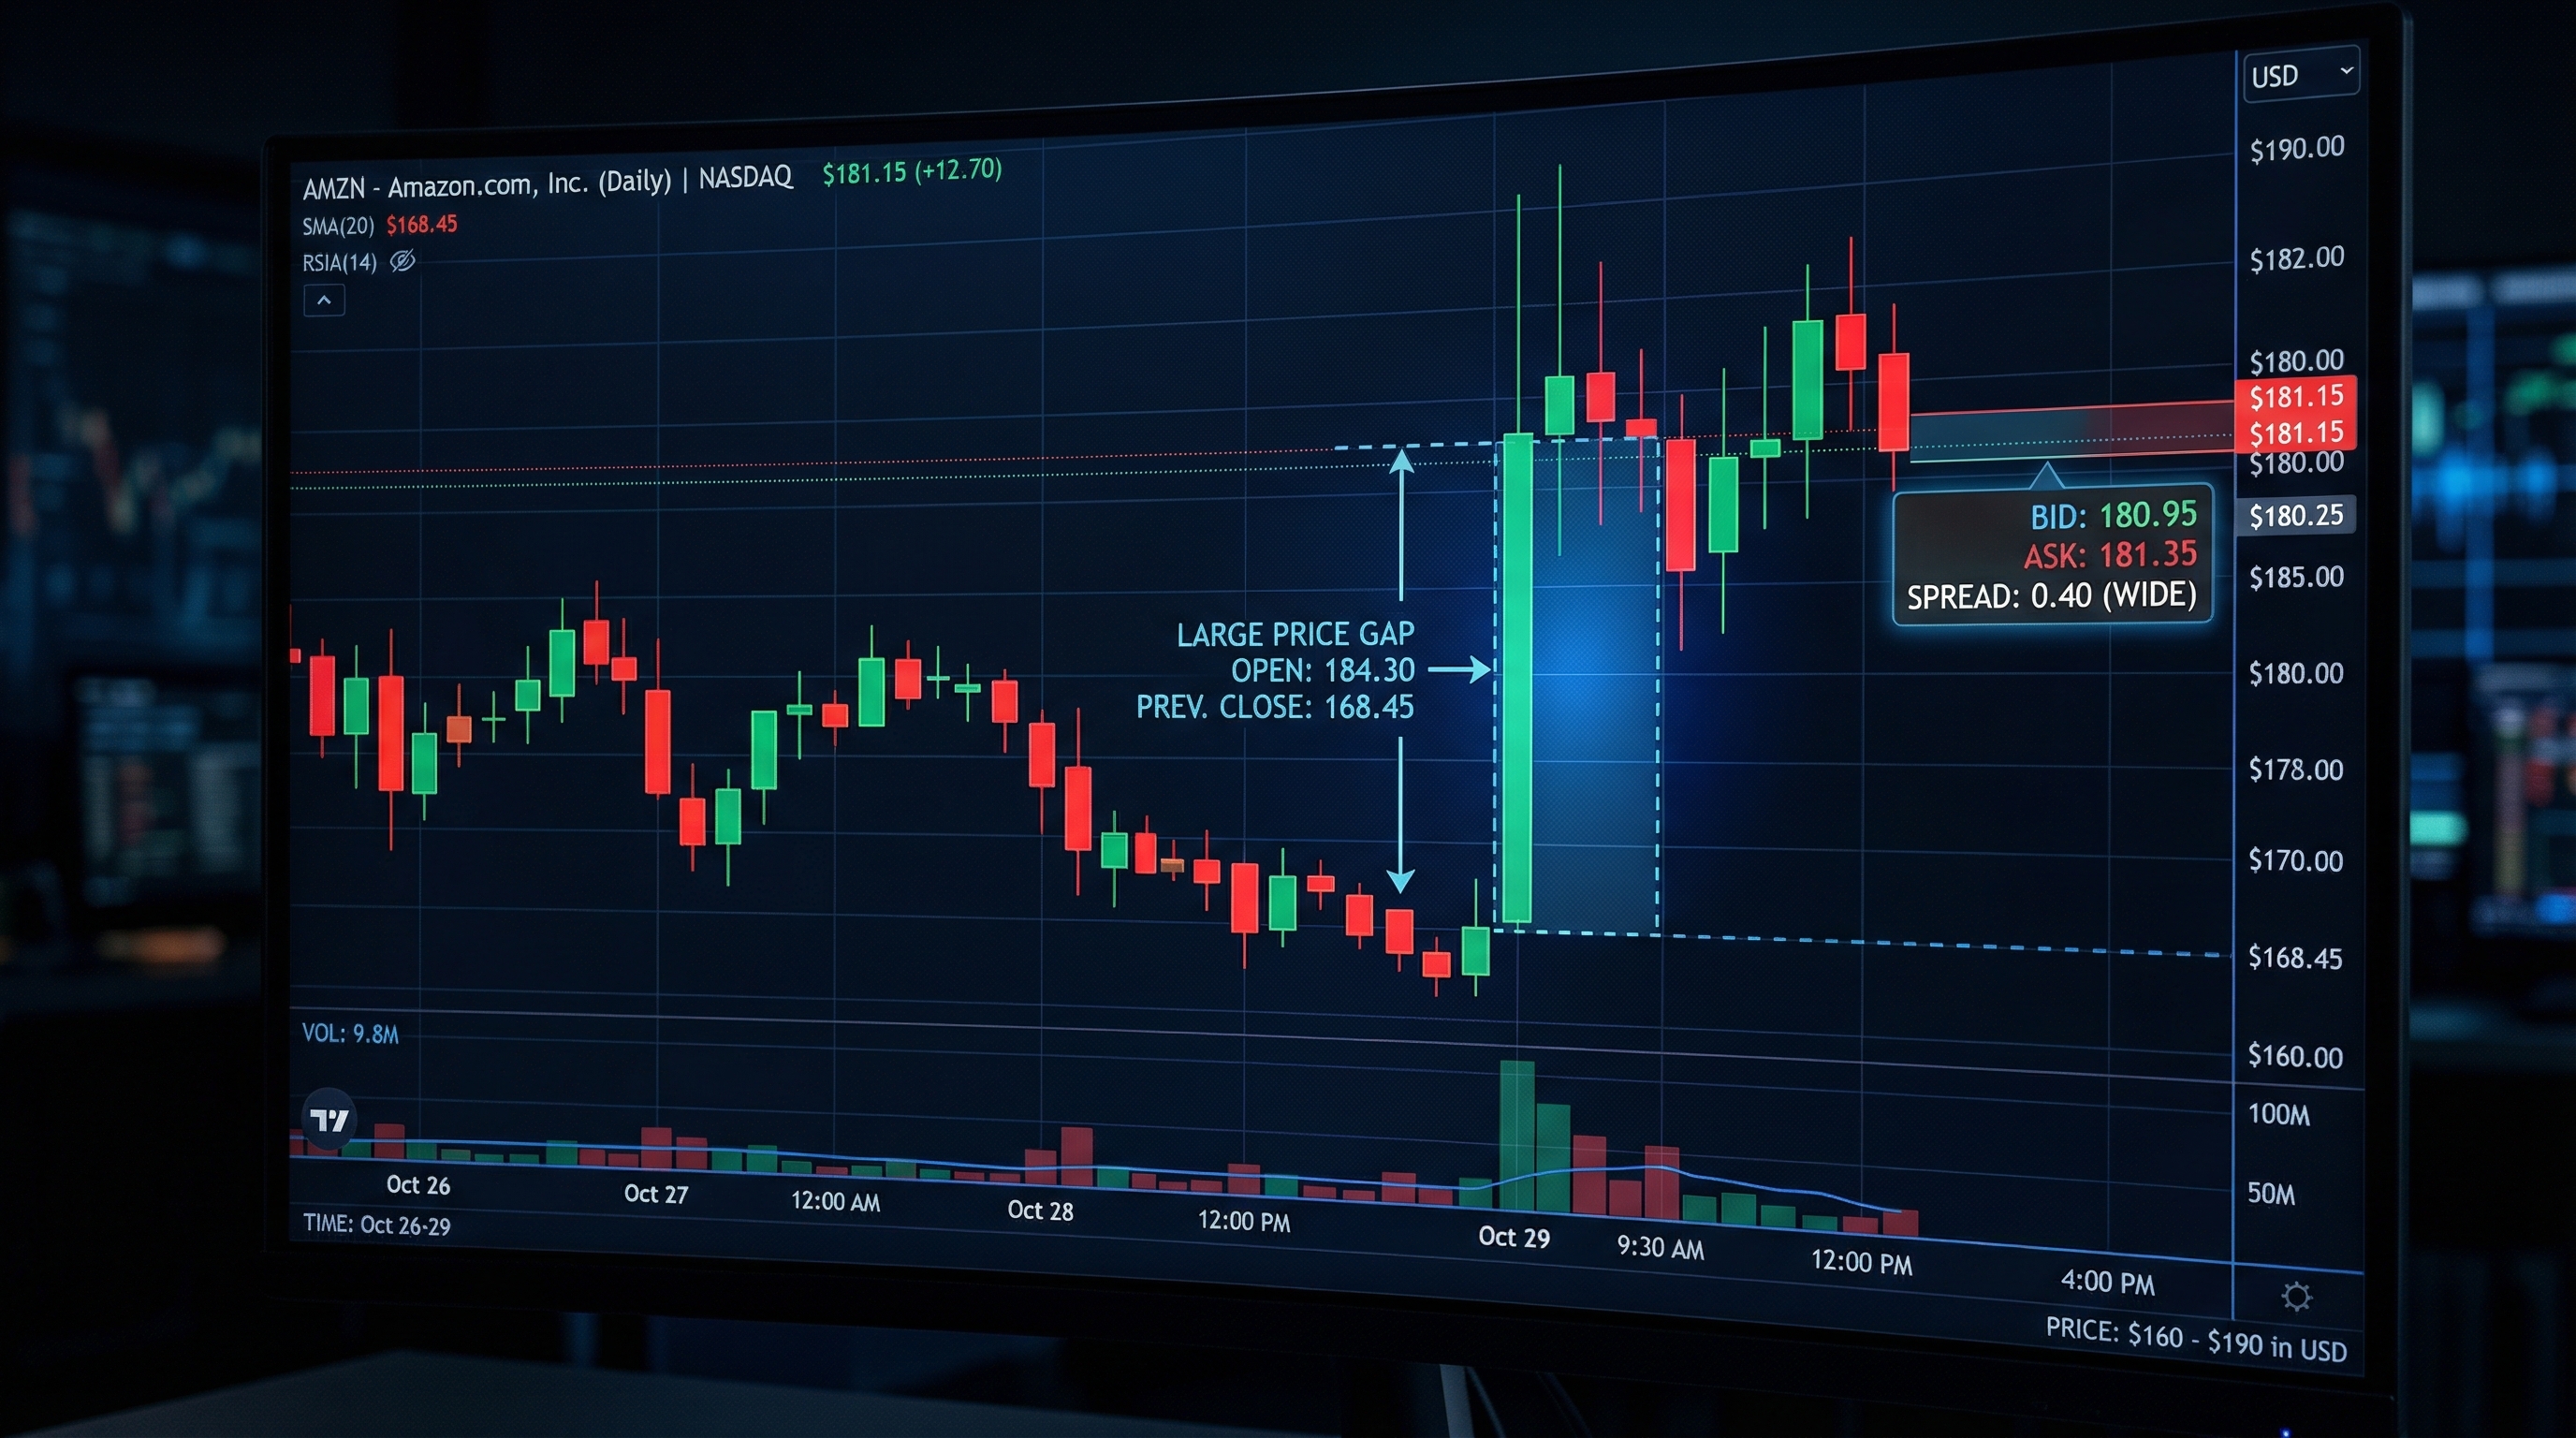
Here's what that looks like in practice. During normal hours, a stock might show a bid of $50.00 and an ask of $50.01 — a one-cent spread. During pre market, that same stock could show $49.85 bid and $50.15 ask — a 30-cent gap. A market order would fill at whatever price is out there, maybe 0.3% or more from the last trade. A limit order lets you set the most you'll pay (or the least you'll take on a sell), so you stay in control when the book is thin.
Key order rules during pre market
Most brokers enforce these rules: limit orders only (no market orders), day-only or extended-hours time limits (orders don't carry over), routing through ECNs (not the exchange floor), and blocks on some order types like stop-losses or trailing stops.
Check your broker's specific rules. Fidelity, for instance, opens pre market access at 7:00 AM, while Interactive Brokers offers it from 4:00 AM. The tools and order types available vary.
Regular vs. pre-market trading: key differences at a glance
Risks of Pre Market Trading
FINRA flags four main risks for traders in extended hours, and each one hits harder in the pre market because the early-morning session has even fewer players than the after-hours window.
Lower Liquidity
Fewer people trading means fewer buyers when you want to sell, and fewer sellers when you want to buy. A mid-cap stock might trade 2 million shares during the day. In pre market, that same stock might see 50,000 shares. If you need to get out of a trade fast, that thin book works against you.
Wider Spreads
The bid-ask spread in pre market can run 2 to 5 times wider than what you'd see during the day (Schwab). On a stock with a normal penny spread, you might see 10 to 50 cents between bid and ask. That's a hidden cost on every trade, and it adds up fast if you're trading size.
Price Gaps and Reversals
A stock might trade up 4% at 7:00 AM and give back the whole move by 9:35 AM once the full market opens and more traders weigh in. Pre market prices show you a snapshot based on thin data and thin volume. They're clues about direction, not locks on where the stock will trade once the bell rings.
Venue Fragmentation
During the day, the National Best Bid and Offer (NBBO) links prices across exchanges to keep you safe. That shield goes away in pre market. The price on one ECN might be worse than what's on another, and your broker may only route to one venue (FINRA).
What Moves Stocks in the Pre Market
Pre market price moves come from a short list of catalysts that repeat day after day. Knowing what to watch — and when — is what splits traders with an edge from those trading blind.
Key pre-market catalysts and when they typically hit
The single biggest driver of pre market moves. Companies report earnings either after the prior day's close or before the current day's open. A stock can gap 5%, 10%, or 20%+ on a surprise beat or miss. The pre market session is where the first real price action plays out for before-the-bell reports.
The above chart is of Best Buy from March 6, 2026. On this day Best Buy (BBY) reported better than expected earnings per share ($2.61 vs $2.47). As you can see in Tradingsim, BBY was down in the early trading window of 4:00 to 7:00 am and then once the news dropped at 8:00am, BBY shot up 10%. This is a 5-minute chart, so you can see an active trader would have had a total of 2 bars or 10 minutes to capitalize on the move.
BBY essentially stopped on a dime right at the 61.8% retracement. As a trader, you might have skipped the trade on the breakout but used the morning activity to define your trading range for the day. One simple strategy is to place your stop below the premarket pullback low and enter a long trade with a goal of retracing a portion of the pullback.
Remember there is more than one way to trade the market setups.
Economic Data Releases
Key economic reports drop at set times — often 8:30 AM ET — and can move whole sectors or the broad market in seconds. Non-farm payrolls (first Friday of each month), CPI/PPI inflation data, GDP prints, and weekly jobless claims are the big ones.
On March 6, 2026 the economy lost 92,000 jobs vs expectations of +59,000 — a miss of 142,000 jobs. The reaction was immediate: S&P 500 dropped 1.67%, Dow shed 793 points and entered correction territory, VIX spiked to 31.05. This all started in pre-market at 8:30 AM when the number hit.
From the Tradingsim chart, the Dow already began to selloff before the announcement and then took a plunge. Many of the bluechip stocks followed suit and had a sharp decline going into the market open.
However, after the selloff, this set the low for the day from which the market had a choppy push higher throughout the day.
So, what to make of these economic releases? If you are a day trader, use the announcements to understand the trading ranges for the day.
If you trade these events, you can see from both the earnings announcement or economic data, you can front run the setup but that requires being on the right side of the trade and you have minutes to capitalize on the move. I'm not here to give you financial advice, you will have to decide what feels right for your trading risk profile.
Overnight News and Global Markets
Asian and European markets overlap with early U.S. pre market hours. A big move in the Nikkei, DAX, or FTSE can set the tone for U.S. stocks before most traders here are awake. World events, central bank moves abroad, and swings in oil or gold all feed into pre market prices.
Analyst Upgrades, Downgrades, and Price Target Changes
Wall Street research desks often release ratings changes before the bell. A major upgrade from Goldman Sachs or a downgrade from Morgan Stanley can push a stock 3-5% in pre market on the headline alone — sometimes before any volume confirms the move.
Pre Market Trading Strategies
Good pre market trading comes down to reading patterns, sticking to rules, and sizing down because the thinner book punishes sloppy entries.
Gap and Go
When a stock gaps up on heavy pre market volume (compared to its norm), momentum traders look for a run to keep going. The setup: find a stock gapping 4%+ on a clear catalyst, wait for a dip to support within the pre market range, then enter with a tight stop below the pullback low. The key filter is volume — a gap on thin volume is far more likely to fade.
Opening Range Breakouts
The opening range breakout (ORB) is a common occurrence in morning trades, but hard to navigate. The below chart is of CAVA from 2/26.
First CAVA breaks out after hours and this strength continues into the pre-market. You can see CAVA then breaks the range in the pre-market and continues on the open.
This breakout continues into the 10am time frame, consolidates and experiences an opening range breakout that pushes CAVA higher into the close.
All in all, CAVA gapped up 8.8% in the premarket, then kept running to close up 25%+ by end of day.
I personally traded ORBs for years and while they can work, your risk versus reward can be tricky as you are taking on more risk as false breaks are a common occurrence with the advent of high frequency trading.
Example 2: NVDA Opening Range Breakout
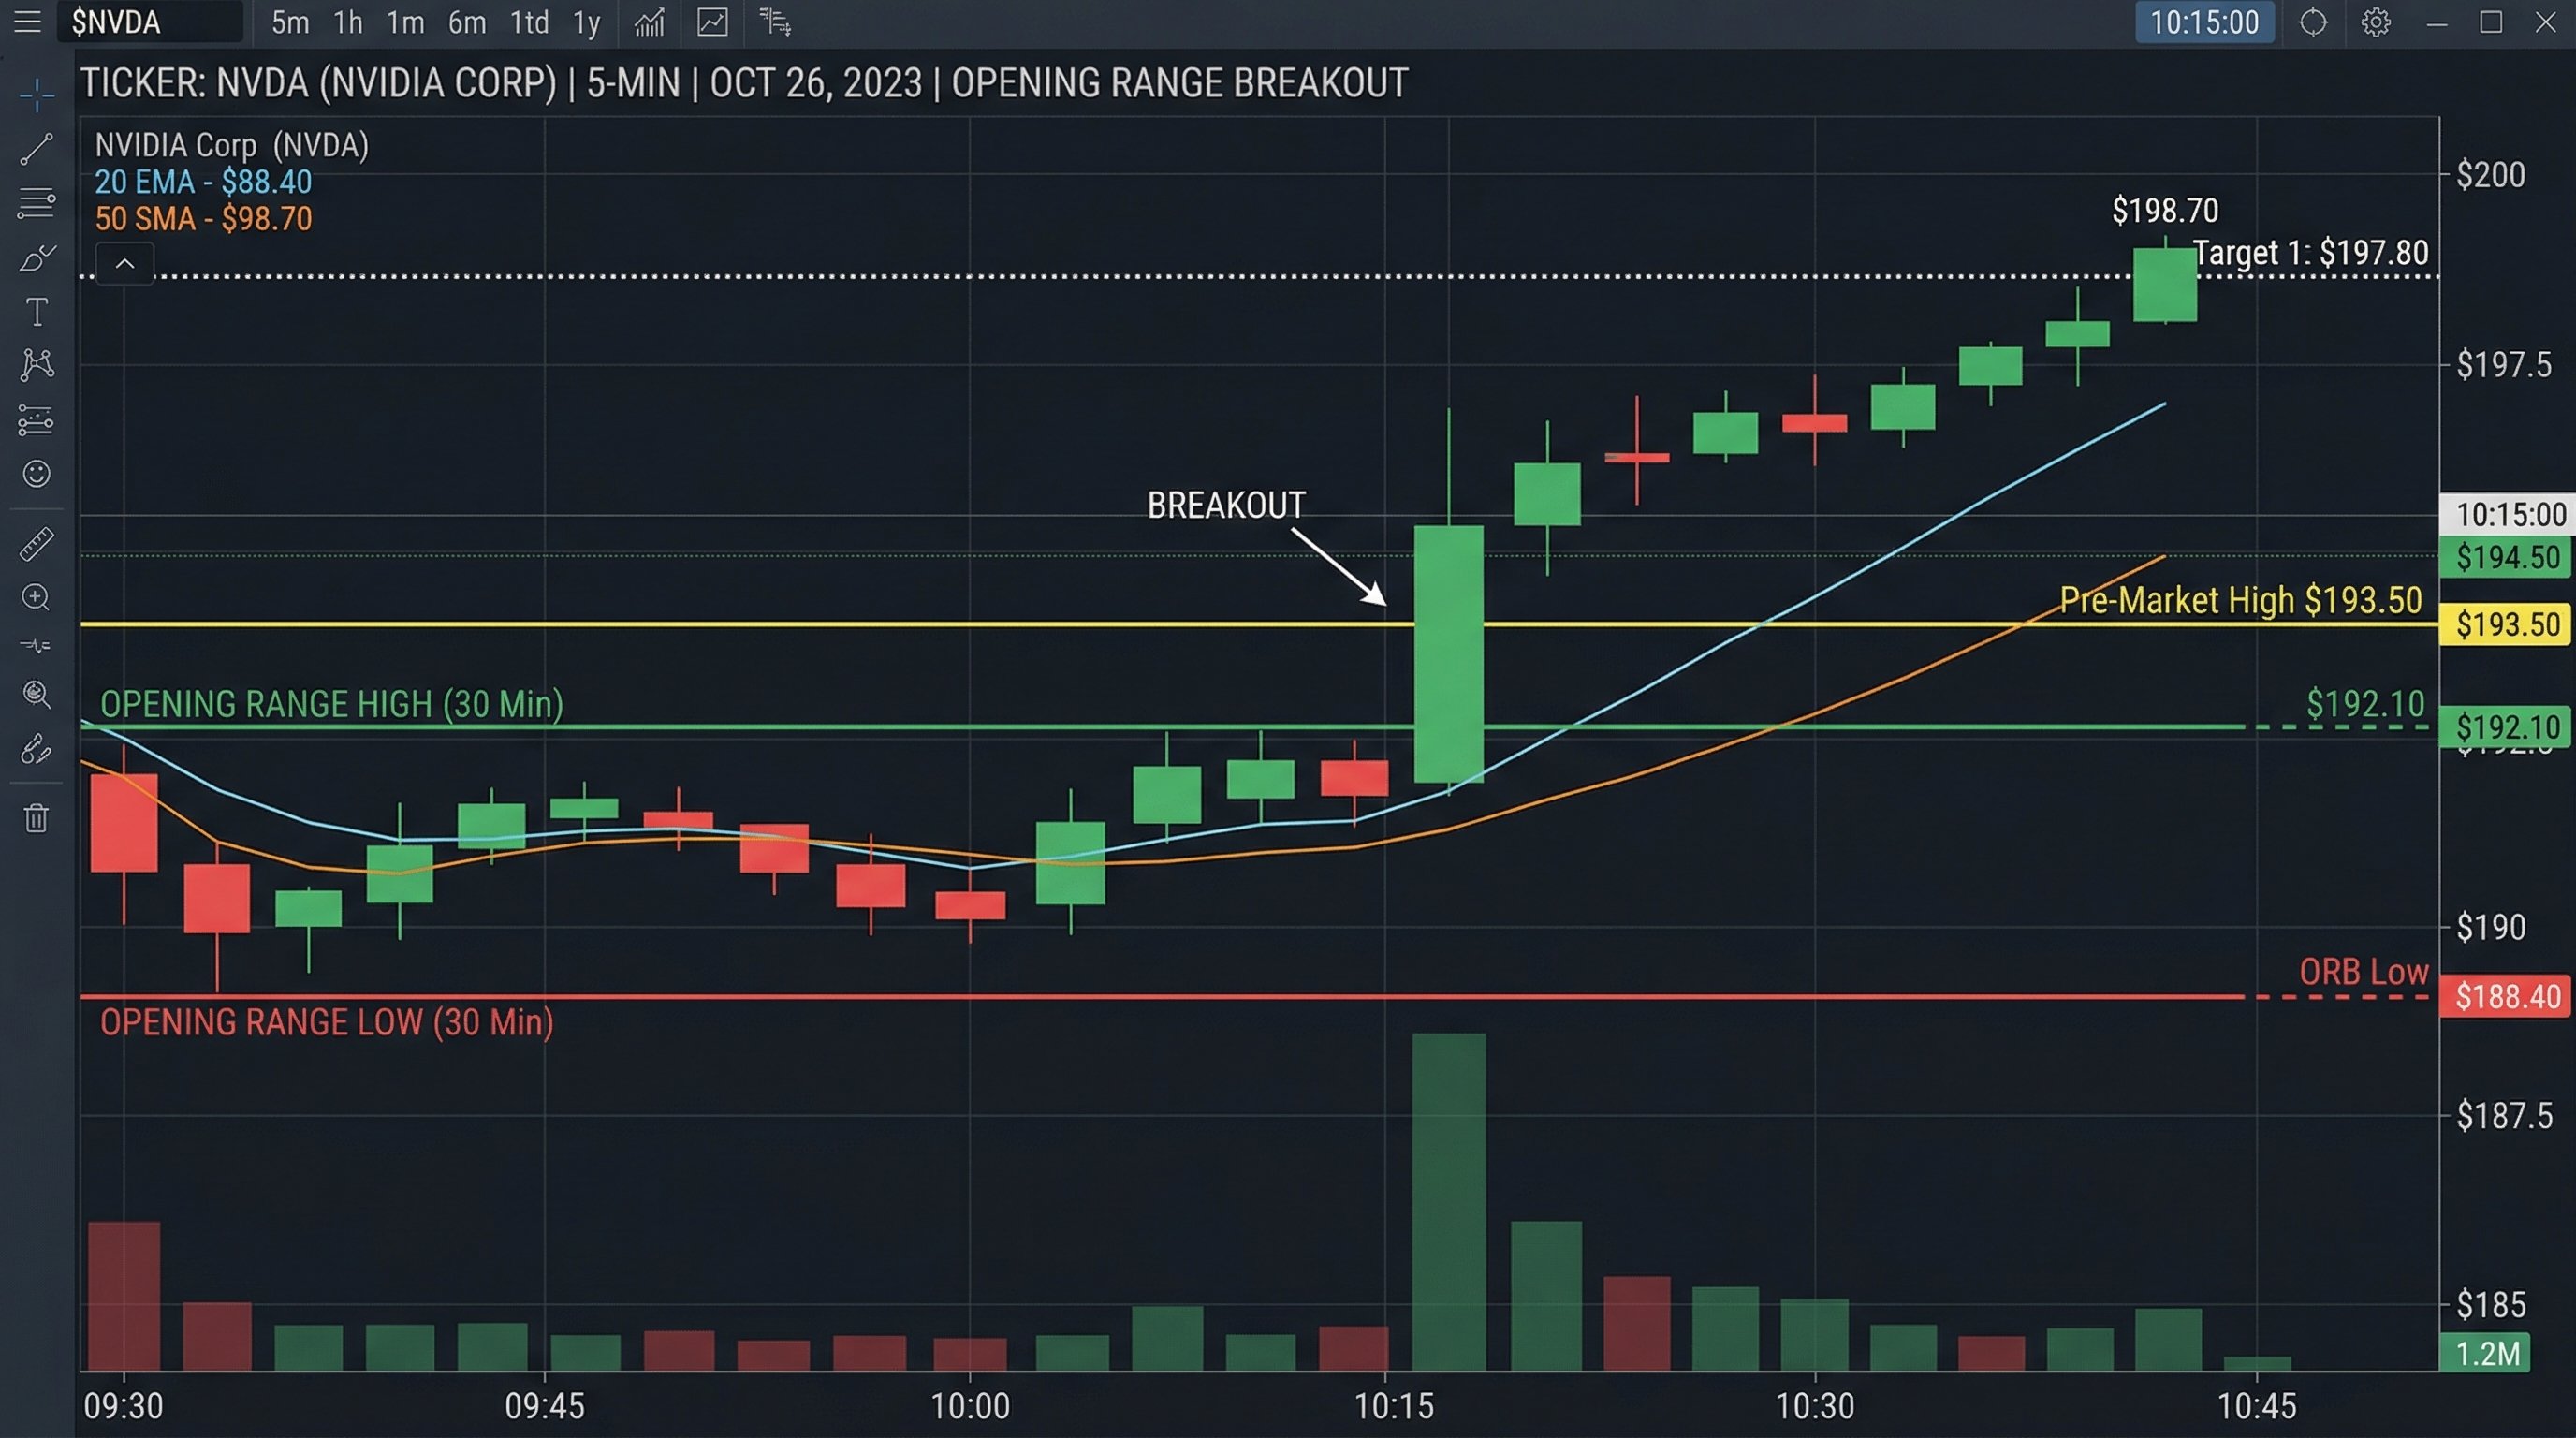
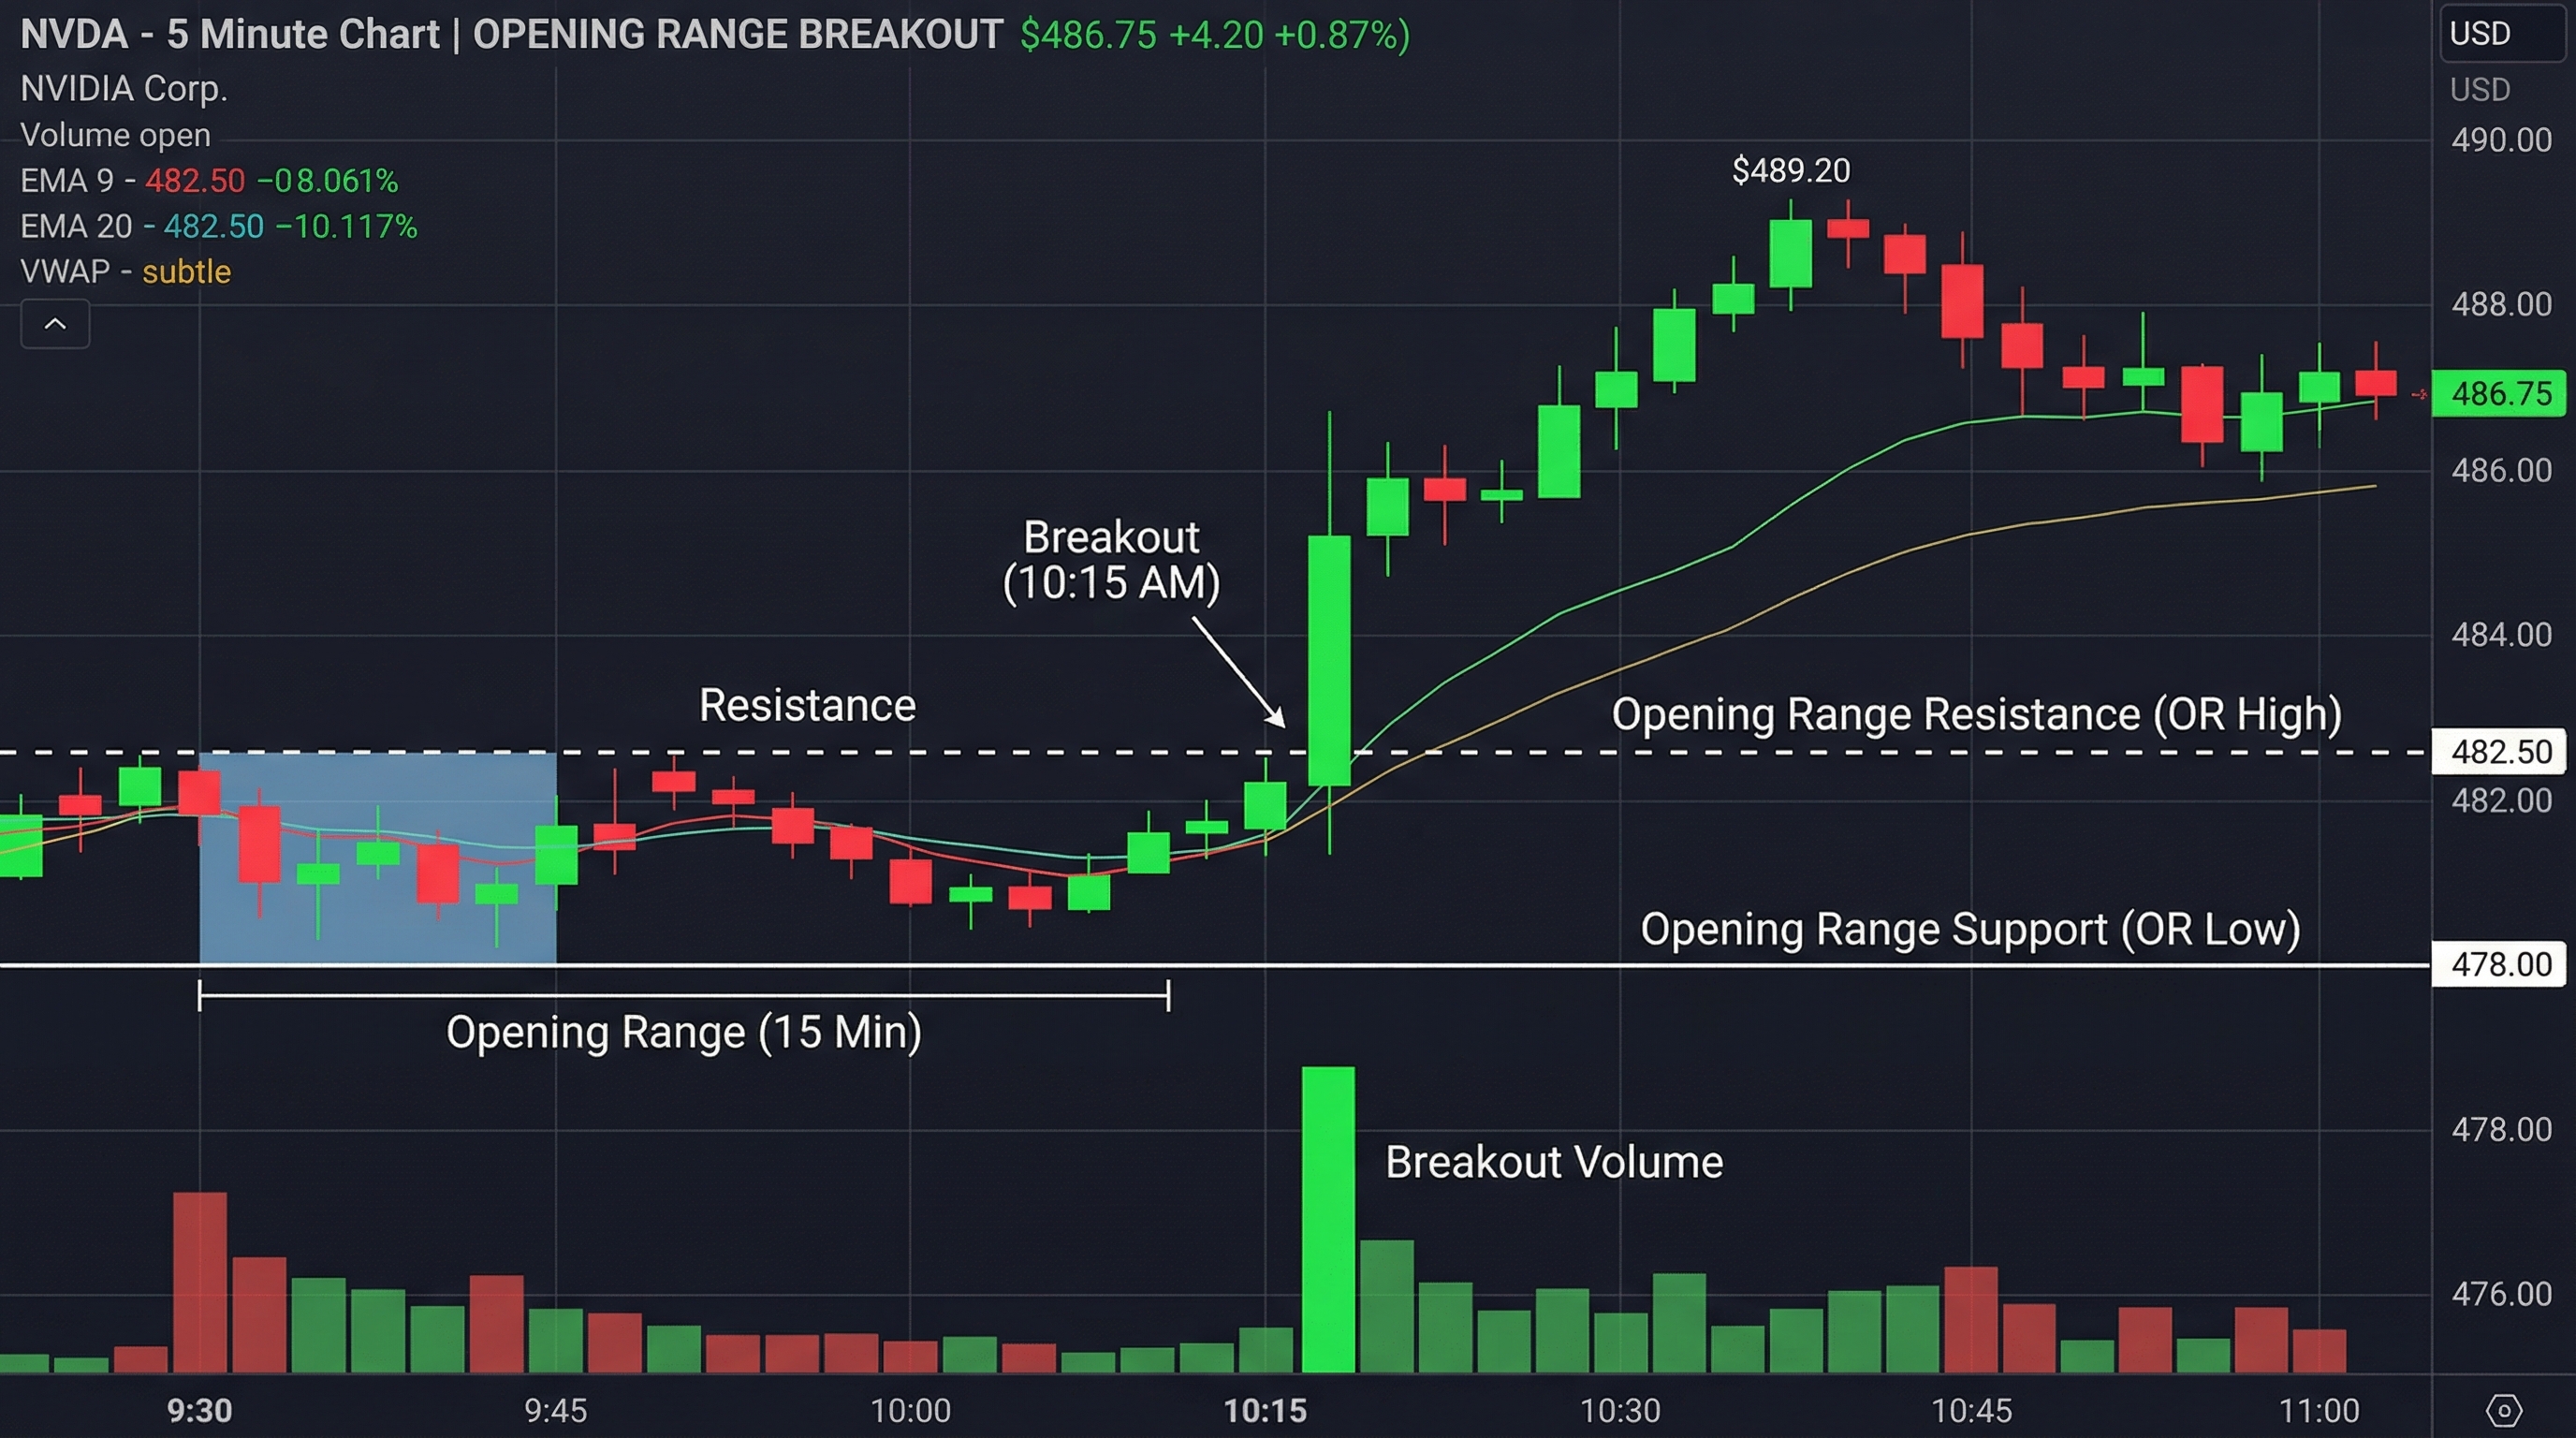
This NVDA chart shows the same pattern from a different angle. The opening range — marked by the green horizontal lines — formed in the first 30 minutes of trading between $188.40 and $192.10. Price consolidated within that range for nearly 45 minutes before breaking above the high at 10:15 AM on a volume spike of 1.2 million shares. The move carried from the $192 breakout level to $198.70 — a clean 3.5% run in under 30 minutes.
Notice how the pre-market high at $193.50 acted as an intermediate resistance level on the way up. Traders who spotted the breakout above the opening range high and used the pre-market high as their first target had a clear risk-reward setup: stop below the range low at $188.40, first target at $193.50, extended target at the dotted resistance near $198.
Pre Market Range Identification
Before the bell, active stocks carve out a pre market range. That range — the high and low from roughly 7:00 AM to 9:29 AM — acts as a guide for the first 30 minutes of live trading. If a stock pushes above its pre market high on strong opening volume, that's a bullish sign. A drop below the pre market low on volume points to more downside.
Traders who chart this range and set alerts at those levels start the day with a clear map. Those who show up at 9:30 cold are guessing.
Fade the Overnight Gap
Not every gap follows through. Stocks that gap on weak news or just tag along with a hot sector often snap back in the first hour of normal trading. Fade traders watch for gaps with low volume, no real catalyst, and price that has pushed into known resistance. The entry comes when the stock starts to close the gap back toward the prior day's close.
How to Start Trading Pre Market
Pick a broker with pre market access. Interactive Brokers and Webull open at 4:00 AM ET. Fidelity and Schwab start at 7:00 AM. Compare the time windows, fees, and order types each one allows.
Build your watchlist the night before. Scan for stocks with earnings due before the bell, economic data on the calendar for 8:30 AM, and any news that broke after the close. Showing up at 7:00 AM with a plan beats reacting on the fly.
Use limit orders only. Most brokers force this, but even where market orders work, the spread risk makes limits the only smart choice.
Size down. Less liquidity means more slippage and wider stops. Many skilled traders cut their normal size by 25-50% during pre market.
Paper trade first. Pre market moves at a different pace — fast around catalysts, dead in between. Getting a feel for that rhythm without real money on the line is time well spent.
Pre Market Trading vs. After-Hours Trading
Both sessions fall under “extended hours,” but they serve different purposes and attract different behavior.
Pre market is forward-looking. Traders react to night news, get set ahead of the open, and carve out the price ranges that shape early regular-hours trading. Most volume lands in the last 90 minutes before the bell.
After-hours is reactive. It runs from 4:00 PM to 8:00 PM ET and is ruled by post-close earnings and late news. Volume spikes in the first 30 minutes after close, then dies off fast.
For day traders, pre market matters more — it's where the opening range takes shape. For swing traders holding through earnings, after-hours is where the first move plays out.
Is Pre Market Trading Right for You?
Pre market trading isn't for everyone. It takes more prep than normal-hours trading, tighter risk controls because of thin liquidity, and a real comfort with wider spreads cutting into your margins.
It fits best if you're already making money during regular hours and want to add a morning prep edge, you trade around catalysts like earnings, economic data, or news gaps, or you want to read where the market will likely open before you put money to work at 9:30.
If you're still building your edge during the regular session, stay there. Pre market adds moving parts. Bring it into your toolkit once your core approach is steady.
Pre market trading data and statistics sourced from NYSE Research (2025), FINRA Extended-Hours Trading Advisory, J.P. Morgan Retail Trading Reports, and SEC regulatory filings.
Tags:
About the Author
Kunal Vakil
Co-Founder, TradingSim
Kunal Vakil is the Co-Founder of TradingSim with over 20 years of trading and investing experience. He completed an Executive Development Program at MIT and serves as VP of Capital Markets Products at Fannie Mae. His trading strategies focus on the relationship between price and volume, using Fibonacci and anchored VWAP indicators.
What are Renko Charts You can trace renko chart’s origins to Japan and they were first introduced to the West by Steve Nison in his book “Beyond Candlesticks”. The actual word renko is derived from...
6 Reasons Not to Trade During the First 30 Minutes
The first 30 minutes is the most volatile time in the equities market. As a new or even seasoned trader, you will gravitate to the first 30-minute slot like a moth to a flame. It really comes down to...
In this article, I will cover two basic trading strategies you can utilize during the market open. But first, let’s discuss what drives the madness shortly after the opening bell. Like many other...


 Intro to Stock Charts


