VCP Pattern: Volatility Contraction Trading Guide [Updated April 2026]
Apr 17, 2026
Written by: John McDowell
✓ Reviewed by Al Hill, Co-Founder of TradingSim · Updated Apr 17, 2026
The Volatility Contraction Pattern, or VCP, as it has come to be known, has been popularized by Mark Minervini in his books Think and Trade Like a Champion and Trade Like a Stock Market Wizard. Despite the pattern’s success for swing trading, in this post, we’ll dive into how to recognize it for day trading opportunities.
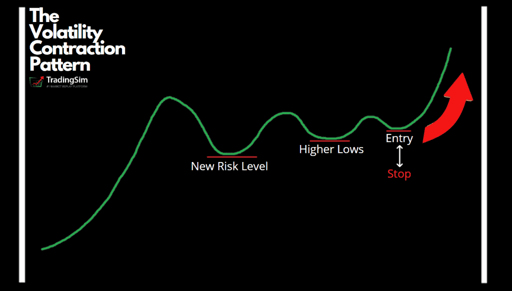
The VCP, which dates back to Richard D. Wyckoff’s “wave pattern,” carries a high rate of success when executed properly. It essentially looks like a bull flag.
Many successful traders may refer to the pattern as simply a “high tight flag.” However, that pattern implies certain criteria that may not fit the VCP.
Regardless, the setup has obvious influence from the teachings of Bill O’Neil and his famous book How to Make Money in Stocks.
What Minervini discovered in his analysis of some of the market’s biggest winners was their tendency to pause during new uptrends. This pause created a coiling action after the initial upward force. It also offered a low-risk opportunity to jump on board for the next leg up.
“I stuck with the same style and strategy for so many years that I got really good at doing that one thing. I was doing the same exact thing I’m doing now — looking for stocks that are in strong uptrends that are coming out of consolidations.”1
Mark Minervini
Regardless of the amalgamation of educators putting their own influence on the pattern, it has a handful of shared criteria for qualification. We’ll look at each one of these more in-depth in a moment.
Why the Volatility Contraction Pattern?
When analyzing different patterns or setups in the market, it is imperative to manage risk. It is equally important to have an edge.
Successful traders understand that the market is a game of probabilities. Losses are inevitable. But an edge that provides a higher reward/risk ratio can bring about obscene profits over time.
You have no control over how much a stock goes up, but you can, however, control the amount you lose on each trade.
Mark Minervini
This is where the VCP shines. It offers traders the ability to take a position in a stock with growing momentum, yet with low risk.
Just ask Mark who touts making over 33,554% in just 5 years using only the VCP.
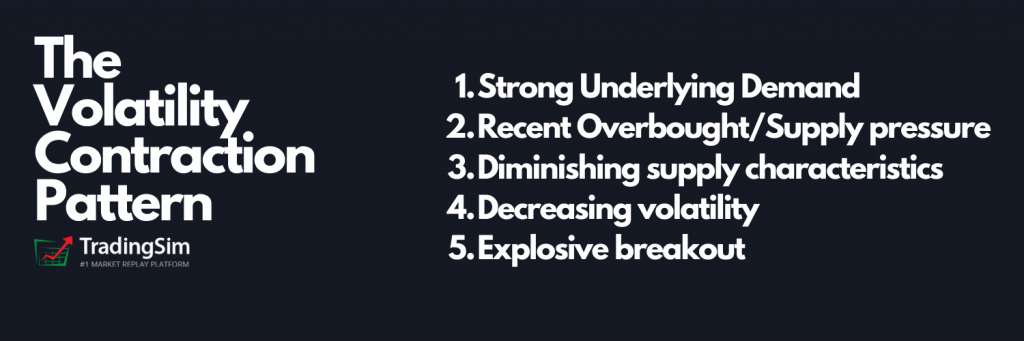
To that end, let’s look at each of the 5 criteria that create this explosive pattern.
For a stock to create the proper setup for the VCP, there needs to be demand. Plain and simple. And a lot of it.
To that point, there is no easier way to spot that demand than a strong uptrend. This may seem counterintuitive to human nature, but the best VCP patterns come from big prior moves.
It is at this point that many investors or traders feel as though a stock is overbought. However, astute momentum traders recognize the demand and take advantage of it. This is a classic example of buying high and selling higher.
The following are a handful of flexible criteria to look for in the foundation of an intraday VCP. Think of these as the backdrop to the formation.
A premarket gap or explosive move off the open
Elevated Relative Volume compared to prior days’ average
The potential for a breakout on higher time frames
Underlying significant support (like a daily pivot or moving average)
Inability to breakdown
Volatility Contraction Pattern Example – WISH
Taking these 5 points, let’s use a recent intraday VCP example in a strong-trending ticker, WISH.
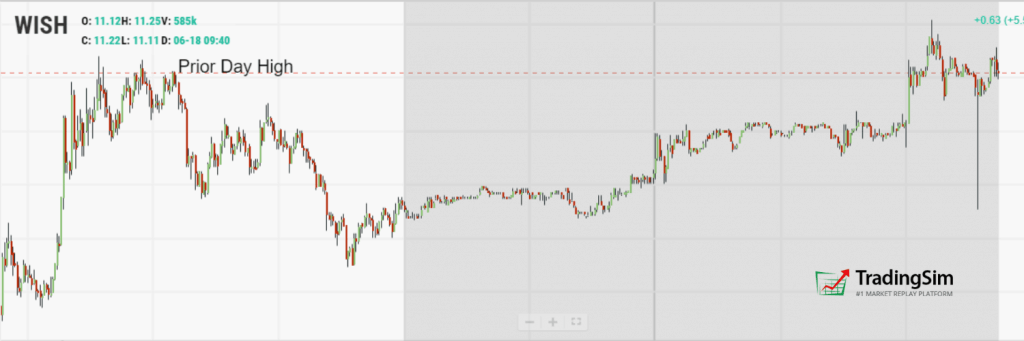
Starting with the daily chart, we can begin building our case for the “daily pivot” and “moving average” support markers. In the image below, we see that we had an extremely bullish day a few weeks prior.
WISH daily support levels
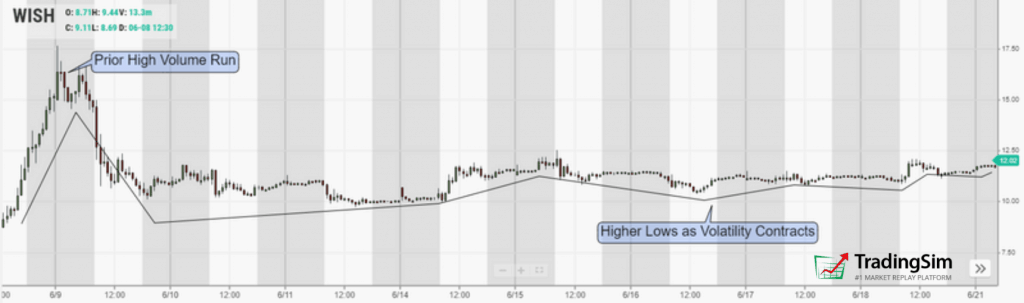
We can also see that the ticker is now “surfing” the 10-day simple moving average. Each time it retreats to those levels, volume recedes. This implies that supply is diminishing on the daily chart.
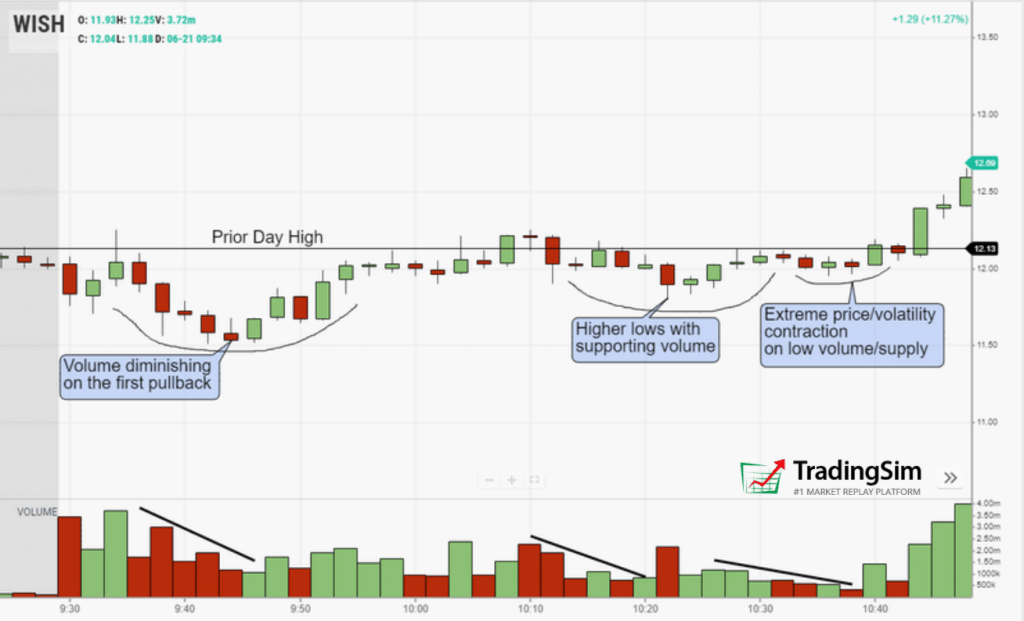
From this daily back drop, let’s move a bit closer using the 30-minute time frame.
On the 30-minute chart, we see confirmation of the price action holding higher lows. The volatility begins to contract into the current day, suggesting an inability for price to break down.
WISH 30-minute chart
Now that we have the higher time frames analyzed, let’s look for the intraday action.
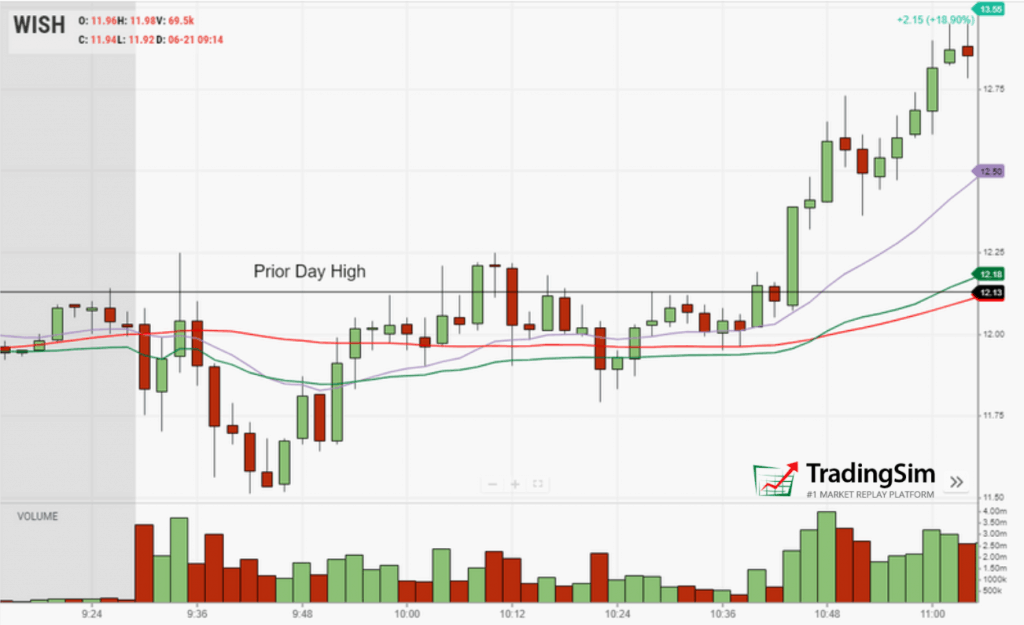
Pre-market Gap
In the following chart, we can see the prior day high, close, and the after-hours and pre-market action from the current morning for WISH.
WISH premarket gap
Though the volume is not shown, RVOL was above 100% for that morning with over 5 million shares traded in the premarket. Just before the open at 9:30 am EST, the ticker is already testing its prior day’s high. This is annotated on the chart.
With this in mind, we’d be wise to keep WISH on the watchlist for any kind of setup that might indicate an imminent breakout.
2. Recent Overbought/Supply Pressure
Given the 6% gap in the premarket for WISH, and the fact that it is retesting the prior day highs, it wouldn’t be surprising for some amount of profit-taking or selling pressure off the open. This is a common area to take profits in case the breakout fails.
What this creates is an underlying compression, of sorts. It is like two opposing forces trying to overcome each other. Demand, on the one hand, supply on the other.
Our job as traders is to identify who has the upper hand in the battle. The Volatility Contraction Pattern helps with this.
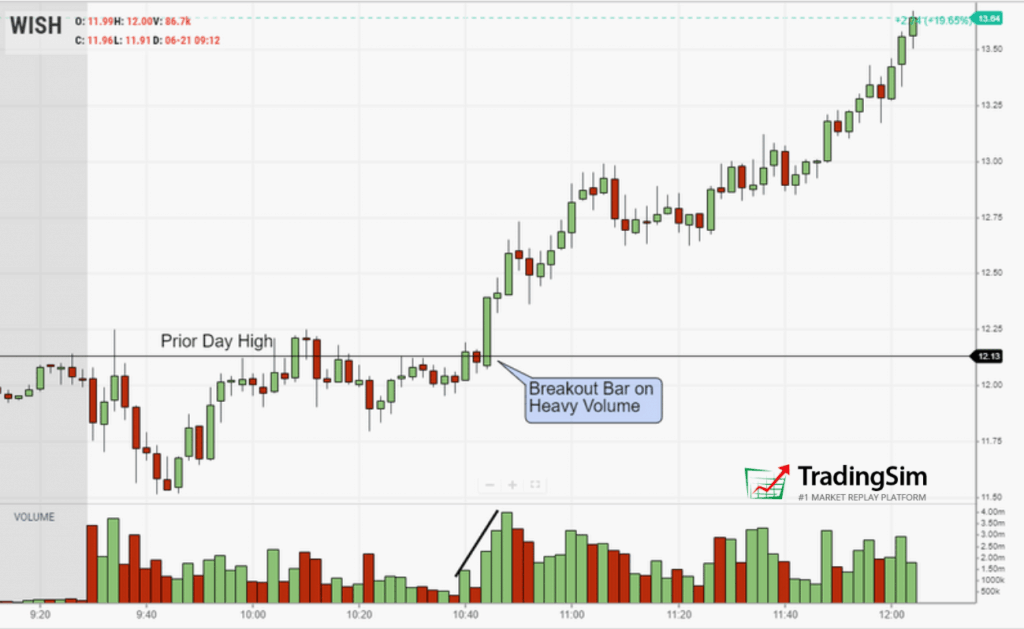
To see how this plays out as a day trade, let’s take a snapshot of WISH shortly after the open.
WISH intraday VCP
We’ve drawn a line at the prior day’s high for a better understanding of how important this level is. We noticed from the premarket chart that resistance was showing up at this pivot. So, it makes sense to include these key levels.
As the morning wears on, it becomes clear that the stock is not breaking down. In fact, the supply injected at the resistance line is being absorbed on dips.
3. Diminishing Supply / Decreasing Volatility
After we see the “overbought” correction, we need to watch closely to how the stock reacts. Does it find support again? If so, where, and how convincingly?
These are questions that need to be answered with volume and price action.
Per the notes on the chart, we begin to see “the wave” tightening with higher lows. Each pullback contains less and less volume/supply.
Finally, we coil into an area of tight price action on extreme volume dry up2.
Volume Dry Up (VDU), is a popular way of finding a lack of supply in a healthy consolidation. This price action strategy often precedes a “pocket pivot,” or break out. These strategies were popularized by Gil Morales and Chris Kacher in their book Trade Like an O’Neil Disciple.
Ideally, at this point in the consolidation, you want to see the stock holding a support level like VWAP or a popular moving average like the 10, 20, or 50ma.
WISH with 20ema, 50sma, and VWAP
As the stock consolidates into the Volatility Contraction Pattern, we begin to see the influential support indicators like the 20ema, 50sma, and VWAP have moved below the price action. This is yet another red flag for short-biased traders to run for cover. No pun intended.
4. The Breakout
As the force of demand begins to overpower the bears, it becomes clear that bulls are going to win. And as we mentioned above, this can be explosive depending on the pressure being exerted by the bears.
The initial sign is the high volume bullish price bar immediately following the VDU candle. After finding support along the 20ema, the price pivots higher on convincing volume.
Volume returns with a vengeance after the tight coiling action. Breakout buyers are jumping on the opportunity. At the same time, shorts have a decision to make. Either cover before the loss gets worse, or average up, hoping for a failed breakout.
WISH VCP breakout
As the breakout continues higher, shorts are now underwater, especially if they were averaged in from the prior day's high. They have only one choice to make.
As the short covering comes in, this fuels the bullish character of the stock. In fact, in less than two hours, the stock ran over 13%.
Swing traders would love to have those kinds of gains in a month!
VCP Variations and More Resources
While there are plenty of swing trading resources on the net for VCPs, there are fewer links to daytraders employing this strategy. The exception is Nate Michaud of InvestorsUnderground.com.
Nate teaches a variation of this strategy called the ABCD pattern in many of his free educational videos. If you have time, you might check out his YouTube channel for more information on how to spot these intraday opportunities.
A volatility contraction pattern is a chart formation where a stock's price range progressively tightens over several weeks as average true range compresses well below its recent average. This pattern signals that supply and demand are reaching equilibrium, with sellers exhausting their inventory while buyers accumulate shares quietly. I have found VCP setups to be among the most reliable breakout patterns in trading because the compression phase acts like a coiled spring. When the breakout finally occurs on expanding volume, the stored energy from weeks of contraction translates into powerful directional moves. Mark Minervini popularized this pattern and demonstrated through decades of documented results that VCP breakouts in strong market conditions consistently outperform other base patterns. The key identifying features are a series of progressively smaller price contractions, declining volume during the consolidation, and a clear pivot point where the breakout triggers.
Trading a VCP breakout requires waiting for three specific conditions before pulling the trigger. First, you need the consolidation phase where volume dries up and the price range narrows significantly, typically compressing to about one-third of the average true range over 50 days. Second, you wait for a breakout above the contraction zone on volume that exceeds the average by at least 40 to 50 percent. Third, the breakout should close above the 20-day moving average to confirm momentum has shifted from accumulation to active buying. My stop-loss goes just below the lowest point of the final contraction, keeping risk tightly defined. What separates profitable VCP traders from the rest is patience. I watch 20 or more setups that fail to trigger before finding the one that delivers. I never chase every breakout because the best VCP trades come to you when you wait for all three conditions to align.
Volatility contraction patterns work because they reflect genuine market psychology playing out on the chart. When a stock enters a VCP formation, institutional investors are typically accumulating shares during the quiet periods while retail traders lose interest due to the lack of price movement. Volume drops and the stock moves in an increasingly tight range. Then a catalyst arrives, whether it is earnings, sector rotation, or simply the exhaustion of remaining sellers, and volatility expands sharply. The breakout catches most traders off guard because they stopped watching during the boring consolidation phase. Over my years of trading, I have noticed the best performing VCP setups enter the contraction after pulling back 20 to 30 percent from their highs. That is where institutions step in. The risk during a VCP setup is lower than most patterns because you are entering when volatility is at its lowest, meaning your stop-loss is tight and your potential reward is substantial.
Mark Minervini's VCP Strategy: Key Rules
I teach Mark Minervini's original VCP framework because it is built on actual market data and decades of documented performance, not theory. Minervini developed this pattern after studying thousands of chart breakouts and his rules are specific for good reason.
The first rule is the volatility drop. Price must compress into a narrow range where the average true range falls to roughly one-third of its 50-day average. Without significant contraction, you do not have a true VCP. The second rule is breakout confirmation. Volume must expand substantially above the consolidation zone. Minervini taught that price moves without volume are traps. Look for at least 40 to 50 percent above average volume on the breakout day.
The third rule is the 20-day moving average filter. The stock should break above its 20-day moving average as it exits the VCP, confirming the shift from accumulation to active momentum. The fourth rule is position sizing. Never risk more than 1 percent of your account on a single VCP trade because even high-probability setups fail and you need to survive the losses to stay in the game.
The beauty of following Minervini's exact framework is repeatability. These rules have held up across multiple market cycles and that consistency is why I teach them to every serious trader.
The VCP shares characteristics with other consolidation patterns. The bull flag pattern offers a similar high-probability continuation setup during established uptrends, making both patterns valuable in your toolkit. The best way to master VCP trading is consistent practice on historical market data, which is exactly why I recommend using a day trading simulator to backtest these patterns without risking capital.
How to Practice the VCP
Once you’ve seen the VCP, it is imperative to practice the pattern in a simulator before putting real money to work. You’ll want to identify when the pattern works, and when it might throw false signals. After all, flag patterns can resolve either way.
We suggest a few criteria to analyze each trade, similar to what we have mentioned above.
Is the stock holding key moving averages and VWAP?
Are bulls showing signs of strength compared to the bears?
The volatility contraction pattern (VCP) is a chart pattern developed by Mark Minervini where a stock's price range contracts through a series of progressively tighter consolidations. Each contraction shows decreasing volume and price range, signaling that selling pressure is drying up before a potential breakout.
How do you identify a VCP pattern?
To identify a VCP pattern, look for a stock in an uptrend that begins consolidating with at least 2–4 contractions. Each contraction should have a smaller price range and lower volume than the previous one. The pivot point is the highest price within the final contraction, and a breakout above this level on increased volume confirms the pattern.
What is the difference between VCP and a cup and handle?
While both are bullish consolidation patterns, the VCP specifically requires progressively tighter contractions with decreasing volatility, whereas a cup and handle has a rounded bottom (cup) followed by a single downward drift (handle). The VCP can have multiple contractions while a cup and handle typically has one handle formation.
Who created the VCP pattern?
The VCP pattern was popularized by Mark Minervini, a U.S. investing champion and author of Trade Like a Stock Market Wizard. Minervini uses the VCP as one of his primary setups for identifying growth stocks that are about to make significant upward moves.
Can you practice VCP trading on TradingSim?
Yes, TradingSim's stock trading simulator allows you to practice identifying and trading VCP patterns using real historical data. You can scan for VCP setups across thousands of stocks and practice your entry timing and position sizing without risking real money.
Volatility Contraction Pattern — Learn the volatility contraction pattern (VCP) by Mark Minervini. Complete guide to identifying and trading VCP setups with real chart examples in 2026.
Source: TradingSim | Author: Al Hill, Co-Founder of TradingSim | Updated: April 2026
John McDowell is the Lead Content Strategist at TradingSim. His journey into day trading began in 2016 after conversations with a retired hedge fund manager. John is passionate about teaching and educating traders, curating content that helps others succeed in the stock market.
VDU and Pocket Pivots: “VooDoo” for your day trading
Volume Dry Up (VDU) and Pocket Pivots are some of the most powerful precursors to big moves in the stock market when interpreted correctly. Often called VooDoo, for the acronym VDU, by discoverers...
Day Trading Demystified: A Comprehensive Guide to Using Demo Accounts [Updated April 2026]
Beginner’s Guide to Day Trading in Demo Accounts So you want to be a day trader, huh? Alright. Well, your work is cut out for you. Chances are you've seen SMCI on the news lately, going from around...
Volume Profile Trading Strategies for Day Traders [Updated April 2026]
What Is Volume Profile? A Volume Profile is a volume-by-price trading indicator that shows the total trading activity or volume traded at each price level over a specified period. This contrasts the...


 breakout " class="wp-image-321933" srcset="https://f.hubspotusercontent10.net/hubfs/20705417/Imported_Blog_Media/VCP5criteria-1024x341-4.png 1024w, https://f.hubspotusercontent10.net/hubfs/20705417/Imported_Blog_Media/VCP5criteria-300x100-1.png 300w, https://f.hubspotusercontent10.net/hubfs/20705417/Imported_Blog_Media/VCP5criteria-768x256-1.png 768w, https://f.hubspotusercontent10.net/hubfs/20705417/Imported_Blog_Media/VCP5criteria-600x200-1.png 600w, https://f.hubspotusercontent10.net/hubfs/20705417/Imported_Blog_Media/VCP5criteria-1.png 1500w" sizes="(max-width: 1024px) 100vw, 1024px">
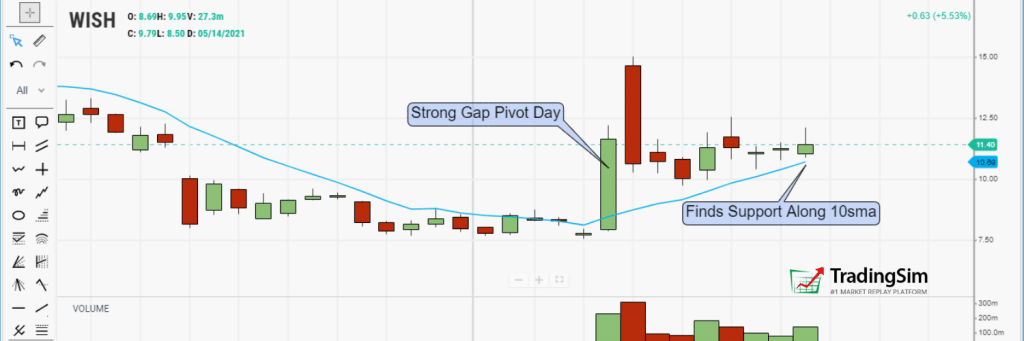


 Awesome Day Trading Strategies


