Most day traders have a love or hate relationship with tick charts. Meaning, either you cannot trade without the tick data, or you absolutely despise the use of tick data as it can complicate making trading decisions. You would think there are some gray areas, but not really.
You see, tick charts display a certain number of trades before printing a new bar chart. In a way, you can find the price and volume of every print from the historical tick data of a stock or trading instrument. Hence, unlike other charts which are based on time, tick charts are solely based on trading activity.
Day traders who favor tick trading find it easier to just look at the tick by tick data in order to make quick trading decisions. If you do not have the time to wait for a 5-minute bar to close and need to make your decision to buy or sell, the stock tick data can be a great help. This is because, you would find a wealth of information about the details of the trading activity from the stock tick data or futures tick data.
However, if your trading strategy is purely based on technical indicators, you would find that tick data can create complications. In this discussion, we will explain to you how tick data can be a real nightmare for day traders, and why.
#1 – There are Too Many Time Frame Options
Look, if you are watching a 5-minute chart, you can be pretty sure that by the end of every five minutes, a new bar or candlestick will form on your day trading chart. But, guess what, you really cannot predict how many ticks there would be during that same 5-minute time frame.
Before April 2001, there was a standard measurement of a “tick.” Whenever the price of a stock moved 1/16th of a dollar, you could call it a tick. Therefore, if you were watching tick charts, price moved $0.0625 at a time.
But, as major stock exchanges around the world moved to decimal pricing, that definition of a tick became obsolete. Now, a 5-minute chart can contain as many ticks as possible. This is because tick charts are formed based on the number of ticks, not time.
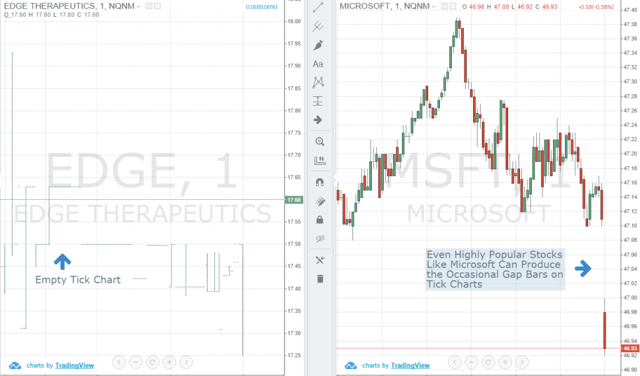
Comparing EDGE vs. MSFT Tick 1-Minute Chart
If you are fond of trading highly popular stocks likes Apple (AAPL) or Google (GOOG), you may find 10,000 ticks in a 5-minute chart during earnings calls. On the contrary, unpopular penny stocks may not have a single transaction during lunch hours, and you may have to wait a long time for a single tick bar to appear!
Also, there is no standard time frame to watch the tick data. A lot of brokers show tick data on the 1-minute chart. But, as you do not know which stock would have how many ticks during a single time frame, it is really not possible to compare the tick charts like bars with fixed time frames.
You may say that tick charts based on the number of ticks is a good way to go about it. In fact, you would find that a lot of day traders often watch tick charts based on Fibonacci numbers. But, how would you decide on which tick charts to watch?
Sure, the most popular one is 233 ticks, but that’s just another example of a self-filling prophecy, isn’t it? There are simply too many possibilities as you can use any number of tick count to formulate your tick chart.
#2 – The Action Can be Too Fast (or Too Slow!)
As we just discussed that there are hardly any standardized time frame to watch the tick charts and the ticks can come 10,000 per second or absolutely zero – there are no hard and fast rules in the tick universe.
So, during important news releases or market opening, the tick charts can move really, really fast. There are enthusiastic people in this world who have invested millions in high frequency trading and mainframe computers to interpret the tick data.
But, as a human being, you would often find the speed of the tick charts to be overwhelmingly fast to make any sense of it.
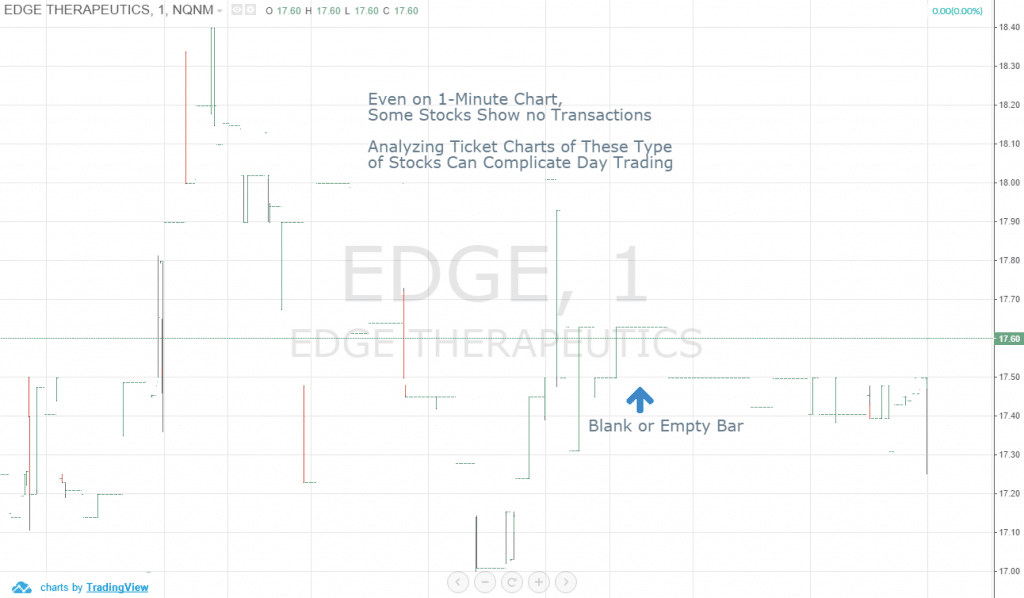
Most Unpopular Stocks Have a Very Low Number of Transactions on Traditional Time Frames
On the other hand, if you are trading unpopular stocks, you may have to wait a long time to find a complete bar on the tick charts that contains the number of ticks you have selected, which would not help you to make any trading decisions during slow moving market times.
#3 – What Good is Downloading Tick Data if You Cannot Use It?
Many beginner traders think that keeping an eye on the tick charts can give them an edge in day trading. Guess what? If you cannot interpret the real-time data, because at times, it is too fast, what good would it do for improving your trading results?
We are not saying that tick data is worthless, just that for day traders who make trading decisions based on technical analysis, it can often do more harm than good.
Instead of religiously watching tick charts, simply watching the volume indicator can give you the real-time information you need. Moreover, since volume can go up or down relative to the time frame you are watching, you can actually use it to make an informed trading decision.
#4 – Tick Data is Expensive – Don’t Kid Yourself
If your broker offers free tick data, you are in luck. But, before you schedule an hour to watch it tonight, let us be the bearer of bad news. Nothing in this world is free and the free lunches you get in life often cost you more some other way.
The free tick data provided by many brokers often contains errors, if not missing parts that can prove costly if you use it to formulate your trading strategy. On the other hand, quality tick data can be really expensive.
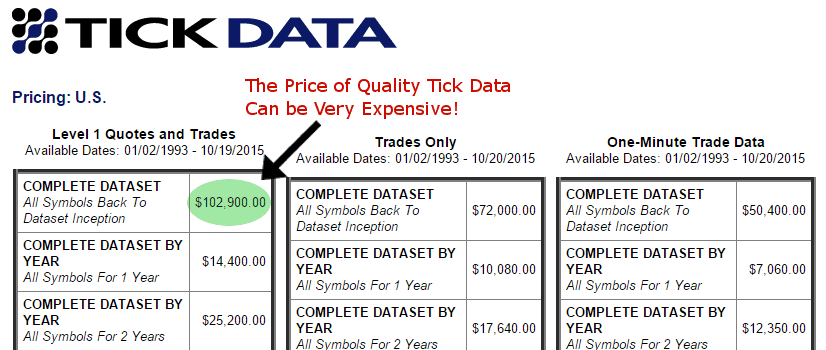
Tick Data Costs
If you do a quick Google search, you would find that it costs around $3,000 to buy historical tick data for the NASDAQ 100 package that contains only 169 symbols. The complete package containing S&P 500, ETF, and DJA, etc. can even put a $100,000 hole in your wallet. Trust us, you would be much better off buying that Tesla Model S you always wanted with that money.
#5 – Technical Indicators Do Not Respond the Same Way
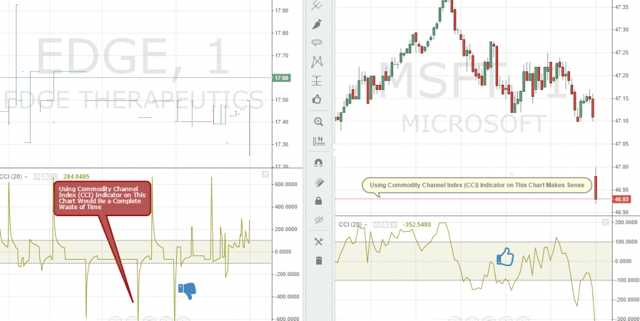
Technical Indicators Stop Working
Do you know that almost all popular technical analysis indicators are based on the concept of Open, High, Low, and Close or OHLC bars? You would also find it interesting that unless you are looking at a fixed time frame, the OHLC data would not make any sense at all.
For example, the opening price of a 1 minute chart and 5 minute chart would be different, right? What if there were not open or closing price of the bar for the last 2 bars? How do you think your moving average indicator would behave in a situation like that? If you are using tick charts, that’s a real issue.
Regardless of how advanced technology is used to measure tick data, the most popular indicators for day trading would never work the same way on tick charts as these work on a bar or candlestick based chart that shows the OHLC price data on standard time frames like 5-minute or 15-minute charts.
You may want to argue that tick trading has some application in “naked” technical analysis. However, if you do not have a standard time frame to figure out if the price “closed” above the resistance, how would really know if the resistance was broken? Moreover, it will not make much sense if other traders were not seeing that same breakout, as the whole concept of momentum trading depends on being in sync with the market.
Conclusion
High frequency trading that utilizes super-fast computers to analyze real-time data has some practical application for using tick data. However, as a day trader working from your basement on a Core i5 workstation with a fiber optic connection, watching tick charts will hardly help to improve your trading. Instead, it will complicate things to a certain extent.
Moreover, the combined cost of buying quality tick data from reputed sources, the additional investment it requires to buy adequate computer hardware that can handle tick data, and the time commitment you would require to put everything together may not offer the return you would initially expect.
If you mostly trade based on popular technical indicators along with some basic chart patterns, you are much better off back testing solutions that offer a comprehensive package for replaying various standard time frames instead of analyzing expensive tick data in real-time.


 Intro to Stock Charts


