Philadelphia semiconductor index is a unique index that tracks the semiconductor sector. The semiconductor industry comprises of manufacturers of all microchip products and also includes research and development.
The Philadelphia semiconductor index is PHLX semiconductor index for short with the ticker SOX.
With the global economy moving ever closer to digitalization, computers have become the core of the business. Because of this economic significance, the semiconductor industry is one of the central aspects of economic growth.
The Philadelphia semiconductor index tracks the industry and gives an overview of the industry in general. When the index is high, it signifies that the fundamentals are strong and also denotes a state of sustained growth. Conversely, when the Philadelphia semiconductor index is in decline, it signals a period of flat or even declining economic growth.
The Philadelphia semiconductor index is unique, and parallels can be drawn to the Dow Jones Index. Made famous by Charles Dow, the Dow Jones industrials average and the transportation index often signal economic cycles. In a digital world, watching the Philadelphia semiconductor index is somewhat similar as well.
In this 2016 report, the U.S. semiconductor industry is one of the world’s leading industry with a global footprint. U.S. companies in this sector account for 47% of the global market share. Interestingly, over 80% of the sales of semiconductors takes place outside the United States.
Some of the top markets for the semiconductor businesses are China, the European Union, and Japan to name a few.
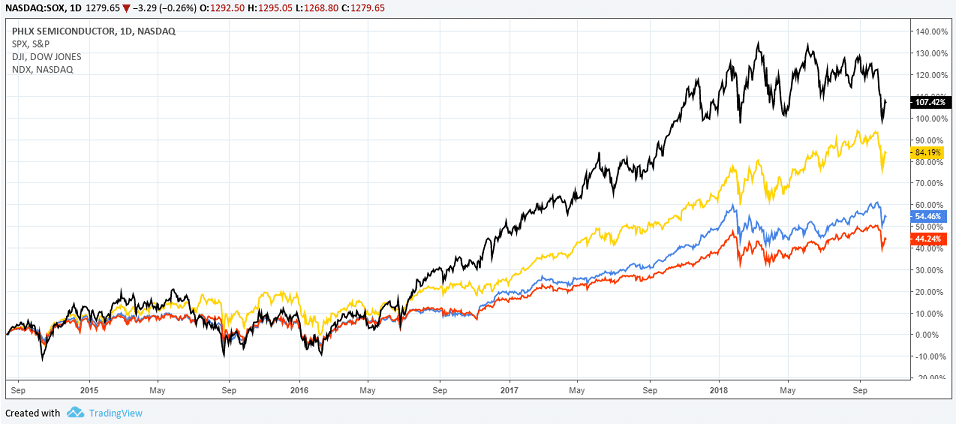
The PHLX SOX Index with DJIA, NASDAQ, and S&P500
As demand for new technologies grows, so does the demand increase for the semiconductor business. Smartphones, tablet PC’s, digital televisions and so on form the core products in this industry.
More recently, the rise of cryptocurrencies began to add more demand to this sector. The need for faster processors and computing powers for cryptocurrency mining has at one point led to a surge in some of the key companies.
What is the Philadelphia semiconductor index?
The Philadelphia semiconductor index or SOX is an index with capitalization weight. The index is made up of 30 semiconductor companies. The index was created in 1993 and is currently being managed by the Nasdaq OMX Global exchange.
It is essential that the companies that form the Philadelphia semiconductor index must be involved in the industry. This means that the primary business of the companies must involve one of the following: Design, distribution, manufacturing, and sales of semiconductors.
While the NASDAQ OMX gives details of the index, the real-time data is given from the Philadelphia stock exchange. The Philly stock exchange was acquired by the NASDAQ OMX in 2008. There are also other indexes such as the housing sector index, oil service, and utility sector.
The companies in the index must be already trading on the NASDAQ or the New York Stock Exchange or the NYSE market. The shares can be common stocks, ordinary shares or ADR’s.
There is a minimum market capitalization requirement of at least $100 million for the company to be a part of the SOX Index. Other criteria include the volume of trade and the option listings as well.
At the time of writing, there are 30 components in the Philadelphia semiconductor index. Constant changes are made to keep the list up to date. Details of the weighting of the index can be seen here in this article.
The Philadelphia semiconductor index is closely watched by investors. There are also options on the index as well as exchange-traded funds which track the performance of this index. Investors can use the Philadelphia semiconductor index in some ways.
For example, one can use the index to track the performance of the sector or to identify potential turning points in the market.
Components of the Philadelphia semiconductor index
The following companies make up the Philadelphia semiconductor index at the time of writing.
| Symbol |
Company Name |
| MSCC |
Microsemi Corporation |
| IDTI |
Integrated Device Technology, Inc. |
| SIMO |
Silicon Motion Technology Corporation |
| MCHP |
Microchip Technology Incorporated |
| SWKS |
Skyworks Solutions, Inc. |
| LRCX |
Lam Research Corporation |
| MU |
Micron Technology, Inc. |
| ADI |
Analog Devices, Inc. |
| IDCC |
InterDigital, Inc. |
| ON |
ON Semiconductor Corporation |
| AVGO |
Broadcom Inc. |
| TXN |
Texas Instruments Incorporated |
| MKSI |
MKS Instruments, Inc. |
| QCOM |
QUALCOMM Incorporated |
| INTC |
Intel Corporation |
| TSM |
Taiwan Semiconductor Manufacturing Company Limited |
| MXIM |
Maxim Integrated Products, Inc. |
| CY |
Cypress Semiconductor Corporation |
| MPWR |
Monolithic Power Systems, Inc. |
| QRVO |
Qorvo, Inc. |
| AMAT |
Applied Materials, Inc. |
| TER |
Teradyne, Inc. |
| CAVM |
Cavium, Inc. |
| MRVL |
Marvell Technology Group Ltd. |
| XLNX |
Xilinx, Inc. |
| NVDA |
NVIDIA Corporation |
| CRUS |
Cirrus Logic, Inc. |
| ASML |
ASML Holding N.V. |
| CREE |
Cree, Inc. |
| AMD |
Advanced Micro Devices, Inc. |
As you can see in the above table, some of the more popular stocks in the index are Advanced Micro devices (AMD), Intel Corp (INTC) Texas Instruments (TXN) and Analog Devices (ADI).
The stocks must have an average trading volume of 1.5 million in each of the last six months.
Most of the companies in the Philadelphia semiconductor index trade one of the major exchanges. Investors can either choose to trade the individual stocks or the index’s stock options or ETFs.
The index began trading with a base value of 200 in 1993. Later, the index was split two for one in 1995. The options on the index began to actively trade from 1995 onward. The SOX index undergoes a rebalancing once every quarter.
Further details on the methodology can be seen here.
The chart below gives a brief allocation for some of the constituents in the index.
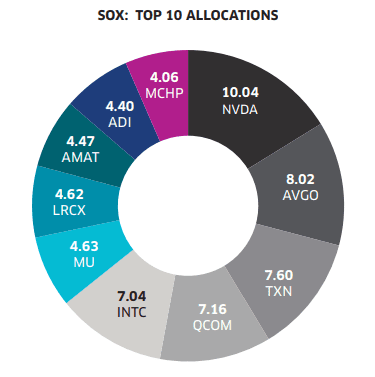
Top 10 Allocations – Philadelphia Semiconductor Index
How to use the Philadelphia semiconductor index?
The Philadelphia semiconductor index is known to have a good correlation with the leading equity benchmarks globally.
A decline in the index often foretells a market correction. This is because regardless of the product or service, silicon chips are the most common these days. It spans across various industries.
Therefore, the SOX index can be a good proxy for economic growth. It can signal where the equity markets head to. The Philadelphia semiconductor index is also economically sensitive than other industries. The index follows a cyclical pattern. When chip stocks work well, it usually signifies a healthy economic growth.
This research paper gives an overview and explores the cyclical pattern. More importantly, it addresses the question as to why the SOX index is an indicator of market turns.
There are many ways investors can use the SOX index. For the average investor investing in the main equities, the SOX can be useful when analyzing the S&P500 charts. This is also true for those who are trading the E-Mini S&P500 futures market as well.
Due to the cyclical nature of the industry, the SOX index goes through sustained periods of bull and bear markets. The chart below shows the Philadelphia semiconductor index with the historical values.
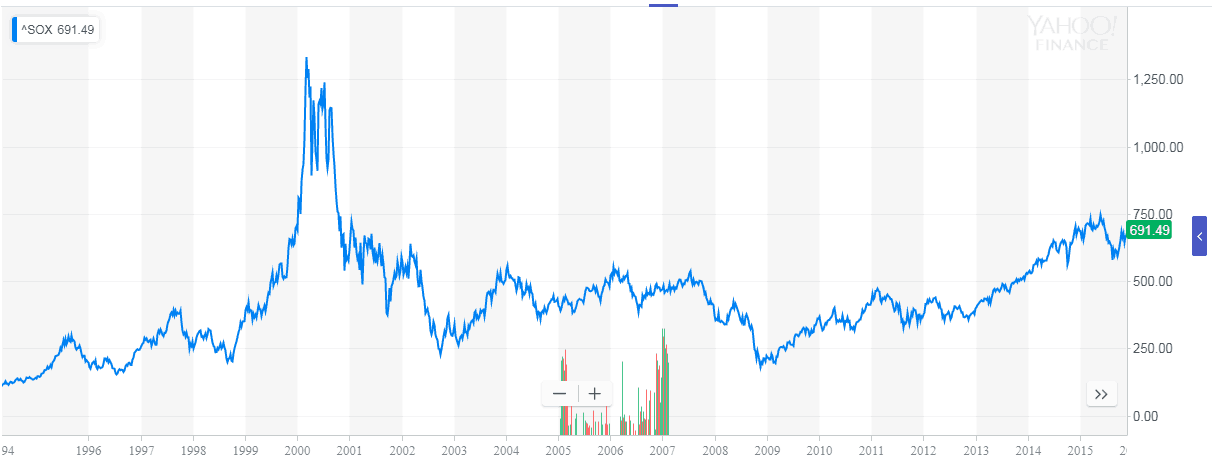
SOX Index (Source: Yahoo.com)
In the above chart, you can see how the peaks and troughs in the SOX index foretell the upcoming turns in the market. The most noticeable moments are the lead up to the 2000 dot-com bubble and the more recent 2008 global financial crisis periods.
How to trade the SOX index with ETFs
These days there are a number of exchange-traded funds built on the Philadelphia semiconductor index. Each of the ETF has it’s over the portfolio, but broadly they track the semiconductor index.
Regarding assets under management, the following are the biggest ETFs.
iShares PHLX Semiconductor ETF (SOXX): The SOXX ETF is the largest ETF with $1.4 billion in assets under management. The fund began in 2001 and tracked the 30 components from the main SOX index. The SOXX ETF has an expense fee of 0.47%. Investors can also trade options for the SOXX index. This allows investors to hedge their positions if need be.
VanEck Vectors Semiconductor ETF (SMH): The VanEck Vectors Semiconductor ETF comes in at a second regarding assets under management. This ETF boasts of $1.08 billion in AUM. The SMH ETF also has a higher average trading volume than the SOXX.
Unlike the SOXX, the SMH tracks the performance of just 25 largest companies in the semiconductor sector. The focus purely focuses on U.S. stocks in the industry. However, the holdings are divided between large, medium and small-cap stocks and offer a more balanced risk/return portfolio. On the flip side, the SMH has some big hitters in its listing with the top ten holdings accounting for over two-third of its total assets.
Direxion Daily Semiconductor Bull 3x Shares (SOXL): The Direxion Daily Semiconductor Bull 3x Shares ETF is unique because this is a leverage ETF. The ETF offers three times the daily long leverage on the PHLX index. This makes a powerful took for investors in the bull markets. The SOXL resets its leverage on a daily basis, so this results in compounding of returns.
The index has $674 million in assets under management with a slightly higher expense ratio of 1.02%.
Using the SOX to watch the markets
Investors, in general, like to see when the market will start to turn. Up until a few years ago, the manufacturing sector was the biggest. Thus, it made sense to watch the divergence between the Dow Jones Industrials and the Transportation index.
In the ever-changing world that is embracing technology at a rapid pace, semiconductors find their place in almost all appliances. From industrial machinery that is now computer controlled to a whole host of other things.
Therefore, watching the SOX and the S&P500 makes for an educative guess about where the markets are moving. The SOX is a leading indicator and can, therefore, tell if the main S&P500 index will continue high or post a correction.
The divergence between these two can, however, provide valuable trading opportunities.
The chart below gives an example of the SOX index and the NASDAQ100 Index. From August to September 2011, there was a bullish divergence on the between the two indexes.
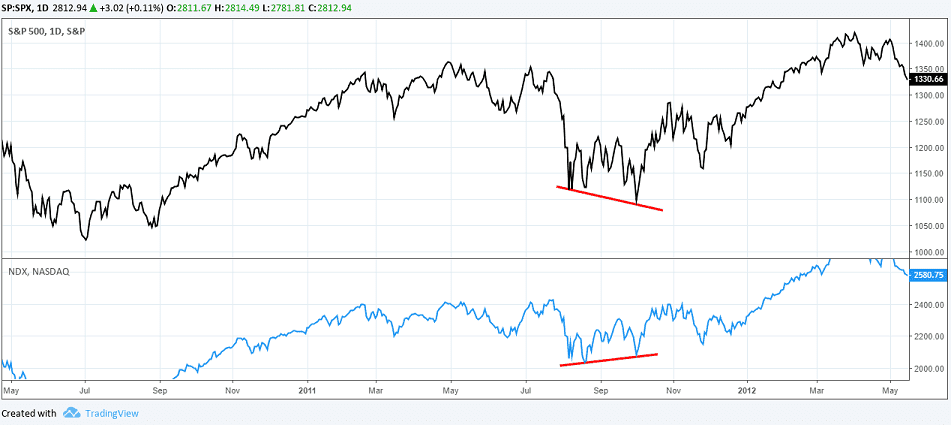
SOX and NASDAQ 100 Index
Following this divergence, the NASDAQ index turns around and eventually rises to fresh highs. While divergences are rare occurrences, when they happen, investors can find valuable trading opportunities.
The same approach can be used for using the SOX index with other major indexes as well. However, we find that applying the SOX index to the NASDAQ offers a more reliable gauge. Numerous studies show how this divergence can help.
The Philadelphia semiconductor index – In conclusion
To conclude, the PHLX index is unique. Although this index does not garner the same level of interest as with other indexes, the SOX index is indeed very useful. With the changing world, investors can find that using the PHLX will potentially identify trading opportunities.
It is rather interesting to note that despite the fact that the PHLX has been around for nearly a decade, it is not quite popular compared to other sub-sector indices. This gives investors an edge when tracking the Philadelphia semiconductor index to gauge the broader markets.
General investors who are investing or trading the broader markets will also find that using the PHLX index can be a valuable addition to their trading arsenal.


 Investment Articles


