ARMS Index – Brief Overview
The Arms index is a market breadth indicator used mostly by active traders to forecast intraday price movements. The Arms index was developed by Richard Arms in the 1960’s and is commonly referred to as the TRIN, which stands for Trading Index.
The TRIN or Arms index determines the strength of the market by taking into account the relationship between advancers, declineers, and their respective volume.
In theory, if there is broad market strength – all boats rise. Conversely, if the broad market is tanking, stocks are likely going lower on the sh0rt-term.
In this article, you will learn key factors and strategies for how to use the Arms Index to help with your trading.
4 Quick Things to Know About the ARMs Index
#1 – Understanding the Arms Index (TRIN)
For all its complexity in terms of number of calculations performed in real-time, the Arms Index is pretty simple to visually understand.
The indicator fluctuates around the zero-line. Depending on where the TRIN indicator is relative to the zero-line, the market can be viewed as either overbought or oversold.
In this regard, the Arms index is similar to other oscillators in that it fluctuates around fixed values and provides overbought and oversold conditions.
One of the most important aspects of the TRIN/Arms index is that it not only shows how many stocks are advancing and declining but also includes volume which brings additional confidence to signals.
Think about it, would you want to take a buy or sell signal if a stock is up 100% on 100 shares? I know this is an extreme example, but imagine if a few thinly traded stocks had the ability to wildly swing the values on the Arms Index.
#2 – 4 Components of Arms Index
While it is not important to know the intricate details on how the TRIN index is formed, it is important that a trader knows the basic components.
Four major components:
- Advancing issues: This is the indicator that shows the number of stocks (on the exchange) that closed higher
- Declining issues: Number of stocks (on the exchange) that closed lower
- Advancing volume: This shows the summed up volume of all stocks (on the exchange) that closed higher
- Declining volume: This shows the summed up volume of all stocks (on the exchange) that closed lower
I’m not going to go any further than this on calculations – this is why God made Wikipedia.
#3 – How to read data from the TRIN or Arms Index?
When there is a strong up day in the markets (advancing issues are higher than declining issues), the TRIN index falls below 1.0. Conversely, when there is a strong down day in the markets (declining issues are more than advancing issues), the TRIN or Arms index moves above 1.0
There are also times when there are high readings on the Arms index – meaning there is extreme bullish or bearish sentiment. These extreme levels are often an early indication a reversal is likely on the horizon.
Once the TRIN signals these extreme positions, traders can wait for price confirmation and act accordingly.
While the TRIN or the Arms index has a neutral point of 1.0, the extreme values can vary from one exchange to another. Ideally, the extreme values are read as 2.0 which usually signal that the market has formed a short term bottom.
#4 – TRIN vs TRINQ
The TRIN indicator is available in two formats.
The TRIN displays data for stocks on the NYSE and the TRINQ shows data for NASDAQ stocks.
The next chart shows the TRINQ applied to the Nasdaq 100 index to get a better idea on the indicator and its application to the stock chart.
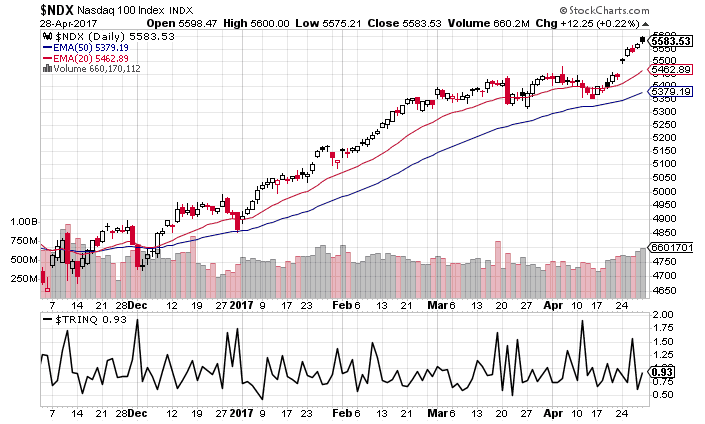
TRINQ and NDX chart
Notice how as the Nasdaq 100 spikes to the downside the TRINQ also reaches levels above 1.5.
Please do not read this and start placing buy orders every time the TRINQ spikes. Remember there is no ceiling on how high the indicator can jump.
Day Trading with the Arms Index (TRIN)
#1 – Trades Based on Arms Readings Intraday
Now that we have dived into the technical aspects of the ARMs indicator and some quick facts, let’s now shift gears into trading strategies.
The below chart depicts key turning points in the Nasdaq 100 Index and how these correlate with the Arms index.
 shows turning points in prices")
Arms index (TRIN Indicator) shows turning points in prices
From the above example we can make a number of observations.
For starters, when the Arms index is above 1.0 (the neutral point) but below 2.0 it signals that stocks are under pressure and a short-term decline is near. This is the time when day traders need to exit their long positions if any, or short sell the stock in question.
Similarly, when the Arms index is below 1.0 it signals buying pressure in the markets and thus, day traders can expect to see a short-term reversal. In this scenario short positions are off the table.
In the above chart, there are three instances highlighted where the TRIN signaled a short-term correction in prices. On the price chart, the sessions or candlesticks marked by the red arrow indicate the price action which signals the upside move in prices.
In the first instance, we had a morning star type of candlestick pattern. The second instance, we had a harami type of candlestick pattern with support from the 50 and 200 period EMAs. In the final scenario we had a bullish reversal candlestick pattern after the TRIN indicated a decline.
What’s common to all these signals is a three-step process.
- TRIN signals a correction and price falls accordingly
- Price confirms a reversal (which could also be validated by the respective volume of the security being analyzed)
- Exceed the previous high – signaling a continuation
#2 – Detecting Extreme Readings in the Arms Index
One of the drawbacks of the TRIN or the Arms index is that the turning points are not exact. Therefore, traders should look at entering the trade when there are more validations to the bias.
Sometimes, the Arms index can also post extreme readings. The next chart below shows the AAPL stock chart with the TRIN index.
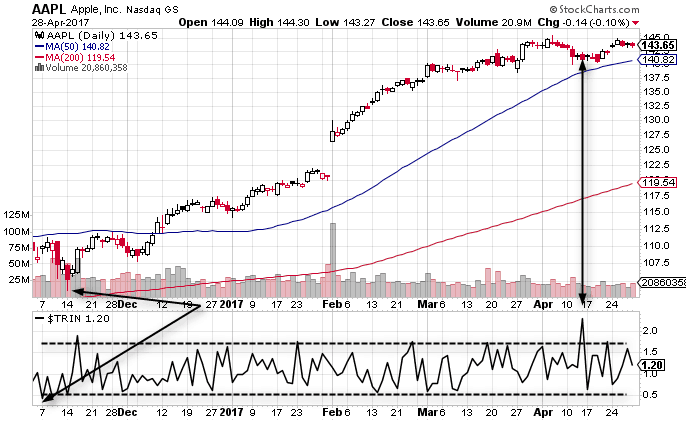
Extreme readings in TRIN coincide with sharp reversal in prices
Here you can see in the first instance where the Arms Index posted an extreme reading above 1.75 and below 0.5. These extreme readings usually coincide with sharp reversal in prices.
You will want to combine these extreme readings with high market cap stocks, since these securities will likely respond the most to shifts in the Arms index.
These are symbols like Apple, Google, and IBM.
#3 – Day Trading with the Arms Index and Bollinger Bands
In this day trading strategy, speculators can use the Arms Index alongside Bollinger Bands to short or go long when the Arms index spikes and the market is testing the upper or lower bands.
Please see the below chart for examples.
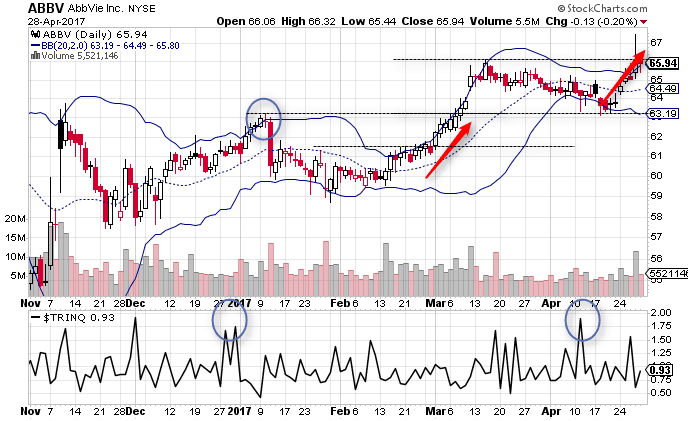
TRIN Indicator with Bollinger bands
Traders will need to keep tight stops to avoid scenarios where the market begins to run away from you and ride the bands.
However, in choppy or markets where the overall trend is flat, you can use the spike in volatility to go counter to the market for a scalp trade.
Is the Arms Index a good indicator for Day Trading?
Seems like a funny question since we just posted a day trading strategy with Bollinger Bands.
I think a better way of answering this question is what are all the key ways the Arms index can help with your trading.
Oversold/Overbought Levels
For one, traders can use the oversold and overbought levels as a confirmation to enter into a trade based on the analysis of their own trading strategy. Here, the TRIN can be a helpful tool to validate these turning points in prices.
Extreme Readings
Another way is to look for the extreme readings in the indicator. Depending on the stock or the security in question, an extreme reading can typically signal a strong price movement that day traders are alerted to ahead of time.
Trend Trading
The TRIN indicator is also ideal for trend traders. Although this would mean that traders need to keep an eye on the long term charts as well as the short term charts in order to pick the intraday or the short term reversals indicated by the Arms index.
Remember that prices can continue to post reversals when moving within a trend. Therefore, day traders should not mistake this to be a change of trend but rather the price corrections within a trend.
In Summary
The Arms index is not going to cook your dinner, but it can give you an idea of when it’s time to jump on or off a trend during the trading day.
If you swing trade or conduct long-term investing, you will likely want to ignore these readings unless you are looking for really extreme readings to gauge if a market is shifting.


 Trend Indicators


