The Descending Triangle Pattern - Learn 5 Simple Trading Strategies [Updated July 2026]
Jul 27, 2026
Written by: Al Hill
✓ Reviewed by Kunal Vakil, Co-Founder of TradingSim · Updated Jul 28, 2026
The descending triangle pattern is a type of chart pattern often used by technicians in price action trading. The pattern usually forms at the end of a downtrend or after a correction to the downtrend. However, it can also occur as a consolidation in an uptrend as well.
Chart technicians can make use of the descending triangle pattern in order to trade potential breakouts.
Bearish or Bullish?
Contrary to popular opinion, a descending triangle can be either bearish or bullish. Traditionally, a regular descending triangle pattern is considered to be a bearish chart pattern. However, a descending triangle pattern can also be bullish. In this instance it is known as a reversal pattern.
What is a descending triangle pattern? A descending triangle is a bearish chart pattern formed by a horizontal support line at the bottom and a downward-sloping resistance line created by a series of lower highs. The pattern signals increasing selling pressure as buyers fail to push price above previous highs, typically resolving with a downside breakout below support. Probability data suggests descending triangles break downward approximately 64% of the time.
To that point, the descending triangle can be viewed as either a continuation pattern or a reversal pattern. The triangle continuation pattern is your typical bearish formation. This pattern occurs within an established downtrend.
Descending triangle vs. descending wedge: A descending triangle has a flat horizontal support line and a downward-sloping resistance line. A descending wedge (falling wedge) has both support and resistance lines sloping downward, converging toward a point. Descending triangles are typically bearish continuation patterns, while descending wedges are generally bullish reversal patterns that signal a potential upward breakout.
On the other hand, a descending triangle breakout in the opposite direction becomes a reversal pattern. Considered the opposite of the ascending triangle, this pattern is also known as the bearish triangle descending pattern.
A very important fact to bear in mind when trading the descending triangle is that it is very subjective. Therefore if you are new to trading the descending triangle stock pattern, you need to have a lot of practice. Familiarizing yourself with it in the simulator will allow you to build your own custom triangle trading strategies.
What is a descending triangle pattern?
The classic version of this pattern forms with a trend line that is sloping and a flat or a horizontal support line. The pattern emerges as price bounces off the support level at least twice. The completion of the pattern occurs after the end of a retracement in a downtrend.
The downside breakout from the support triggers a strong bearish momentum-led decline.
However, this textbook pattern seldom occurs in the real markets. In most cases, a descending triangle pattern can also see a sloping base as well. Instead of a flat support level, you can see higher lows being formed.
The illustration below shows what an “ideal” descending triangle pattern looks like, which is often labeled a descending wedge, as well.
Example illustration of a classic descending triangle pattern
How to Trade a Descending Triangle Pattern?
Typically, the breakout from a descending triangle is triggered to the downside. The distance from the support to the first high is measured. This measured distance is then projected to the downside where the target price can be set. Simply put, that's how you trade a descending triangle pattern.
How to trade a descending triangle breakout: Identify the pattern by drawing a horizontal line connecting at least two equal lows and a descending trendline connecting two or more lower highs. Measure the height of the triangle (distance from horizontal support to the first high). Enter on a confirmed breakout below support with increased volume, and set your price target by projecting the triangle height downward from the breakout point. Place a stop-loss above the most recent lower high.
However, not all descending triangles breakout to the downside. You can also see an upside breakout from the descending triangle. In this case, it becomes a continuation pattern instead of a reversal pattern.
The same concept of measuring the distance from the support to the first high is used to determine targets. This is then projected to the upside for the minimum price objective.
In the next section of this article, we illustrate five descending triangle trading strategies that can be used.
Using descending triangle patterns to Buy/sell Stocks
Like with any strategy, you can use the descending triangle pattern to buy/sell stocks by knowing when to enter, take profits, and cut your losses. As we mentioned above, the simplest way to use this pattern is to buy the breakout of the triangle.
What does the descending triangle pattern indicate?
Essentially, this pattern is a consolidation that indicates a pause in upward momentum. It can either resolve to the upside or downside depending on whether or not shares are re-accumulated during the consolidation.
Usually, we like to see volume dry up into the consolidation if it is to resolve upward. More volume usually indicates more selling pressure in the descending triangle pattern.
In the sections below, we'll cover our five favorite ways to trade the descending triangle pattern. Feel free to use our guide as a tool to use this chart pattern in your trading toolkit.
1. The Descending Triangle Breakout Strategy
As the name suggests, the descending triangle pattern breakout strategy is very simple. It involves an anticipation of a breakout from the descending triangle pattern. This strategy uses a very simple combination of trading volumes and asserting the trend, which can be used to capture short term profits.
The first step in trading this strategy is to pick a stock that has been in a downtrend or in a consolidation phase. The time frame of the chart is irrelevant as you can use this strategy across any time period. Once you have identified a stock and the time frame, wait for price action to contract.
Be sure to allow for some flexibility in charting the patterns. Simply watch for lower highs and lower lows being formed. Once you have identified this price action, the next step is to draw or chart the descending triangle pattern.
The basic premise of using this strategy is to look at volume once you’ve identified the pattern. You can typically observe that volume begins to diminish toward the end of the descending triangle pattern formation.
The chart below shows an example of the Microsoft (MSFT) daily stock chart. In the chart, you can see that the triangle pattern was formed after price action was trading sideways. After a brief consolidation, price falls lower before breaking out from the pattern.
Descending triangle pattern breakout strategy
Volumes are usually lower closer to the breakout. Once you identify the lower volume, simply measure the distance from the first high and low. Then you project the same from the breakout area which becomes your target price. We show this with the dotted lines on the chart above.
This simple volume based descending triangle pattern is easy to trade but requires lot of time to watch the charts.
2. Descending Triangles with Heikin Ashi Charts
Using Heikin Ashi charts along with the descending triangle pattern you can develop a powerful but simple trading strategy. Heikin Ashi charts visually stand out compared to the conventional chart types.
One of the main characteristics unique to Heikin Ashi charts is the fact that they can depict the trend easily. Most traders often struggle when it comes to identifying the trend. You can resolve this confusion by switching to Heikin Ashi charts.
In this strategy, traders simply need to wait for the descending triangle pattern to be formed. Once the pattern has been identified, the next step is to wait for the bullish trend to pick up. In most cases, you will find that the Heikin Ashi candlesticks turn bullish prior to the breakout. This can be used as an initial signal to prepare for long positions in anticipation of a breakout.
The next chart below shows the Heikin Ashi chart for Alcoa (AA) on the 60-minute time frame. Notice that, prior to the breakout, the Heikin Ashi candlesticks turn bullish.
Descending triangle with Heikin Ashi candlesticks
Making Price Target Projections
The projections are based on the same strategy as before. Measure the distance from the first high to the first low and project the same from the anticipated breakout level.
Wait for the breakout from the descending triangle pattern. Initiate a long position after the first bullish Heikin Ashi candlestick. Then, project the measured distance from the breakout to get the target price.
Depending on your charting platform, you will notice that volume bars also change. This is because they reflect the bullish/bearish sentiment based on the Heikin Ashi candlesticks. Volume bars serve an additional purpose to alert you to a potential bullish breakout.
This descending triangle strategy with Heikin Ashi charts is effective to trade in the short term.
It is important to note that in this trading strategy we use the descending triangle pattern to anticipate potential breakouts. Along those lines, the moving average indicators serve the purpose of triggering the signal to initiate a trade.
In the following example, we use a 60-minute stock chart for General Motors (GM). We use a 10 and 20 period exponential moving average. Traders can experiment with their own settings on the period of the moving average; this depends on the time period that you use. For example, for a daily chart time frame, you can use the 10, 20 or 20 and 50 period settings.
Also note that using small periods (less than 10) could make your moving averages more sensitive to noise.
Descending triangle with moving averages
The above chart shows the 10 and 20 period EMA applied to the chart for GM. Notice that prior to the break out, the moving averages signal a crossover buy. The moving averages can be a great source to alert you when to initiate a trade.
There is no need to make use of volumes when trading with this strategy. Also note that you will not always see a bullish signal from the EMA’s prior to the breakout. After you get a bullish EMA signal and a breakout, it is an ideal signal to trade.
Projections and target price level methods remains the same as outlined in the initial strategy.
4. The Descending Triangle Reversal Topping Pattern
You can identify the descending triangle reversal pattern at the top end of a rally. This pattern emerges as volume declines and the stock fails to make fresh highs. The pattern indicates that the bullish momentum is exhausting. At the same time, price action forms a horizontal support level.
After price bounces off the support level multiple times, posting lower highs, we can anticipate a potential downside breakout. The minimum distance that price moves prior to the breakout is measured from the initial high. This distance is projected lower after price breaks out below the support level.
The descending triangle reversal pattern can be very easy to trade if you spot the pattern ahead of the breakout.
The next chart below illustrates the descending triangle reversal pattern in play. The stock chart for Morgan Stanley (MS) shows that after a strong rally, price stalls near the highs. Notice the support level that also stands out.
The Descending triangle reversal pattern at top
The resulting bounce off the support level leads to a lower high. Following this, price breaks down below the support with strong momentum. As you can see, the minimum measure distance is nothing but the project from the initial high.
5. Descending Triangle Reversal Pattern at Bottom
The descending triangle reversal pattern at the bottom end of a downtrend is the direct opposite of a distribution event. In this case, you will find that price action stalls at the end of a downtrend. A horizontal support level marks a bottom in price.
Multiple attempts to the upside lead to lower highs. Subsequently, price action eventually breaks to the upside from the descending triangle reversal pattern at bottom. Unlike the strategy mentioned previously, in this set up, you can trade long positions.
Traders can anticipate a potential upside breakout and trade the pattern accordingly.
Descending triangle reversal pattern at bottom
In the above chart set up for Goldman Sachs (GS), you can see how price fell to the lows, establishing support. The horizontal support level holds the declines where the bounce off the support level leads to lower highs.
Eventually, price action breaks out from the sloping trend line. Measure the distance from the horizontal support to the initial high and project this distance from the breakout level. The projected distance becomes your target price level.
Descending Triangle Pattern: Key Statistics for 2026
Understanding the probabilities behind the descending triangle pattern can help you set realistic expectations. Based on historical data across equities and futures markets, the descending triangle breaks to the downside roughly 64% of the time. The average measured-move target is achieved in about 54% of downside breakouts.
Descending triangles that form during an established downtrend tend to have a higher breakout success rate than those forming in sideways markets. Volume confirmation on the breakout candle significantly increases the probability of reaching the measured-move target. Low-volume breakouts are more prone to false breakdowns.
For day traders practicing in a stock trading simulator, tracking your descending triangle setups across different market conditions helps you develop a feel for which triangles are worth trading and which to avoid. You can also test how adding relative volume (RVOL) as a confirmation filter affects your win rate on these patterns.
Tips when Trading the Descending Triangle Pattern
Subjectivity is essential when trading the descending triangle pattern. Traders who wait for the “classic” descending triangle pattern will often find themselves on the sidelines.
Familiarity and experience are the best ways to trade, and that can only come through practice.
Keep in mind that the descending triangle pattern is also know as a measured move chart pattern. A measured move chart pattern is when you measure the distance and project the same from a breakout.
Many other trading strategies can blend well with the descending triangle chart pattern. It fits perfectly well within an investor’s buy and hold strategy. The triangle pattern also works with technical analysis which can complement the fundamental analysis as well.
In conclusion, the descending triangle pattern is a versatile chart pattern which often displays the distribution phase in a stock. Following a descending triangle pattern, the breakout is often swift and led with momentum. This can lead to strong results when one becomes familiar with the trading strategies outlined.
A descending triangle is traditionally considered a bearish continuation pattern because it features lower highs pressing against a flat support level, suggesting increasing selling pressure. However, the pattern can also resolve with a bullish breakout above the descending trendline, especially during strong uptrends. Always wait for a confirmed breakout before trading.
How do you trade a descending triangle pattern?
To trade a descending triangle, wait for price to break below the horizontal support level on increased volume for a bearish trade. Enter short on the break, set your stop loss above the most recent lower high, and target a move equal to the height of the triangle. For a bullish breakout, enter long above the descending trendline with a stop below support.
What is the difference between a descending triangle and a symmetrical triangle?
A descending triangle has a flat bottom (horizontal support) and a downward-sloping upper trendline, creating a bearish bias. A symmetrical triangle has both a descending upper trendline and an ascending lower trendline converging toward a point, indicating no directional bias — it can break either way with equal probability.
How reliable is the descending triangle pattern?
The descending triangle is considered a moderately reliable pattern, especially when volume confirms the breakout. Studies suggest bearish breakdowns occur roughly 64% of the time. Reliability improves when the pattern forms within a larger downtrend and when the breakdown candle shows a significant volume spike.
Can I practice trading descending triangles on a simulator?
Yes, TradingSim's stock and futures trading simulator lets you practice identifying and trading descending triangle patterns with real historical market data. You can replay specific trading sessions and refine your breakout entry and stop loss placement without risking real capital.
Descending Triangle — Is the descending triangle bullish or bearish? Learn how to trade descending triangle patterns with breakout strategies and real chart examples in 2026.
Source: TradingSim | Author: Al Hill, Co-Founder of TradingSim | Updated: April 2026
Alton Hill is the Co-Founder of TradingSim with over 18 years of trading experience. He completed the Design Thinking Bootcamp at Stanford’s D.School and brings expertise in Product Development to create the best trading simulation experience. His strategy focuses on trend-following systems, targeting high-volatility stocks with strong primary trends using the 15-minute chart.
Descending Channel – Learn How to Trade This Common Pattern [Updated July 2026]
What is a Descending Channel A descending channel breakout pattern consists of two parallel lines that are equal distance apart and surround price action. Are you confused yet? Well, a picture is...
What is a Descending Top Pattern? Descending tops develop when the price action produces lower tops between swing lows. As the tops are lowering with each successive move, a bearish trend is forming...
Ascending Triangle Pattern: How to Trade the Breakout [Updated July 2026]
What is an Ascending Triangle Pattern? An ascending triangle is just that, a triangle that’s on the rise. The pattern is a continuation pattern of a bullish event that is taking a breather as the...


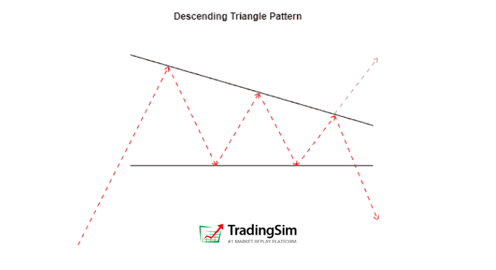
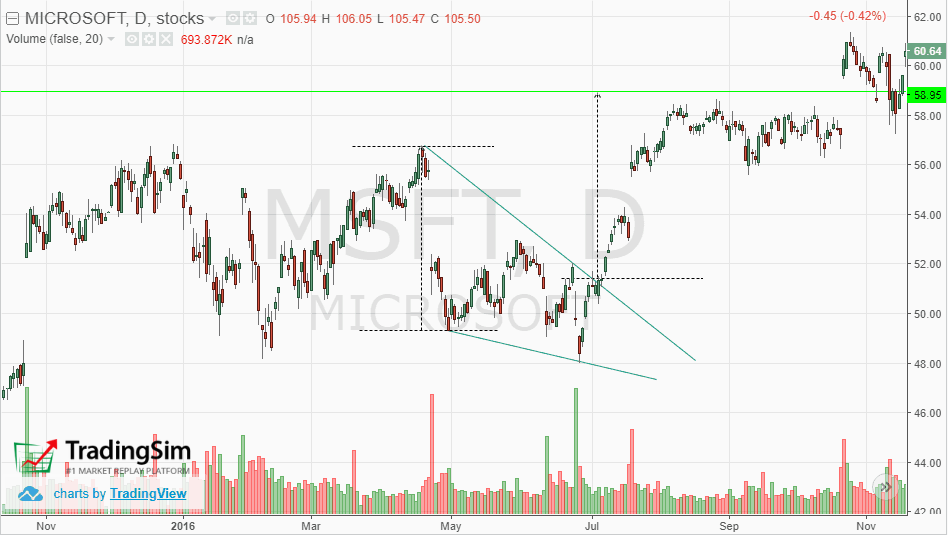
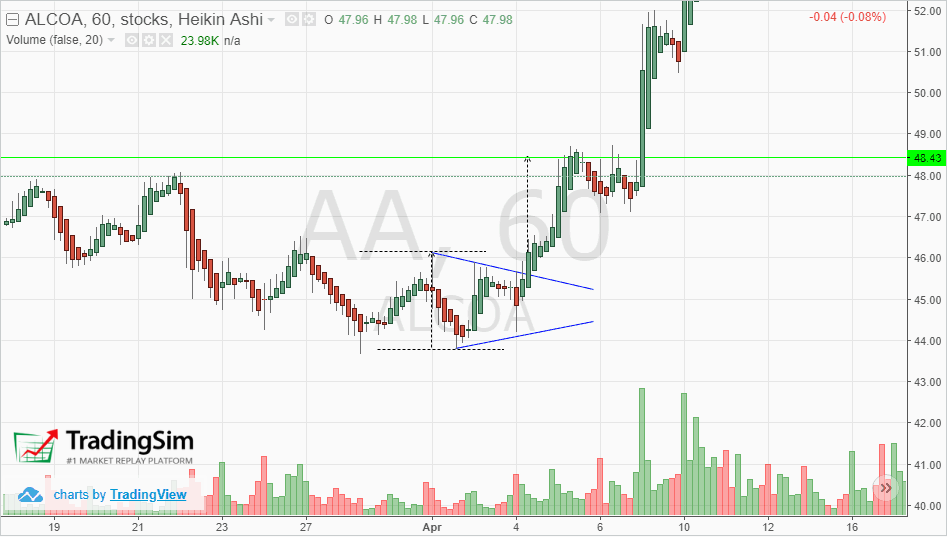
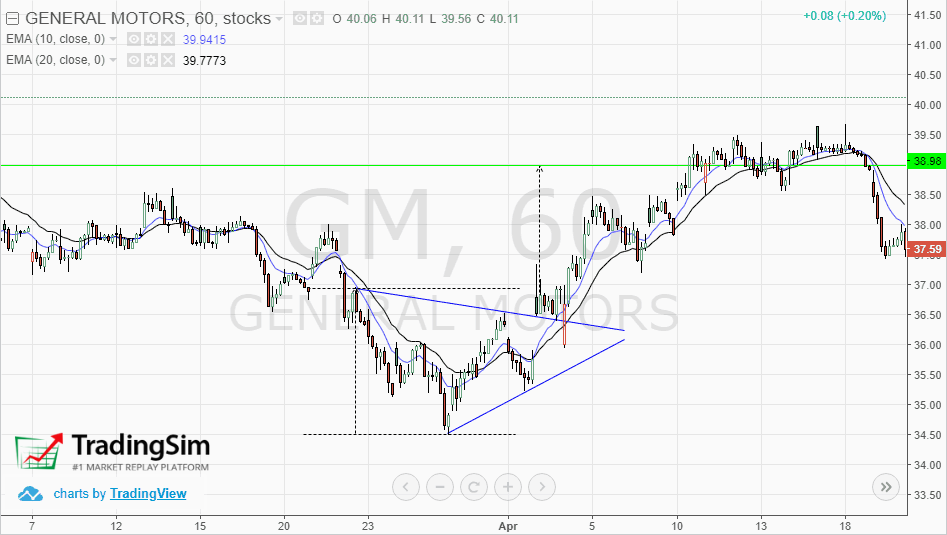
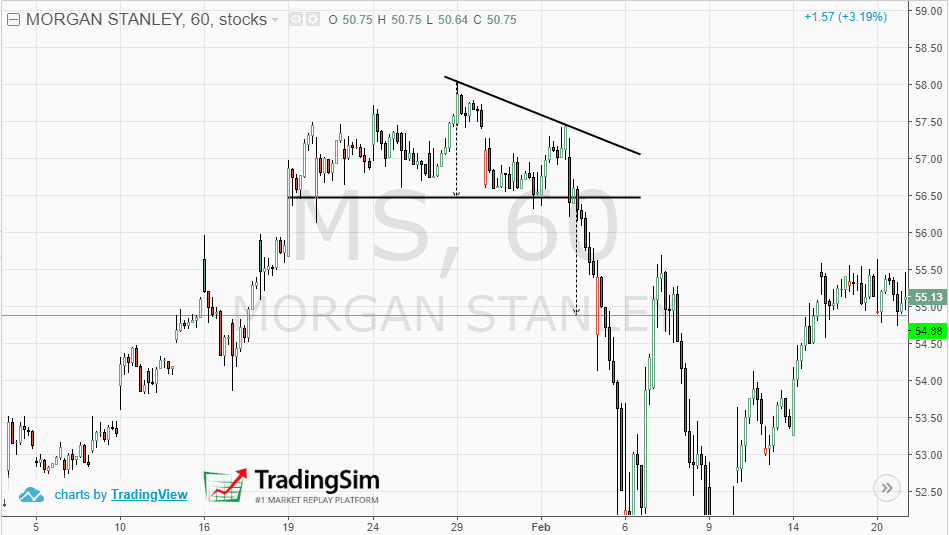
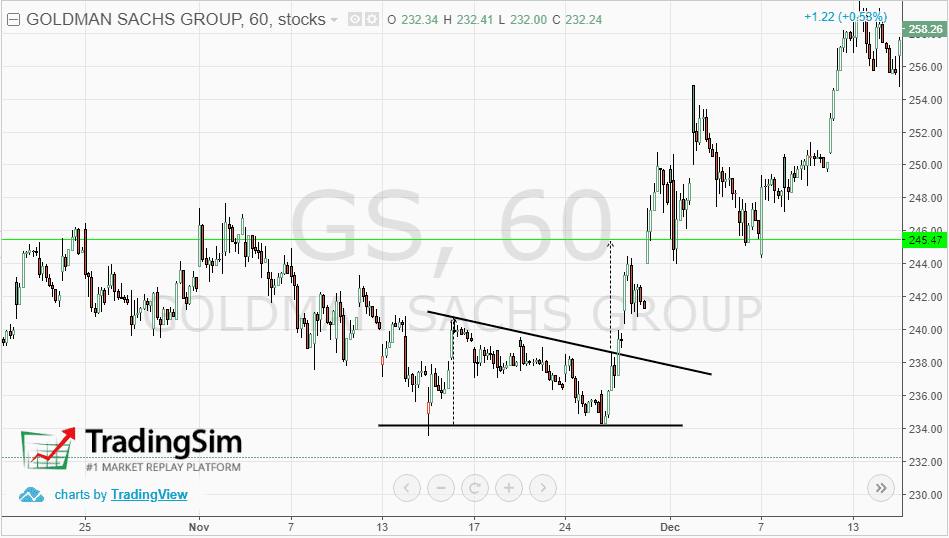


 Chart Patterns


