Last reviewed and updated by Al Hill on May 20, 2026. Links verified, schema refreshed, and an expanded FAQ added at the bottom of this guide.
Free stock charts are a great way to get your feet wet in the market without committing to a paid charting service. These days, there are quite a few options to try. However, as you grow as a trader and become more involved in the markets, we expect that you'll want to settle on at least one, but likely a few different charting services.
In this article, we'll analyze a handful of the best free stock charts on the web and explain how you can use them to further your education in the stock market.
Where can I see stock charts?
Nowadays, one of the best ways to view free stock charts is to have a stockbroker. Many retail traders trade through Robinhood, WeBull, TD Ameritrade, or many other brokerages. These brokerages all allow the use of their trading platforms for free. Therefore, if you open a brokerage account, you'll be able to utilize their charting platforms for free.
That being said, there are a number of sites where you can see stock charts on the web. We'll outline the top 6 best free stock chart services below, and compare the best ones.
What are the best free stock charts?
The best free stock charts will allow you to search for any equity in the stock markets and also allow you to view volume and other indicators as well. And, of course, they must be completely free.
When searching for a free stock chart to use, be sure to know what you need from a charting service. In the list we've reviewed below, we are looking for free stock charts that meet the following criteria:
- 100% free charting service
- Fundamentals data
- Intraday charts and real-time data
- Good dashboard with organized information
- Social sentiment and news for stocks
- Dynamic charting software that allows for customization
- Ease of use for beginners
Now, let's take a look at some of the best free stock charts on the web.
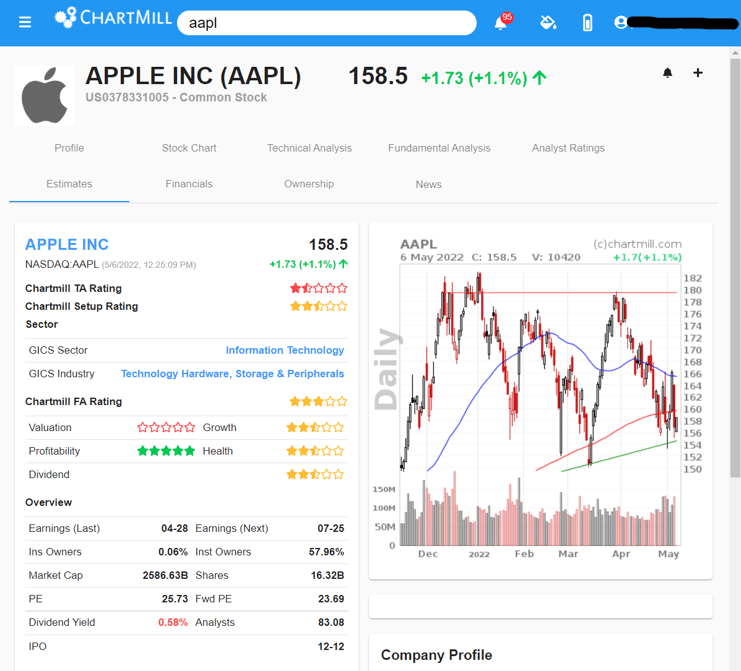
ChartMill.com
Chartmill.com has an excellent free charting and scanning option. The biggest benefit to Chartmill isn't their charts, though, it is their community-based trading ideas. You do have to sign up for their service, but you don't have to pay anything if you are a lighter user. In fact, they replenish your scan usage each month. They call these "free credits."
Let's look at some of the pros and cons of using chartmill.com's free stock charts:
| Pros |
Cons |
- Free charts
- Automatic trendlines
- Community-based trading ideas
- Easy to use
- Stock ratings
- Fundamentals and news
- Social sentiment
|
- Free credits run out for heavy users
- Charts are not dynamic
|
If you're looking for trading ideas, Chartmill.com can be a good resource. However, their charts are static and won't allow you to pan out and customize the view, indicators, or layout. Here is a snapshot of what a company profile might look like:
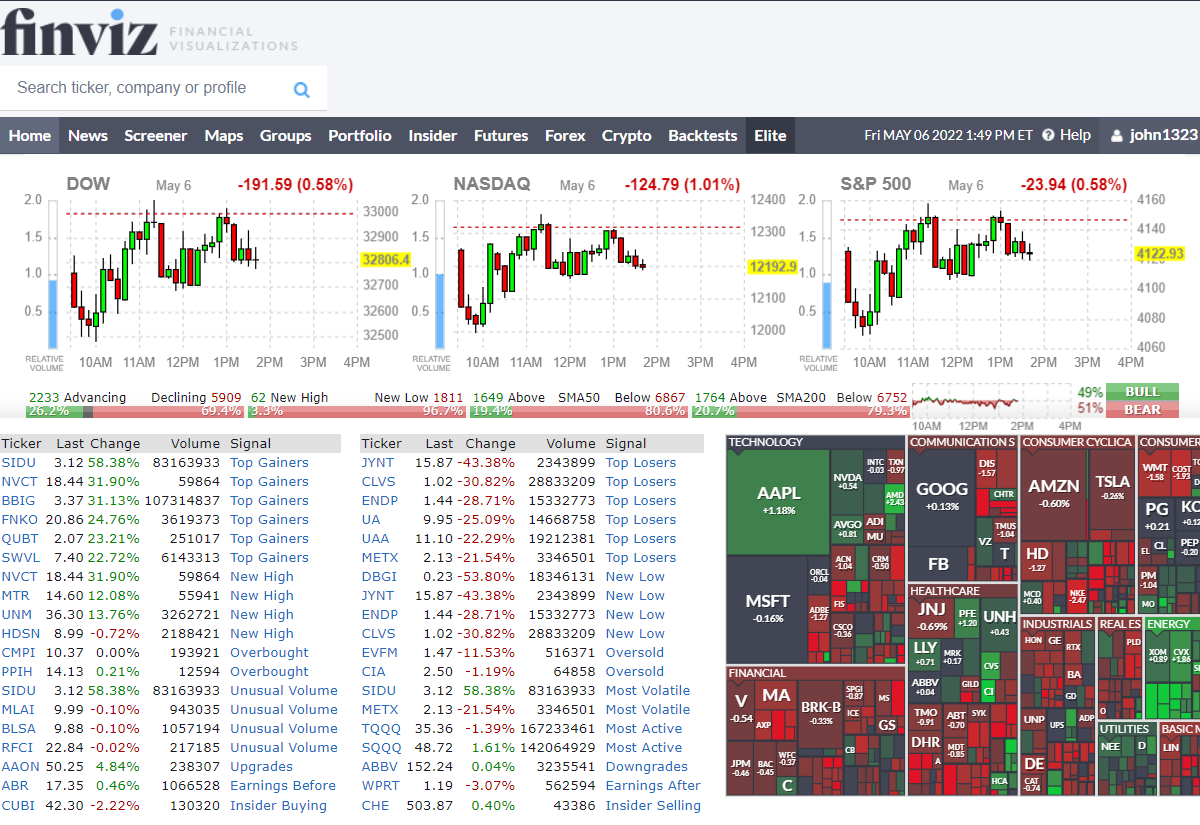
Finviz.com
Finviz.com is one of the most popular free stock chart applications on the web today. You'll find a wealth of information on finviz.com, and all for free. They do have a paid service that allows you to save stock screens and other cool features. However, if you are just looking for simple scans and charts, it is 100% free.
Like Chartmill, they also track fundamentals, social sentiment, news, and other pertinent information. However, their charts are limited in how dynamic they are. In other words, you can't zoom or pan or change very many features on the charts unless you upgrade to a paid subscription.
Here are some pros and cons of Finviz.com free stock charts:
| Pros |
Cons |
- Very user-friendly financial data
- Intraday gap, volume, and momentum scan results
- Pop-up charts
- Automatic trendlines
- Free screeners
|
- Static charts
- Lots of pop-up ads to block
- Delayed data
|
Most traders have used finviz.com at some point in their careers. Here is a quick snapshot of some of the data you can get from just visiting their homepage:
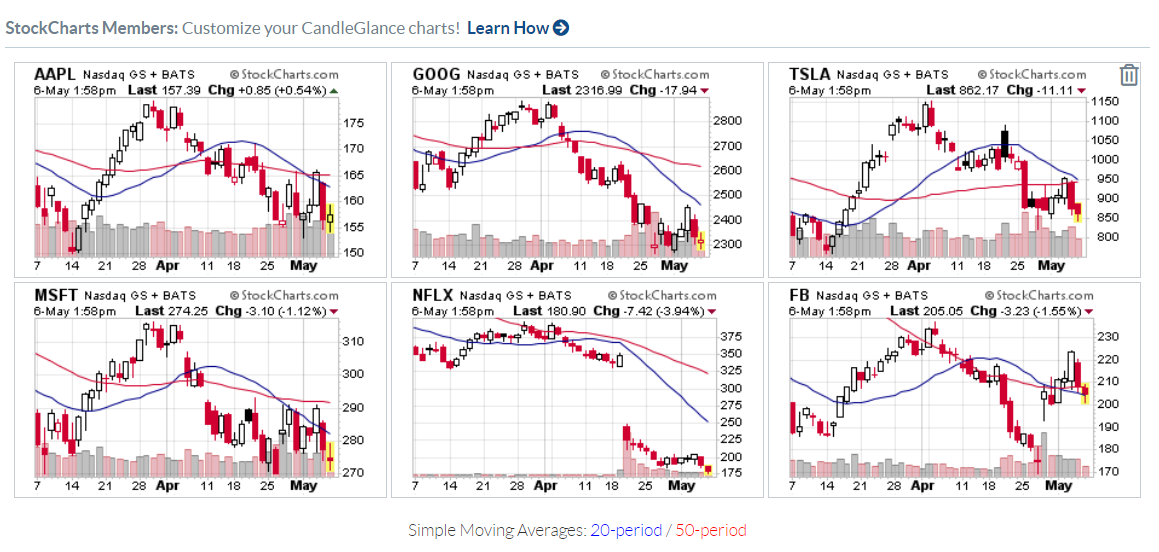
StockCharts.com
At stockcharts.com, you can view company stock charts for free. In fact, you can use the new StockCharts ACP charts, which will allow you to zoom in and out and modify some of the chart features. However, you're still limited to delayed data, so you won't be able to view intraday charts. And, stockcharts.com makes it difficult to navigate the site for free.
Stockcharts.com offers a wide range of options for paid subscribers, but their free stock charts are limited. They offer much less fundamental data than other free stock chart sites. You must register with them in order to customize your dashboard and access features like finviz.com offers with no sign-up involved.
| Pros |
Cons |
- Dynamic "ACP" charts
- Static Charts
|
- Fewer freebies than other sites
- Must register to see fundamentals
- No news
- No float data
- Very limited on the free side
|
One thing we like about stockcharts.com is their CandleGlance feature which allows you to search for multiple stocks and then compare them all together in small, grouped windows. Here is what that would look like:
tradingview.com
Of all the free stock chart services on the web, TradingView is the most widely used, and for good reason. They have over 30 million users. Their charts are dynamic, you can customize them, and the data, while not being 100% real-time, is as close as you will get.
In order to view actual real-time intraday data, you'll need to subscribe to a data feed like BATS or the NASDAQ. But, TradingView does a good job of aggregating most market data for the most popular symbols being traded. You can also get quite a few fundamentals and news for each ticker as well.
| Pros |
Cons |
- Very dynamic charts
- Customizable chart layouts
- Intraday data and charts
- Fundamental data
- Near real-time
- Watchlists
- Smart phone app
|
- More complicated than other free charts
- Slight learning curve
- Fewer fundamentals and dashboard on home page
|
Despite the learning curve that might seem complicated to newer traders, the TradingView charts are a popular option for rookie or seasoned traders alike.

Finance.yahoo.com
Yahoo! Finance also provides free stock charts for their readership. Just a quick search in their search bar for a company or ticker symbol will pull up loads of data. In fact, it is a good place to find what is trending each day, and what news is associated with the trend.
While data is slightly delayed intraday, you can still get a feel for the movement of a stock all the way down to a 1-minute chart. You can also maximize the charts and change them from line graphs to candlestick charts. Indicators and the ability to compare symbols is available as well.
| Pros |
Cons |
- Great news source
- Fundamental data
- Intraday data feeds
- Dynamic customizable charts
- Stock recommendations similar to your searched stock
- Social sentiment
- Performance ratings
|
- A lot of information in one place
- Analysis can be misleading
- Old-school user-interface
|
Despite being an old guard resource for stock news, Yahoo! Finance is still a good tool for free stock research and charting. Here's an example of what you might see after searching for a stock on Yahoo!:

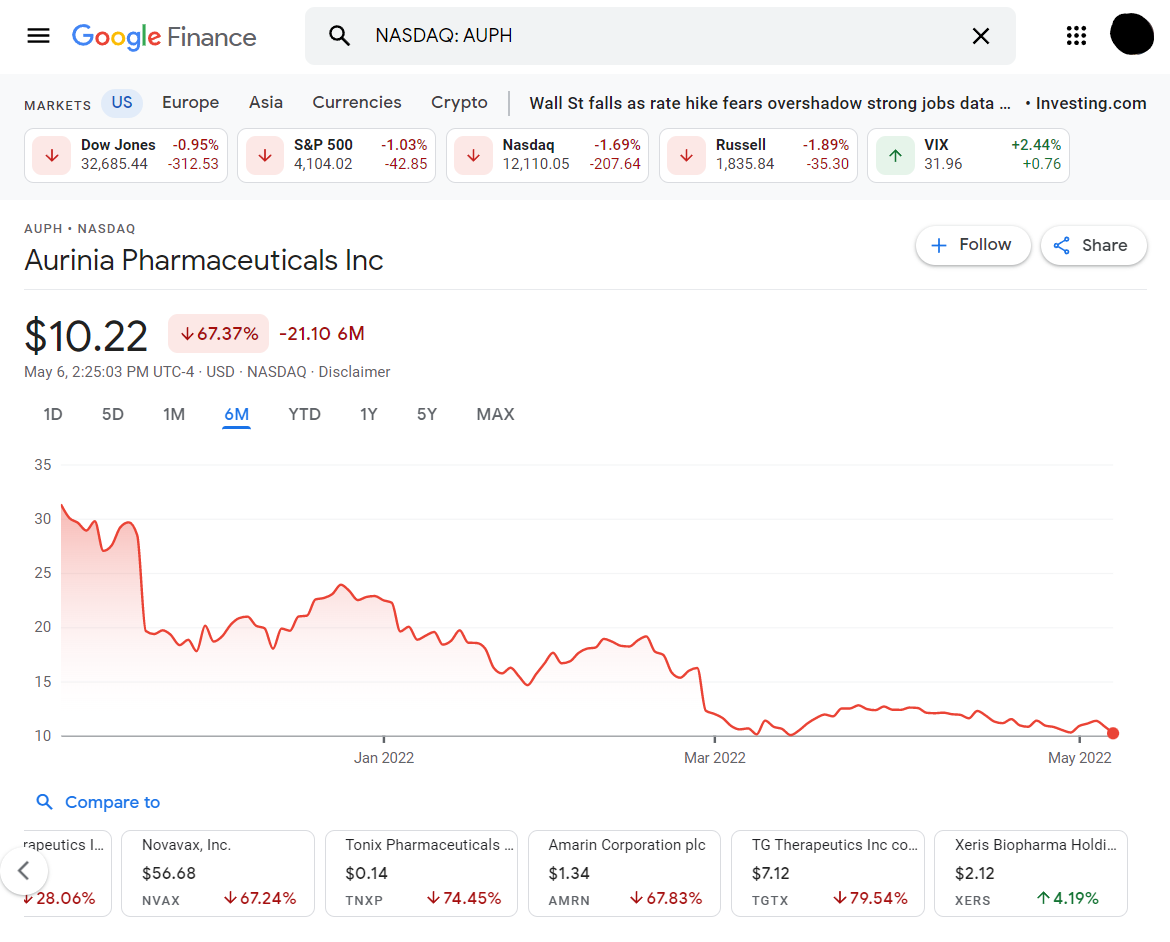
Google Finance
Google Finance is another good option for offering the best free stock charts on the web. Much like Yahoo! Finance, Google Finance offers a nice dashboard to search for general market data, as well as individual stock data.
Their charts are fairly basic, however. At Google Finance, you won't find fancy charts that allow you to zoom in and out, add indicators, or change from lines to candles. They do include recent news and some fundamental data, but not as much as other free services like Finviz.com or Finance.Yahoo.com.
| Pros |
Cons |
- World's largest search engine
- News resources
- General market information
- Free line charts
- Financial performance data
|
- Limited scope of data
- No real-time charts
- Static charts
- No customization
- Out-dated UI
|
As you can see in the image below, Google Finance is pretty bare-bones when it comes to financial data. If you want more granular information and better charts, you might choose another free stock chart service.
How to use free stock charts?
The best way to use free stock charts is to educate yourself on some very basic stock patterns. Most retail traders simply want to be told what to buy and what to sell and when. At TradingSim, it is our mission to provide the tools necessary for traders to become more educated and autonomous in their decisions.
To that end, if you are going to use free stock charts, make sure that you take the information with a grain of salt. Most free stock charts will include a lot of information that you will need to digest in order to make a decision in the stock markets. Be sure to test any stock trading strategies you have in a simulator before you pull the trigger with real money.
Also, consider that most free stock charts are not going to be fine-tuned for the needs of a day trader. You will need to eventually subscribe to a service that offers real-time data and custom indicators for your strategies. This way, you don't get caught on the wrong side of a trade with slow data. You need to be able to act fast.
But, for all intents and purposes, the best way to use free stock charts is for research. So, try them all out and find which one you like. The best thing is that they are free. There's no commitment other than the time you spend doing your homework on stocks with these free tools.
Are free stock charts real-time?
Most free stock charts are not real-time. Real-time data feeds come at a cost to charting software providers. Therefore, stock chart applications and companies seek to minimize their costs by passing real-time stock chart data onto their subscribers.
There are a few free stock charts that provide slightly delayed data that is closer to real-time than others. We've analyzed many of the popular options in our review above.
Because most free stock charts are using delayed data, we only recommend using them for research in your spare time. If you want to make educated trading decisions, we recommend that you subscribe to a charting service so that you can make sound decisions based on data you trust.
That being said, if you are a longer-term investor or swing trader, the delay in data for most free stock charts will not matter as much. However, you should have access to a broker's charts if you are actually trading. These charts may also be delayed. You should always check with your broker or charting platform to ensure you have the most up-to-date stock quotes and volume data.
How can tradingsim help
Here at TradingSim, we offer a 7-day free trial with access to our stock charts. Our stock charts allow you to replay the market for up to 3 years. If you're new to trading and want to become more active in your pursuit of trading as a career, we recommend you spend time in our simulator and replay software.
Over time, this will equip you with the proper outcome-tested strategies you need to succeed in the markets.

[Updated May 2026] What's New in This Guide
The 2026 refresh keeps the original platform reviews and adds a current quick-answer summary, an FAQ covering the questions traders ask most often about free chart packages, and a deeper internal cluster on the platforms and indicators these charts are designed to support. The short version: free is fine while you're learning, but real-time data becomes non-negotiable the moment you trade real money.
Quick-Answer Summary
TradingView — Deepest free chart package; large indicator library; community-shared scripts; delayed data unless you buy real-time exchange feeds.
StockCharts.com — Classical technical analysis; P&F charts, RRG, and SCTR scoring. Free tier is limited to end-of-day and a small watchlist.
Yahoo Finance — Most accessible; basic charts and delayed quotes; weakest for active intraday work.
Finviz — Best free screener with heatmaps and visual chart pattern recognition; charting depth is limited compared to TradingView.
TC2000 free tier — Solid U.S.-equities focus with a clean scanner; paid tiers are where the real value lives.
Frequently Asked Questions
What are the best free stock charts in 2026?
TradingView, StockCharts, Yahoo Finance, Finviz, and TC2000's free tier remain the most-used free stock chart platforms in 2026. Each trades off in a different area — TradingView wins on charting depth, Finviz on screening, StockCharts on classical technical analysis, and Yahoo Finance on accessibility.
Do free stock charts give you real-time data?
Most free chart platforms deliver delayed data (15–20 minutes) for U.S. equities unless you sign up for a paid exchange-data add-on. Real-time level 1 data for NYSE/Nasdaq typically costs $1–$5 per month per exchange even on otherwise free platforms.
Is TradingView's free plan enough for day trading?
For chart analysis, yes — TradingView's free plan covers most U.S. exchanges, includes the standard indicator library, and allows multiple chart layouts. The friction points are limited indicators per chart, no intraday extended hours, and ads in the interface. Most active day traders eventually upgrade to a paid plan once they're trading real size.
Can you backtest strategies with free stock charts?
Limited bar-replay tools exist on some free platforms, but they're typically restricted in lookback range and speed. Serious backtesting and pattern practice usually requires a dedicated replay tool — TradingSim's simulator replays U.S. equities with up to 3 years of intraday history.
Should beginners pay for stock charts or stay free?
Stay free while you're learning what to look for. Once your strategy is defined and you're trading real money — even small size — paying for one good platform with reliable real-time data is the right next step. The cost of one mis-fill from delayed data exceeds a year of subscription fees.
Related TradingSim Guides


 Paper Trading


