How to Read Stock Charts – Step-by-Step Instructions
May 14, 2019
Written by: Al Hill
In this article, I will detail how to read stock charts.
Unlike other articles which show you everything at once and then detail the components. I will buildup the chart like layers of a cake. As we talk through each layer, it will help you understand the significance of each item.
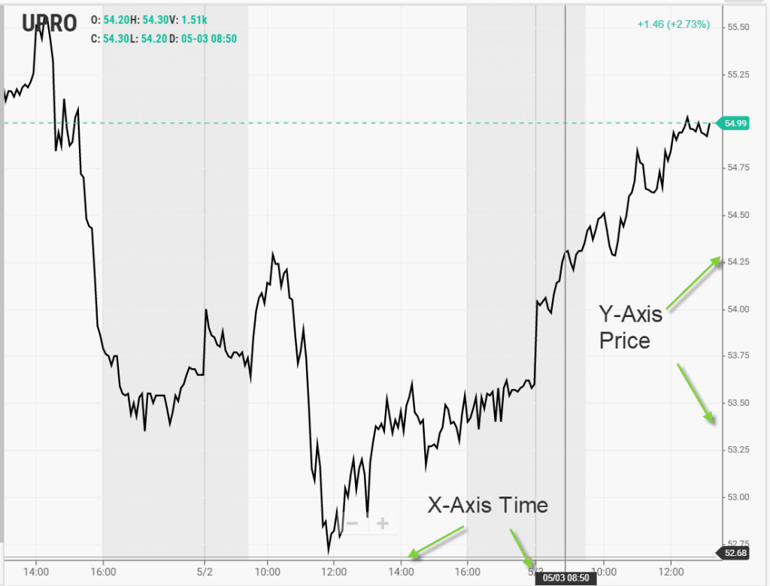
X and Y-Axis
A stock chart is composed of an x and y-axis.
So for all of you people that feel math in school is a waste of time – think again.
X-Axis and Y-Axis
The most recent time is to the far right.
For price, the highest price is in the upper right-hand corner, with the lowest price near the x-axis.
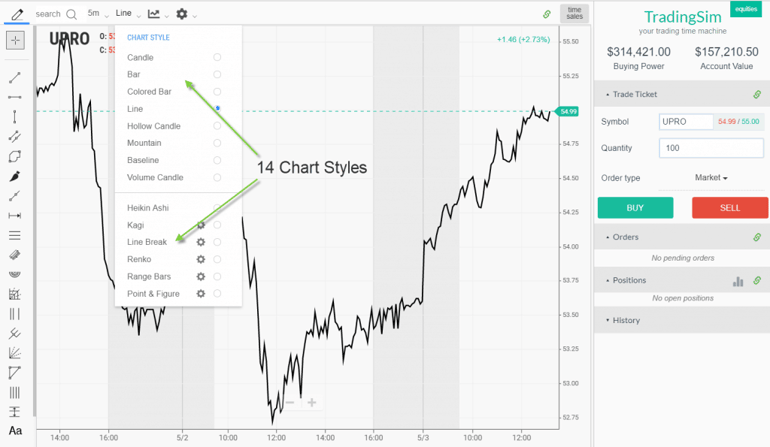
Chart Styles
The next layer we need to add is the type of chart. Now each trading platform will provide you with a host of charting styles.
These range from line charts, which you can see in the above image. Another is the point and figure which was huge in the early part of the 20th century.
Below is an image of the chart types we have in Tradingsim.
Chart Styles
With so many chart options which one should you choose?
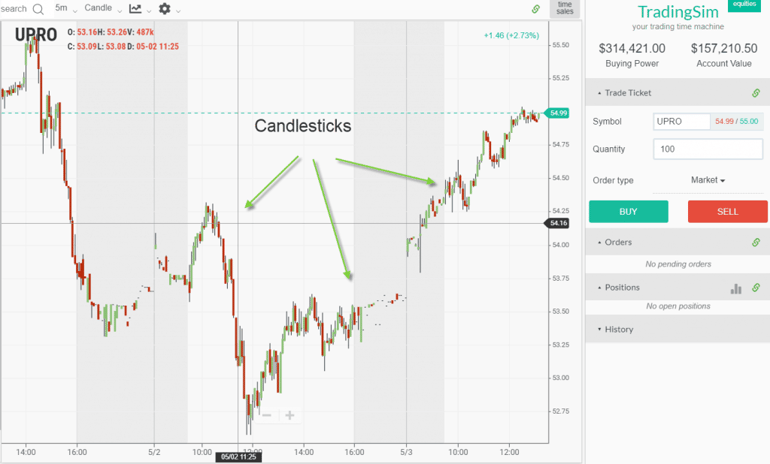
Candlesticks
Since the 90s the most popular charting style in the west is candlestick charts.
Candlestick Charts
One of the first things you will notice is the chart has red and green candles. A green candle represents a positive close on the period. A red candle represents a negative close.
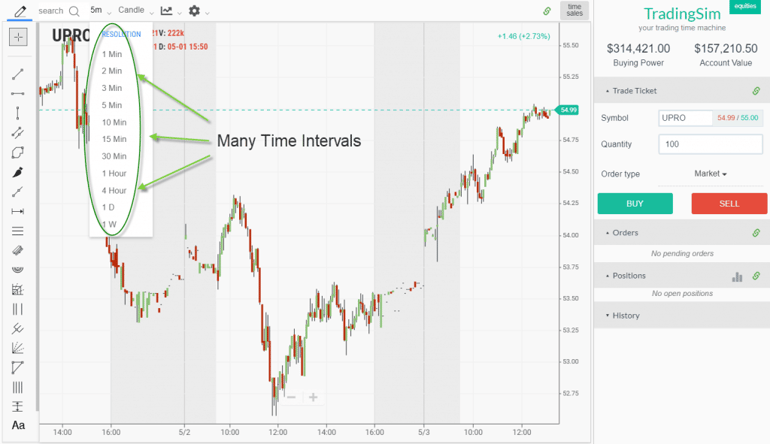
Timeframe
Now that you have the chart loaded up, you need to decide what timeframe you plan on trading?
Again, you move many options to choose from.
Many Time Intervals
As you see you can see there are over 11-time interval options and we are adding new ones every couple of months.
Once you get more advanced you can have multiple timeframes running at once in order to get a holistic picture of the trading action.
To keep this article focused, I am going to use the 5-minute chart.
Look Back Period
The next thing you need to tackle is how far to look back on your chart. The more data you bring in the greater the amount of information you will need to factor.
Meaning if you are looking at two days of data, you will see a different picture than if you zoom out two weeks.
This is because you could be going through a bullish trend over the short-term but if you zoom out, you will see that it’s in the context of a bear market.
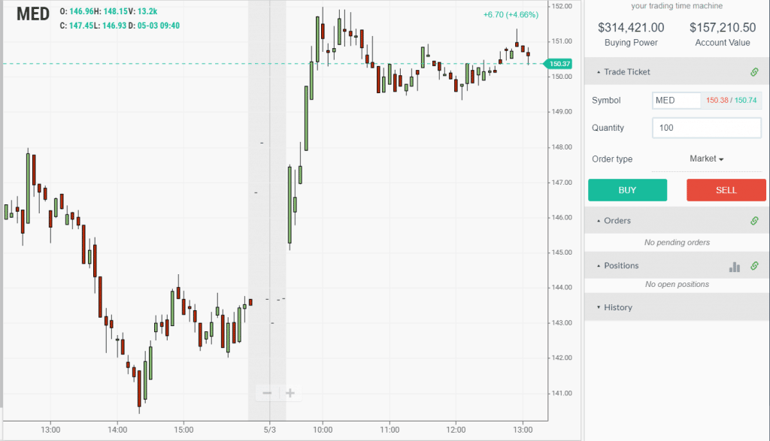
Bullish Chart?
Is the above chart a bullish setup?
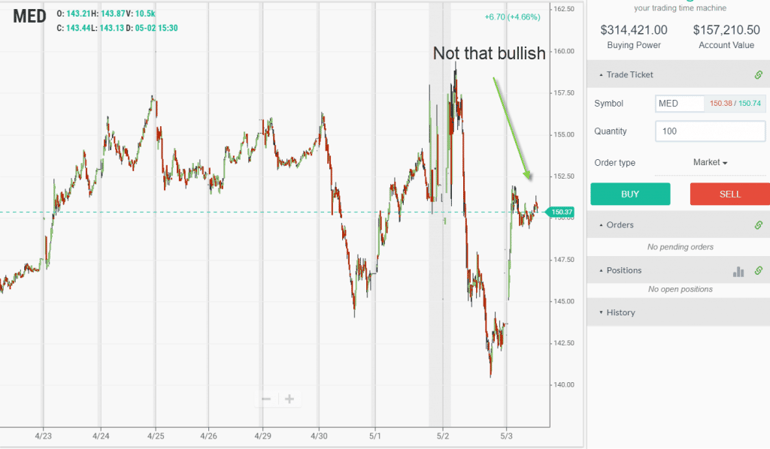
Now let’s look at the same chart zoomed out a bit.
Not That Bullish
When you are just starting out, you will want to zoom in and out on the chart to get a better picture of what’s going on.
At this point, we should take a quick pause to recap our progress. You now understand the types of charts, intervals and the need to zoom in and out.
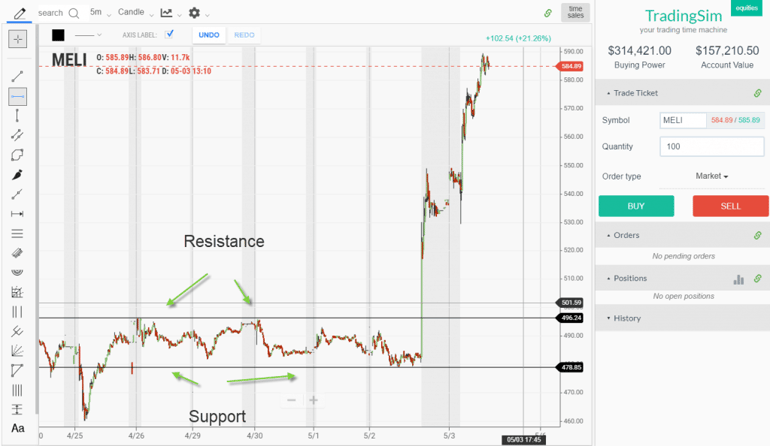
Support and Resistance Levels
The other key thing about charts is identifying support and resistance levels. The simplest way to perform this action is to look for recent swing highs and swing lows.
If price respects these boundaries then you have clear levels for you to pay attention to.
Now, each stock is unique, so you have to perform this process for each stock you assess.
Support and Resistance Levels
Do you see now how random chaos starts to shape form once you identify support and resistance levels?
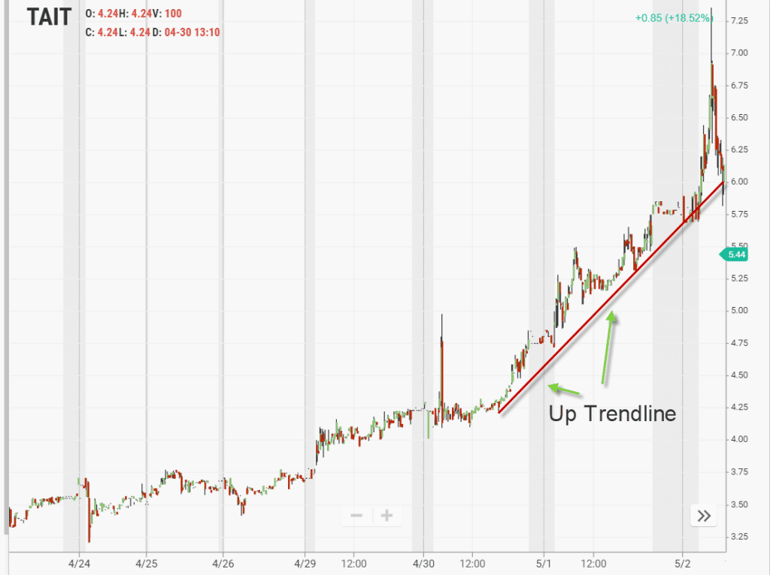
Trendlines
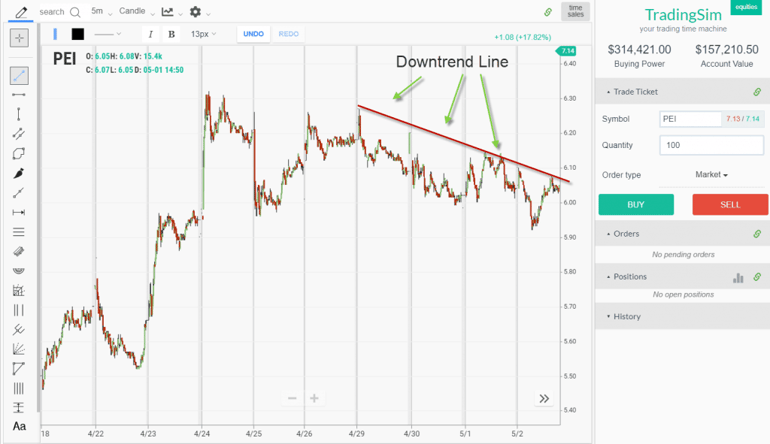
Trendlines is the evolution of support and resistance levels. Essentially instead of horizontal or sideways action like the previous example, trendlines allow you to encapsulate an up or down move in the market.
Why is this important? If you are going long, you will want to buy the dips or the tests of the trendline. If you are going short, you will want to short the tests of the trendline.
Up Trendline
Up Trendline
Down Trendline
Downtrend Line
Technical Indicators
At this point, the chart is pretty simple to read. You have price action displayed by the candlesticks and then you apply support, resistance and trendline drawings to identify trading opportunities.
Now is where things get a bit more custom.
Technical indicators are what traders use to forecast price movement.
These indicators can be chart overlays or off-chart indicators.
Chart Overlays
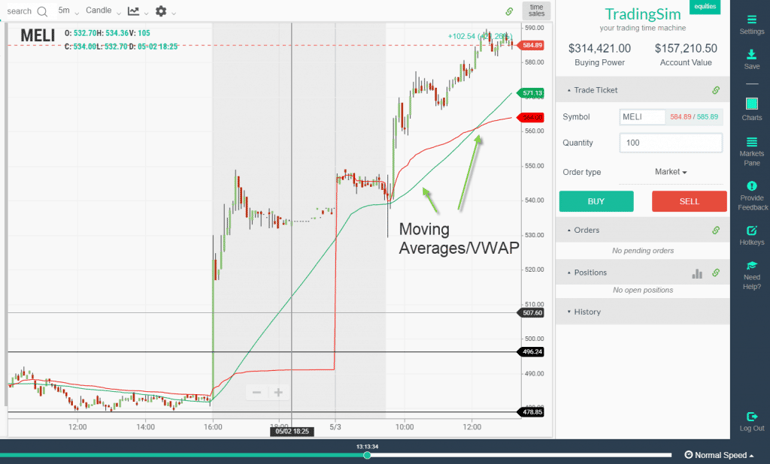
Chart overlays include items like moving averages and Bollinger Bands which are displayed on the chart.
Overlay Indicators
Some of the most popular overlay indicators are moving averages and the VWAP.
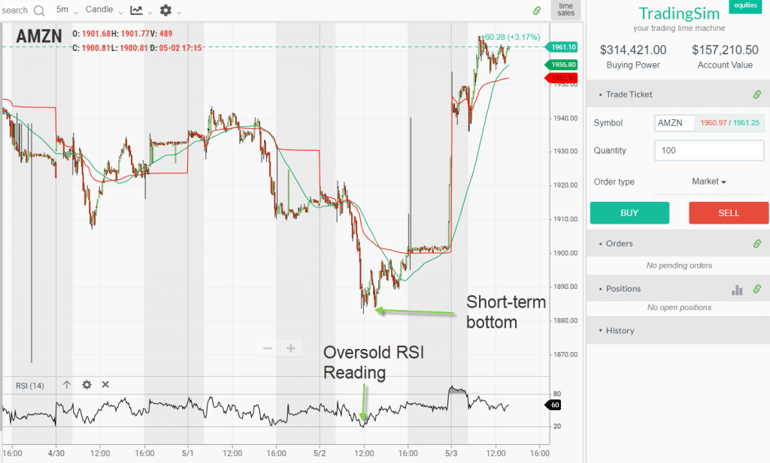
Off-Chart Indicators
The off-chart indicators are tools that forecast when a stock is oversold or overbought. This allows traders to open positions in hopes of capitalizing on these price inefficiencies.
For example, if a stock is oversold while trading in a range, this could be an awesome opportunity to open a long position.
Off-Chart Indicators
Keeping Data
What you don’t see on the chart, but is essential to properly understand stocks is chart patterns.
There are far too many to cover here, but you need to master patterns. Out of everything I have seen in the market, patterns are repeatable and consistent.
You need to track every pattern that interests you. This can range from double bottoms to opening range breakouts.
Apply your desired indicators to the charts in order to gain insights into how stocks will perform under certain circumstances.
You will want to track the average price move and the percentage of times the pattern works.
Over time you will begin to see data patterns which will help give you an edge.
Again this sort of analysis is still related to the chart, but it will require you to do some homework on your end.
How Can Tradingsim Help?
You can use Tradingsim to configure your chart to begin the process of reading stock charts. Reading the charts is a skill that you can develop over time, but it is not something you can master after watching a trading tutorial video or reading a book.
1 – What are Kagi Charts? Kagi chart is a type of chart that is used to track the price movements of a security. Unlike traditional stock charts such as the line, bar (OHLC) or candlestick charts,...
Overview As a day trader, a common question asked is should you trade daily charts? The root of the question comes down to the fact you are trading intraday, so why care about what’s happening on...
Overview of Swing Trading Swing trading is a form of active trading. The goal is to make a profit on a trade from a time span as short as a few days to a few months. You can place trades on both the...


 Intro to Stock Charts


