What is an Ascending Triangle Pattern?
An ascending triangle is just that, a triangle that’s on the rise. The pattern is a continuation pattern of a bullish event that is taking a breather as the security attempts to climb higher.
It is literally the opposite setup of the descending triangle.
The ascending triangle pattern is what I would like to call a classic chart pattern. What I mean by this is take a technician from the 1980s, you could say ascending triangle and they would know exactly what you are talking about.
What does an ascending Triangle pattern indicate?
Ascending triangles indicate a pause or consolidation in price action in a trend. After the initial leg up, the pause is a time for traders to reassess the move by selling or accumulating more shares. Usually, we expect the stock resume the main trend.
The first key component of the formation is a series of higher lows. For me personally, I like to see a minimum of 3. This allows me to draw an uptrend line going into the breakout.
The reason I go with 4 is you want to make sure you are not using two swing lows for example and inflating that into a full-blown ascending triangle chart pattern.
Remember, with technical analysis, if you don’t keep it simple, you will begin to see things that aren’t even there on the chart.
Clear Resistance Level
The other key piece is the clear resistance level with a series of highs occurring at or near the same price. [1] You don’t want to have one or two peaks, this my friend is just a swing high or double top.
There needs to be a number of clear attempts by the bulls that go nowhere with the price.
The Ascending Triangle Pattern Should Look Boring
The last criteria are the most important. The pattern should feel like you are back in after school detention staring at the clock, just waiting to get out.
Now, this does not mean to say the ensuing breakout or breakdown doesn’t deliver on the hype. What I am saying is the development of the pattern feels slow and arduous.
By the end, you could be saying to yourself, “Just get finish it up already.”
Using Ascending triangle patterns to buy/sell stocks
Trading the breakout is the classic method for assessing the pattern. According to Michael Kahn from Barron’s, “chart watchers will wait until the market speaks with an actual breakout because there are no guarantees just because a certain pattern forms.” [2]
Let’s review a few chart examples to drive home the point of the pattern.
There is No Perfect Ascending Triangle Pattern
Ascending Triangle Breakouts
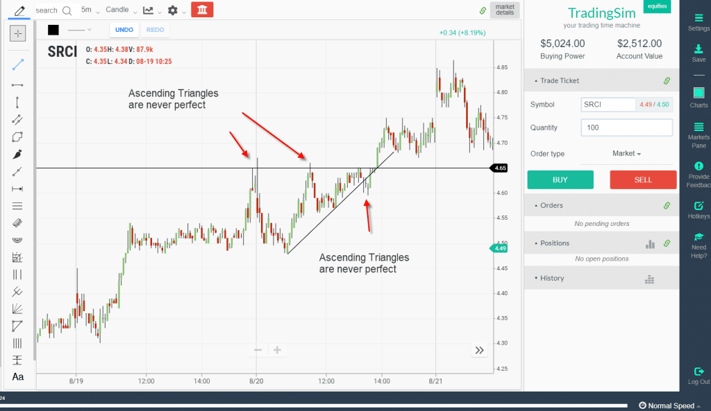
What’s the first thing you see in this pattern? That’s right, the pattern is not perfect.
I remember how I would read a book on a specific chart pattern and then when I would go in the market, I could never find an exact match.
For example, in the chart above, notice how the highs are not within .01% of one another.
Next, notice how the stock breaks down through the uptrend line, only to shoot out the top.
Volume on the Breakout
The next thing you want to see in a breakout is for volume to accelerate on the move higher. This does not mean the volume on the breakout has to be the highest over the last 20 hours or something. It just means you need to see some acceleration to the upside.
The key point is you want to see buyers participate in the move to increase the likelihood of follow-through.
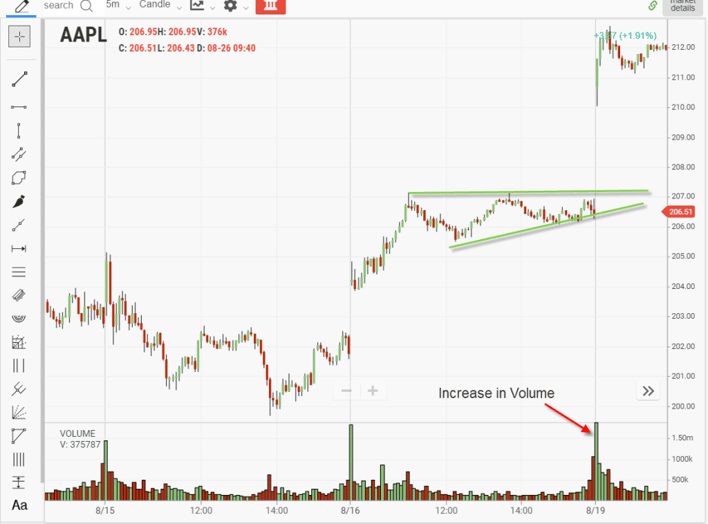
Increase in Volume on Breakout
Now I admit, finding a pattern that results in a morning gap is the easy way to identify volume on the follow-through. I just wanted to make sure I could find a clear example that everyone would read and nod their head to.
However, the same principle applies to intraday trading.
Ascending Triangle Failures
I now would like to touch on ascending triangle stock patterns that fail. Now failure is relative depending on how you are trading the setup.
Remember, if you are approaching the pattern from a neutral position, you just go where the action takes you.
However, if you are trading the pattern in a classic sense, failure is when it breaks down and falls out the bottom of the upward trend line or the stock briefly breaks out, only to rollover.
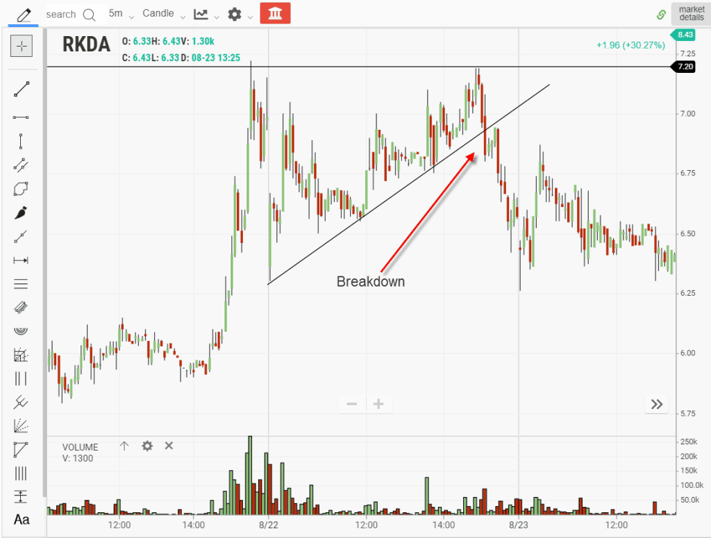
Ascending Triangle Breakdown
The uptrend line breakdown if you are looking to get long is the better of the two. This is because if you wait for the resistance level to be breached before you buy, you would not be in the trade.
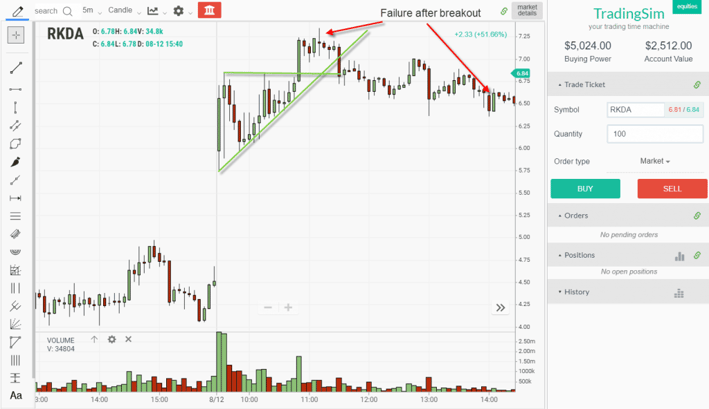
Ascending Triangle Failure
The above chart example is the more painful of the two failures. The setup for this failure is the stock makes a new daily high with strength. Both price and volume action looks great and then the stock begins to stall.
The stock then rolls over and trades sideways to down the remainder of the day.
The one key point to note is if you are in the setup, you need to stop it out once things begin to fall apart. Not only are you in a losing trade, but you are now wasting time sitting in the position all day.
Does an Ascending Triangle Imply a Bullish or Bearish Trend?
If we go with the pure textbook definition, an ascending triangle implies a bullish trend. According to Matt Miley, Miller Tabak’s chief strategist, when discussing ascending triangles, he states, “When that stock or index finally breaks above that key level in any kind of meaningful fashion, it shows that the sellers have basically sold what they’re going to sell and it gives you kind of a little bit of an air pocket, and the stock or index can take off.” [3]
However, in my experience, even with an ascending triangle, anything can happen in the market.
Therefore, the best course of action is to trade your trading plan and not get locked into hard numbers or expectations around the pattern.
For every bullish breakout that hits the upward target perfectly, there will be another batch of trades that outright fail or the move higher is anything less than stellar.
How Do You Trade an Ascending Triangle Pattern?
The pattern is actually straightforward in terms of how to trade the setup.
#1 – Entry
The classic method is to buy the breakout once you have had 3 or more touches with volume.
Now, you have a few choices of where to enter.
Highest High
The first option is to purchase on the highest high after three or more tops. The potential issue with this approach is that the stock could fail and is still either developing the ascending triangle or you are caught in a bull trap.
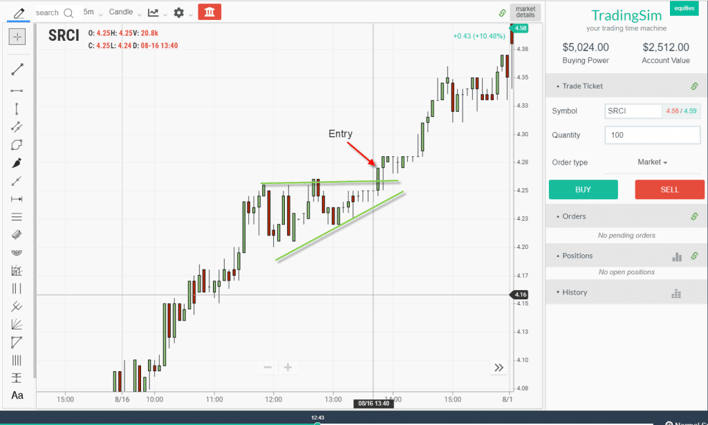
Classic Entry
Pivot Points
This is my personal favorite. I like to wait for a key pivot point resistance level to be breached and then place a buy order slightly above this level.
The potential issue with this approach is you are exposed to more risk as you are buying at higher levels with greater downside exposure.
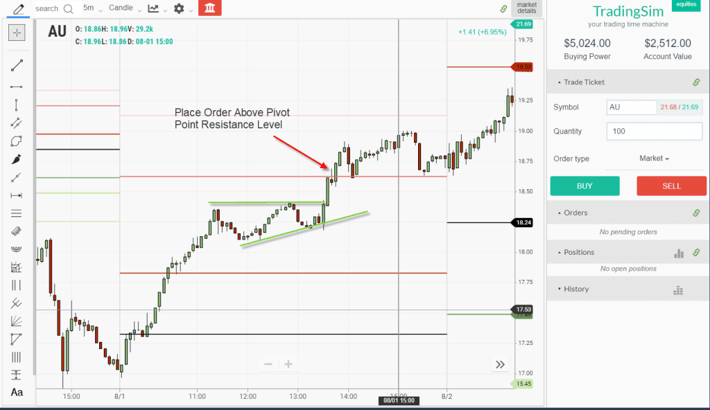
Entry Above Pivot Point
Unconventional Entry
Another approach is to buy inside of the triangle. This is completely counter to what you will read in books and on the web, but let me explain further.
Once you see the pattern setting up, you can wait for a touch of the uptrend line and then place a long entry. The benefits with this approach are that you can place a tighter stop since you are closer to the demand line (support), This also gives you profit before the stock hits the high of the day.
The downside to this approach is you could be idle in the position for hours waiting for the move through the top of the triangle.
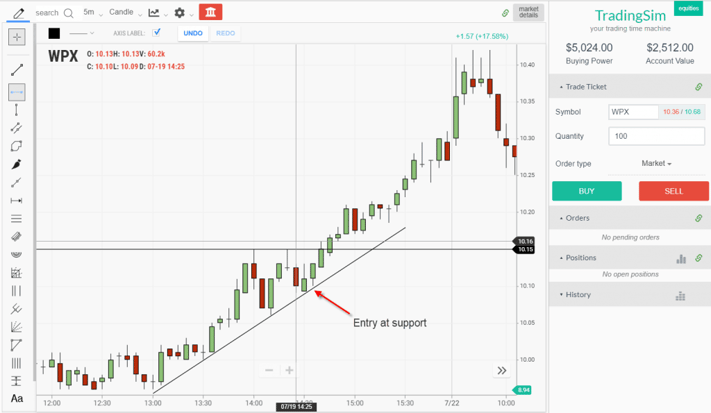
Entry at Support
#2 – Stops
Uptrend Line
There are multiple areas where you can place your stop orders. First, you can place the stop order beneath the uptrend line.
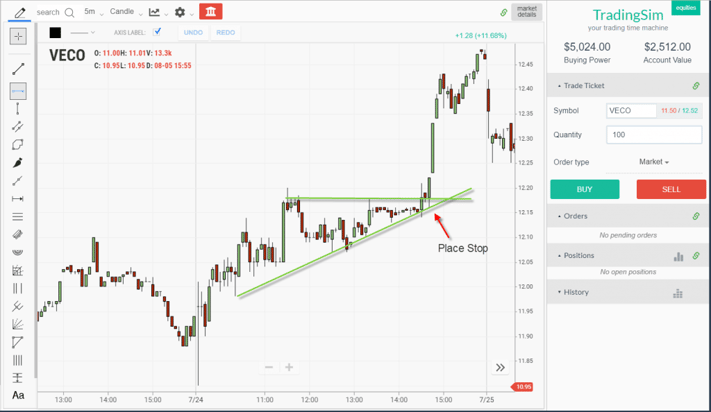
Place Stop
Low of the Breakout Candle
If the stock is able to break out, you can place your stop below the low of the candlestick. This way if the stock rolls over, you are not waiting until the uptrend line is breached. This way you can keep more of your gains.
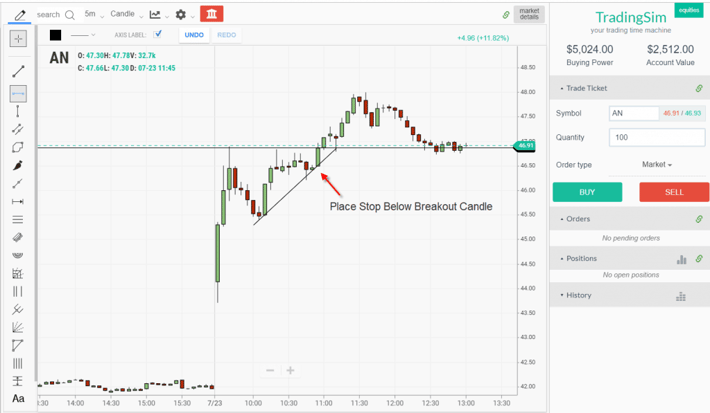
Stop Below Breakout Candle
On first glance, you may say, what’s the big difference between the stop below the candle and the stop below the uptrend line?
The difference is the uptrend line follows the trend, while the stop below the breakout candle is fixed.
This helps in the scenario where the stock rolls over and breaches the uptrend line, but does not break the low of the breakout candle. You will see these shakeouts occur right before a stock really takes off.
#3 Profit Target
The profit target for the setup is the distance of the triangle added to the top.
In the event of a breakdown, the target is the size of the candle added to the breaking point.
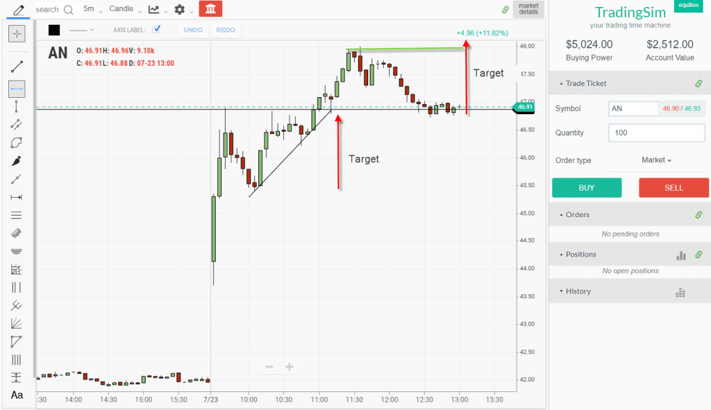
Ascending Triangle Target
In Summary
The ascending triangle is a pattern you should familiarize yourself with when trading. It’s important to understand the most popular chart patterns in the market in order to better understand price movement.
You can use Tradingsim to practice identifying and trading the ascending triangle pattern until you feel comfortable.
Good luck trading!
External References
- Achelis, Steven. (2001), ‘Technical Analysis from A to Z‘. McGraw-Hill. p. 82
- Kahn, Michael. (2007). Energy Stocks Knocking on the Door. Barron’s.com
- Gurdus, Lizzy. (2019). This chart pattern is popping up all over the market and could signal a breakout for stocks. CNBC.com
Ascending Triangle Pattern: Quick Answer (Updated April 2026)
An ascending triangle is a bullish continuation pattern that forms when price prints a flat horizontal resistance line while progressively higher lows compress price upward. Buyers absorb the supply at the resistance level on each test, demand strengthens, and a breakout above the flat top often produces a measured move equal to the height of the triangle base. The pattern works best in an existing uptrend, on liquid stocks or futures contracts, and on volume that contracts during the build and expands on the breakout.
- Bias: bullish (continuation pattern in an uptrend, less reliable as a reversal at the bottom of a downtrend).
- Entry trigger: a candle close above the horizontal resistance with above-average volume.
- Stop: below the most recent higher low or the 20-period moving average, whichever is closer.
- Target: measured move = height of the triangle base added to the breakout price.
- Time-in-pattern: typically 4–8 weeks on daily charts, 4–8 hours on 5-minute intraday charts.
The Three Conditions That Make an Ascending Triangle Tradable
Not every chart that looks like an ascending triangle is worth trading. Use these three filters before risking capital:
- A clean horizontal resistance line that has been tested at least twice. One touch is a coincidence; two touches make a level; three or more is what you want before betting on a breakout. The cleaner the wicks line up with the resistance, the more decisive the eventual breakout.
- A series of higher lows that visibly compresses toward resistance. Draw the lower trendline through the swing lows. The slope should be positive and the lows should converge into the resistance line over time, not run flat or wander sideways.
- Declining volume during the build, expanding volume at breakout. Volume contraction tells you supply is drying up. The breakout candle should print at least 1.5× the average volume of the prior five sessions, ideally 2×.
If any one of these is missing, downgrade the pattern to "watch only" and let it confirm before you commit risk.
Entry, Stop, and Target Rules
| Component | Rule |
|---|
| Trigger | Candle close above flat resistance on a higher-than-average-volume bar. |
| Aggressive entry | Half position on the breakout close; add the second half on a successful retest of the broken resistance as new support. |
| Conservative entry | Wait for the retest of the prior resistance to hold, then enter on the bounce. Lower fill rate but higher win rate. |
| Stop loss | Below the most recent higher low. If that stop is too wide, pass on the trade rather than under-stop it. |
| Profit target 1 | Measured move = height of the widest part of the triangle base, added to the breakout price. |
| Profit target 2 | Trail the stop under the rising 20-period moving average for an extended trend leg. |
| Time stop | If the breakout fails to follow through within three bars on intraday charts (or three sessions on daily), exit at break-even. |
Common Failure Modes (and How to Sidestep Them)
Most ascending triangle losses come from one of three problems. Knowing them in advance turns a bad pattern into a clear "no trade":
- The fakeout above resistance. Price pokes above the line on light volume, fails to hold, and reverses. Avoid by requiring a close above resistance, not just an intrabar tag, and by checking that volume confirms.
- The triangle is forming inside a downtrend. An ascending triangle that prints inside a broader bear trend has a lower hit rate. Use a trend filter such as price above the rising 50-period moving average before you take long signals.
- The apex squeeze. If the lower trendline meets the resistance without a clean break, the pattern has lost its tension. Stop watching it after price reaches the apex; a breakout from a fully compressed apex is statistically weaker than one that fires with room to run.
Practice the Ascending Triangle in the TradingSim Simulator
Pattern recognition is a skill you build through repetition, not a switch you flip after reading an article. Use the TradingSim day trading and futures simulator to drill ascending triangles on real historical tape:
- Sessions 1–3: Run the simulator on liquid mid-cap stocks or the e-mini S&P. Mark every ascending triangle you spot before the breakout. No trades yet — just labeling.
- Sessions 4–6: Add the entry rules. Take simulated positions only when the close-above-resistance and volume-confirmation conditions are both met. Log every trade in a journal.
- Sessions 7–10: Layer in the conservative retest entry. Compare your win rate, average winner, and average loser between the breakout-entry trades and the retest-entry trades. Pick the variant your psychology can sit through.
- Session 11+: Move to micro futures (MES, MNQ) on the futures simulator to practice the same pattern with futures-style risk units before risking live margin.
FAQ
Is an ascending triangle bullish or bearish?
An ascending triangle is bullish when it forms during an uptrend or sideways consolidation. The pattern signals that buyers are absorbing supply at the horizontal resistance and that a breakout is statistically more likely than a breakdown. It can occasionally appear at the bottom of a downtrend as a reversal pattern, but the win rate in that context is materially lower — treat it as a continuation pattern by default.
How do I confirm an ascending triangle breakout?
Wait for a candle to close above the flat resistance, not just wick through it. Confirm with above-average volume on the breakout bar — a 1.5×–2× spike versus the prior five-bar average is a healthy threshold. A successful retest of the broken resistance as new support is the strongest second-bar confirmation you can ask for.
What time frame is best for trading ascending triangles?
Daily and 4-hour charts produce the highest-conviction patterns because they incorporate more participants and clearer institutional behavior. 5-minute and 15-minute charts work well for intraday traders, especially on liquid futures contracts and high-volume stocks. Avoid 1-minute charts — the noise overwhelms the signal.
What is the measured move for an ascending triangle?
Measure the height of the widest part of the triangle (vertical distance from the first higher low to the horizontal resistance), then add that distance to the breakout price. That projection is the first profit target. Many traders take half profits at the measured move and trail the remainder beneath a rising moving average.
How is an ascending triangle different from a symmetrical triangle?
An ascending triangle has a flat horizontal resistance and a rising lower trendline, giving it a directional bias (bullish). A symmetrical triangle has both a falling resistance and a rising support, so it has no built-in directional bias — you trade it in the direction of the breakout instead of anticipating one. Ascending triangles tend to have higher continuation odds when they appear in an uptrend.
Schema


 Trading Strategies


