RUT Futures: How to Day Trade the Russell 2000 (RTY)
Oct 2, 2026
Written by: Al Hill
✓ Reviewed by Kunal Vakil, Co-Founder of TradingSim · Updated Oct 3, 2026
RUT Futures: How to Day Trade the Russell 2000 (RTY)
Every few weeks a reader asks me where to find a quote for RUT futures, and the answer always starts with a small correction. RUT is the index ticker, the Russell 2000 itself. The futures contract you would actually day trade carries a different code, RTY, and it lives at CME alongside its one-tenth-sized sibling, the Micro E-mini M2K. The confusion is harmless at the search bar and expensive at the order ticket, so this guide starts with the tickers, walks through the contract math that decides your risk, and finishes with the way I would rehearse small-cap index trading before putting a $50 multiplier behind an opinion. The timing is not bad either. The December contract has been the front month since the September roll, and this December brings something the Russell complex has never had before, which we will get to.
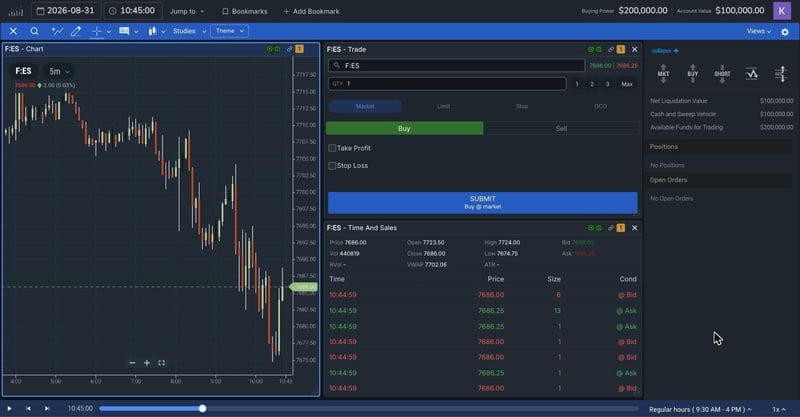
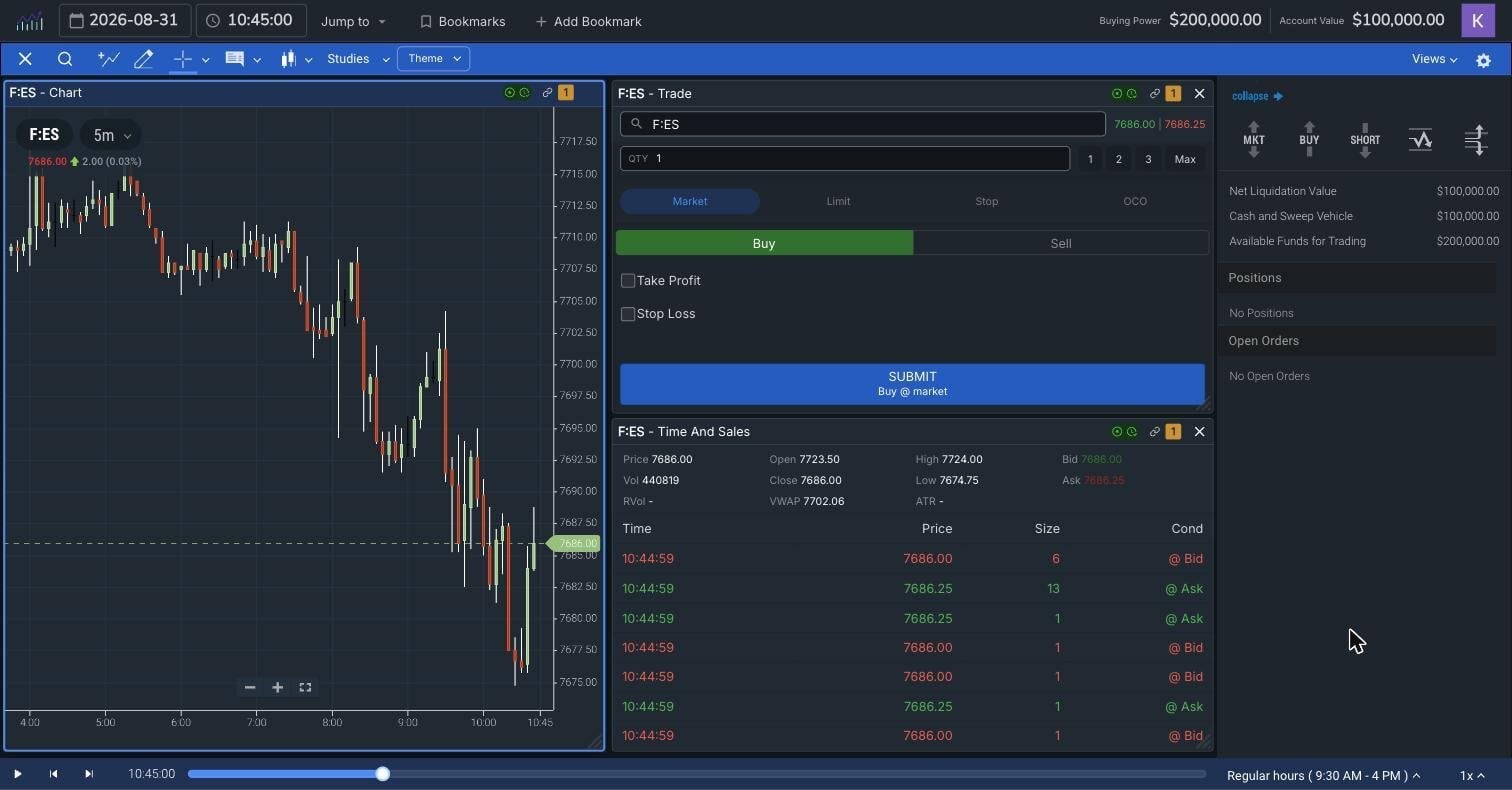
An index futures session replaying in TradingSim: the E-mini S&P 500 (F:ES) on August 31, 2026 at 10:45 a.m. ET, after a 7,723.50 open marked down to a 7,674.75 low, printing 7,686.00 below the 7,702.06 VWAP on 440,819 contracts. The workspace, the ticket, and the Time and Sales read exactly the same way whichever index future you are studying. Only the multiplier changes.
RUT is the ticker for the Russell 2000 index itself. The contract you actually day trade is RTY, CME's E-mini Russell 2000, worth $50 times the index and moving in 0.10-point ticks worth $5.00 each. Its one-tenth-sized sibling, the Micro E-mini M2K, is $5 times the index with a $0.50 tick. Both trade Sunday through Friday from 6:00 p.m. to 5:00 p.m. ET with a daily halt from 4:15 to 4:30 p.m., expire on the quarterly March, June, September, December cycle, and settle to the same Special Opening Quotation on the third Friday. Day trading RTY means trading roughly two thousand small caps at once, so breadth moves it more than any single name can. Start in M2K, denominate every stop in ticks before entry, and rehearse full sessions in replay before you put the $50 multiplier behind a live decision.
RUT, RTY, and M2K: Getting the Tickers Straight
The Russell 2000 measures the small-cap end of the US equity market, roughly two thousand of the smallest securities in the Russell family, selected by market cap and current membership according to FTSE Russell's own index page. Quote screens abbreviate the index as RUT, which is why so many people type "RUT futures" into a search box. At the exchange, the futures are the E-mini Russell 2000, code RTY, valued at $50 times the index. The minimum tick is 0.10 index points, and at a $50 multiplier each tick is worth $5.00, so a single point through your stop is $50 per contract. CME's Micro E-mini FAQ lists the micro version, M2K, at $5 times the index with the same 0.10-point tick worth $0.50, exactly one tenth of the E-mini across the board. The two are offset eligible against each other at a 10:1 ratio through your clearing firm, they share the quarterly March, June, September, December cycle, and both settle to the same Special Opening Quotation on the third Friday of the contract month. Same index, same calendar, two package sizes. If you have read my piece on micros versus minis for evaluation accounts, this table of relationships will feel familiar, because the Russell pair behaves exactly like the S&P and Nasdaq pairs.
The Session, the Roll, and a December First
RTY and M2K trade Sunday through Friday, 6:00 p.m. to 5:00 p.m. ET, with the daily trading halt from 4:15 to 4:30 p.m. That near-23-hour session matters for small caps because the index often gaps on overnight rate headlines, and the futures carry that repricing while the two thousand underlying stocks sit closed. The quarterly calendar runs on CME's customary schedule, published on its equity index roll date table: the September 2026 contract expired on September 18 after the September 14 roll, which is why December is the contract on your screen today, and the December contract rolls to March on December 14 ahead of a December 18 expiration. I covered why volume migrates on those Mondays in my piece on how futures contracts roll over, and the Russell complex follows the same custom as the rest of the equity index family.
Now the December first I promised. The Russell indexes have historically been rebuilt once a year in June, and reconstitution day is known for concentrating heavy small-cap volume into the closing auction. FTSE Russell's index pages state that from 2026 the reconstitution moves to a semi-annual schedule, adding a December rebuild to the June one. This December is the first of those. I am not going to pretend anyone knows exactly how a first-ever December reconstitution trades. What I know is that membership churn is the Russell 2000's signature event, the June versions have always concentrated enormous volume into the close, and a day trader who has never watched one should treat the week of it as a study assignment rather than a size-up opportunity.
How the Small-Cap Contract Trades Differently
The Russell 2000 is a breadth instrument. No single company dominates it the way a handful of megacaps dominate the Nasdaq-100, so RTY tends to move on the things that hit two thousand stocks at once: rate expectations, credit conditions, risk appetite for domestically focused businesses. In my years watching it, that shows up intraday in two habits worth respecting. First, RTY spends more of its life inside ranges than trend-day traders would like, grinding both sides of a balance while the large-cap indexes pick a direction. Second, when small caps do catch a rotation, the moves stretch further in index points than the headline percent suggests, and every one of those points is $50 on the E-mini. Those are observations from screen time, not statistics, and the honest way to test them is to pull up sessions yourself and count. The index explainer I wrote on forecasting with the Russell 2000 covers the macro side of why small caps lead or lag; this guide cares about what the futures do between 9:30 and 4:00.
Sizing RTY Without Blowing Up
Run the arithmetic before you ever place the trade. A routine 8-point stop on one RTY contract is $400. The identical chart read expressed in one M2K risks $40. If your account or your evaluation drawdown cannot absorb being wrong three or four times at $400 a try, the E-mini is not your contract yet, and there is no shame in that. The micro exists precisely so the stop can live where the chart says it belongs while the dollars stay survivable, an argument I made at length in the micro versus mini piece above and in my beginner guide to micro futures. Fees cut the other way, since ten micros usually cost more in round trips than one mini, but a day trader learning the Russell's personality should be nowhere near ten-lot micro size anyway. One M2K, a tick-denominated stop, and a journal beat any amount of bravado. If a funded-account evaluation is the goal, the same math is the difference between surviving week one and donating the fee, which is the whole premise of my 30-day replay plan for futures evaluations.
A Wyckoff Lens on the Small-Cap Tape
Because RTY ranges so much, the Wyckoff method maps onto it unusually well. Treat the overnight and opening balance as a potential accumulation or distribution structure, and let the phases tell you what the session is. A test of the overnight low that holds on shrinking spread, the spring, is the classic small-cap morning trap, and it is an early, phase C trade that belongs in one micro, not a mini. Confirmation comes the Wyckoff way: expanding range and effort in the breakout direction, a markup phase you can actually see in the five minute bars. When the index instead keeps absorbing every push at the same levels, that is your warning the day is a rotation day inside balance, and the trade is fading edges rather than chasing middles. The discipline the phase read enforces, small size early and full size only after the market proves its phase, is exactly the discipline the $50 multiplier demands.
Pick Your Timeframe Like You Mean It
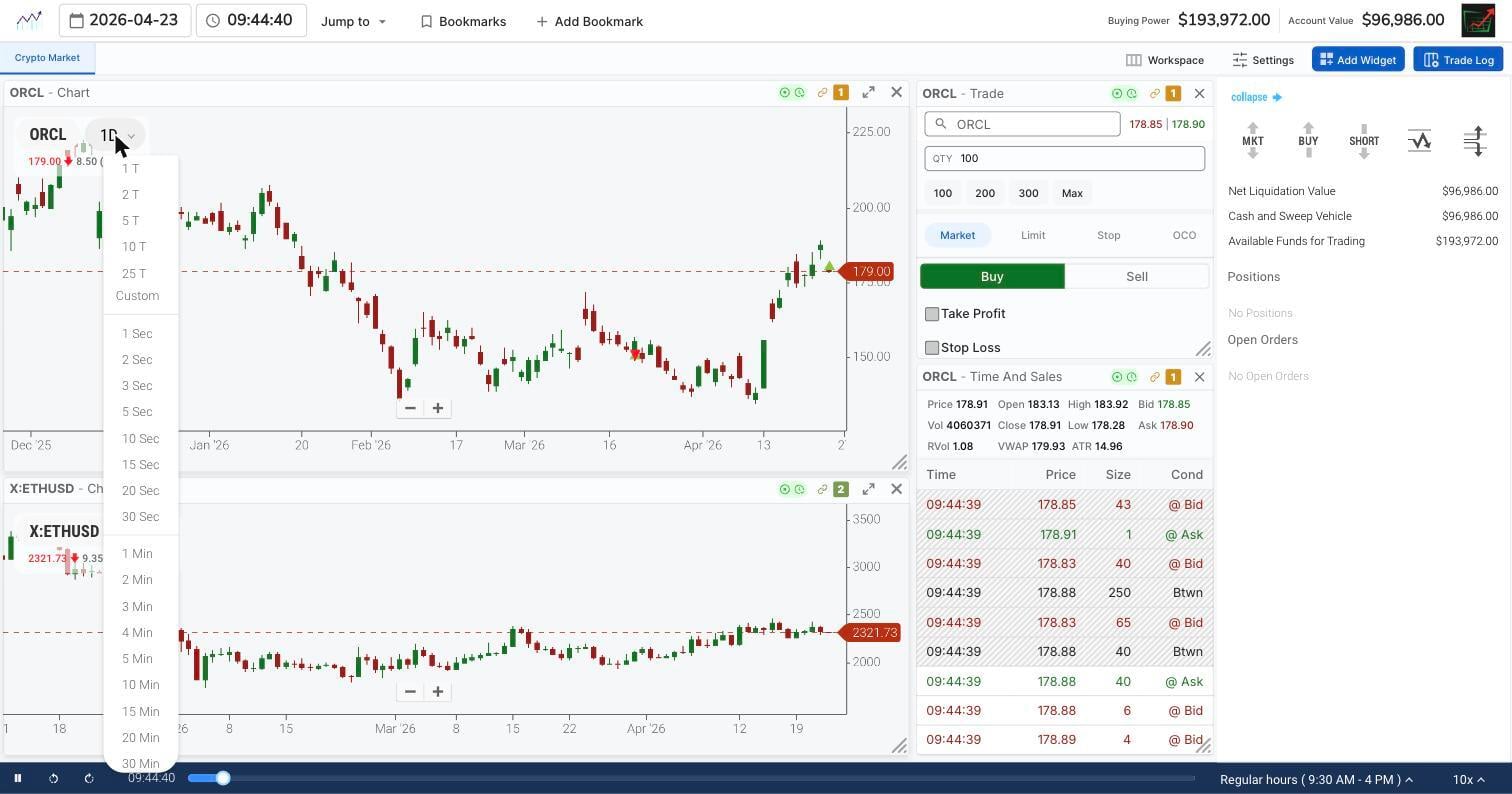
Small-cap index trading punishes indecision about timeframes. A five minute chart carries the session structure, but entries around a spring or an opening drive often need something faster, and this is where tick-based charts earn their keep, aggregating by trade count instead of by clock so the bars speed up exactly when the tape does. Decide before the open which pair you will run, one structure chart and one execution chart, and stop flipping intervals mid-trade.
The interval menu in a TradingSim replay of ORCL on April 23, 2026 at 9:44 a.m. ET, open from the daily chart's timeframe selector: tick options from 1T to 25T plus custom, then second and minute aggregations. The session stats beside it show ORCL after a 183.13 open with a 183.92 high, a 178.28 low, and 178.91 last against a 179.93 VWAP. The same selector drives every chart in the workspace, so you can pair a structure timeframe with a faster execution chart.
Rehearse the Russell in Replay
Nothing above requires live ammunition to learn. In a trading simulator built around full-session replay, you can load an index futures session, scrub to the open, and trade it bar by bar with a bracket ticket, take profit and stop attached at entry, while the Time and Sales prints the tape at whatever speed you can actually read. That is how I would meet this market: twenty replayed sessions in micro-sized risk, every stop written in ticks, every trade journaled against the phase you believed you were trading. Count how many of your sessions were range days versus trend days. Measure what an 8-point stop survives. The conclusions will be yours, drawn from the tape instead of from my adjectives, which is worth more. TradingSim replays equities and futures sessions, so the small-cap homework can run right alongside the large-cap comparison, and if you are still choosing where to do that work, the guide to futures trading simulators is the place to start.
Is RUT the Same as RTY?
No, and the distinction is worth one sentence of precision. RUT is the quote-screen ticker for the Russell 2000 index, a calculated value you cannot buy or sell directly. RTY is CME's E-mini Russell 2000 futures contract on that index, worth $50 per index point, and M2K is the $5 micro version. When someone says they trade RUT futures, they almost always mean RTY or M2K. Options traders muddy this further because index options do list under RUT, but in the futures market the Russell trades under RTY, on the quarterly cycle, settling to the index's Special Opening Quotation.
Should You Start With M2K or RTY?
Start with M2K unless your sizing math argues otherwise, and it rarely does for a newer trader. The micro is the same market at one tenth the dollars: same 0.10-point tick, same session, same settlement, offsettable against the E-mini at 10:1. An 8-point stop risking $40 instead of $400 means the same lesson costs one tenth as much tuition, and ten consecutive lessons still leave you solvent and curious. Graduate to RTY when your per-trade risk in micros has stayed small relative to your account across a real sample of trades, twenty or more, and the E-mini version of the same stop still fits your risk rule. The chart cannot tell which contract you are holding. Your account always can.
The Short Version
Search for RUT futures, trade RTY or M2K. Learn the $50 and $5 multipliers until the tick math is reflex, respect the near-23-hour session and the quarterly roll, and circle this December's first-ever second reconstitution as a watch-and-learn event. Then earn the right to the E-mini the boring way, one replayed session and one micro-sized decision at a time. The Russell will still be there when the arithmetic says you are ready.
Tags:
About the Author
Al Hill
Co-Founder & CEO, TradingSim
Alton Hill is the Co-Founder of TradingSim with over 18 years of trading experience. He completed the Design Thinking Bootcamp at Stanford’s D.School and brings expertise in Product Development to create the best trading simulation experience. His strategy focuses on trend-following systems, targeting high-volatility stocks with strong primary trends using the 15-minute chart.