The word capitulate means to give up or stop trying. It’s easy to see how this would apply to trading, especially during the kind of volatility that shows up in every market cycle. In times of market volatility and negative sentiment, traders often wait for a period of capitulation to signal a bottom for the markets.
Market capitulation comes after a prolonged period of selling which pushes both individual stocks and the broader markets down lower. If investors were not selling, we would see more of a stable price level from the stock. However, in a period of capitulation, a sharp rise in selling pressure signals that a large number of investors have sold and have surrendered their position to a loss.
Key Takeaways
Capitulation is the final phase of a sell-off where investors panic-sell at any price to escape losses, producing a volume-driven blow-off low that often marks a near-term market bottom. Contrarian traders watch for capitulation as a high-probability reversal signal — but only after confirmation, not during the panic.
- Volume spike: True capitulation prints volume at least 2× the 50-day average, often 3× or more.
- Price action: A long lower wick on the daily chart with a close near the high of the range signals seller exhaustion.
- VIX behavior: Capitulation typically aligns with a VIX spike above 35–40, followed by a sharp reversal.
- Sentiment: AAII bearish sentiment usually exceeds 50% at true capitulation lows.
- Time frame: Capitulation is a session-level event, not a multi-week process — the climactic selling typically resolves within 1–3 sessions.
Is capitulation bullish?
Market capitulation can be either bullish or bearish in nature depending on the current market environment. Oftentimes, traders will use capitulation periods to get bullish on some stocks that have fallen significantly in price. Traders will then enter or re-enter a stock at lower price levels to try and ride the stock back up.
This is a popular contrarian trading strategy that works especially well in bear markets as traders seek out oversold stocks to buy low in hopes of a bounce. So in a way, the end of a capitulation period can be seen as a time to start feeling bullish again, or at least looking for bullish trading strategies like reversal patterns, inverse head and shoulders, etc. Of course, markets can always go lower, but when selling is exhausted it usually indicates a near-term bounce for the markets.
What is a flush in trading?
A flush for a stock will typically come at the end of a long capitulation period of selling. The flush is the final move downwards where the stock will finally find a near-term bottom. Traders target a stock or market flush as an ideal time to hop in and buy, since these areas are generally where markets will bounce back higher.
A flush is often seen as one of the closest things to timing the exact bottom of a stock’s downtrend. When a stock or market has a flush, it might just be a signal that the period of capitulation is coming to an end.
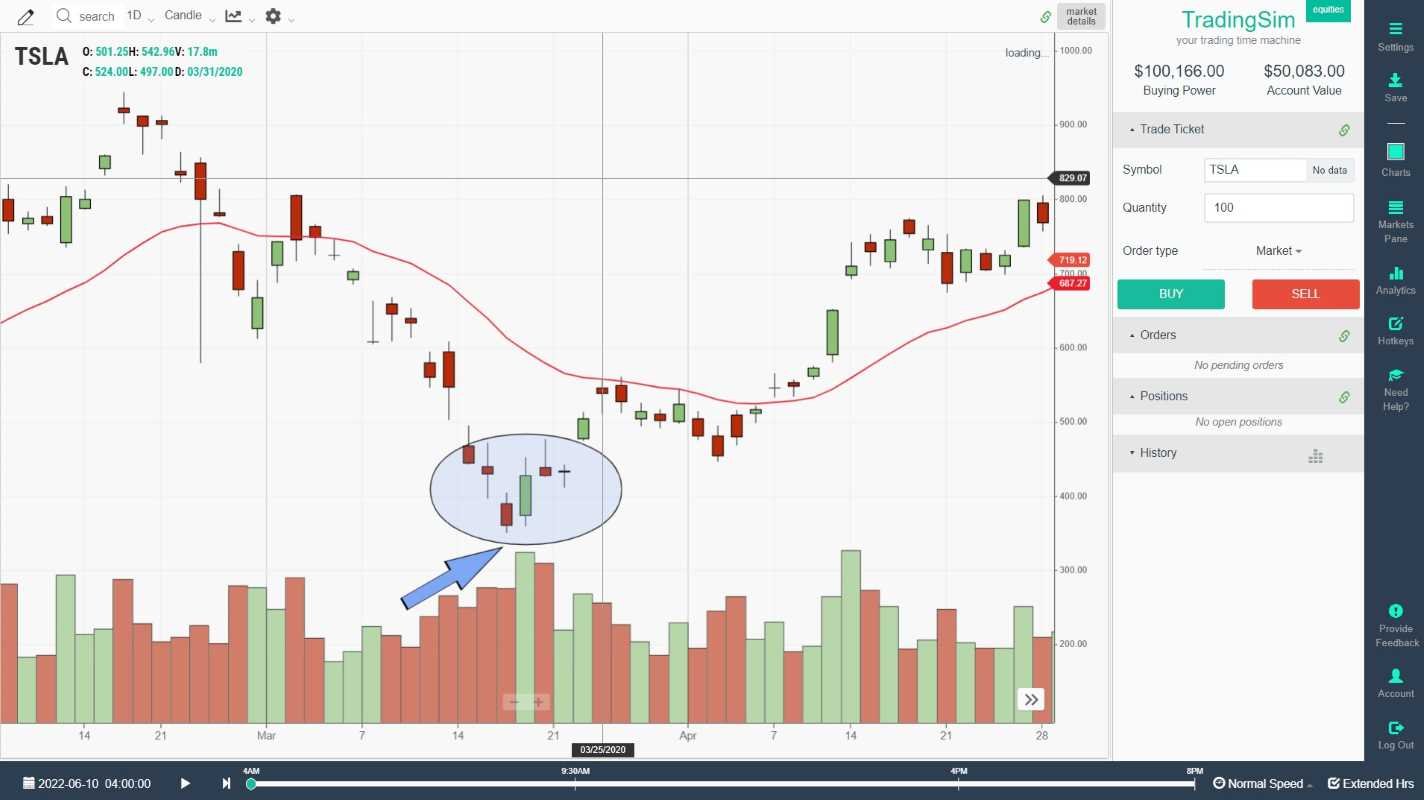
Who is buying when everyone is selling stock?
Contrarian traders are always on the lookout for market capitulation and market flushes. This strategy actually encapsulates two of the most famous investing quotes of all time: "buy low, sell high" and "be greedy when others are fearful." Being a contrarian often works well in efficient markets. If the entire market is acting bearish, then it might just be the perfect time to be bullish. Just be sure to wait for a good climactic signal or setup.
What is capitulation in crypto?
Capitulation in crypto is the same as with stocks and equities. In the crypto markets, capitulation can be more volatile since crypto assets trade 24 hours per day and seven days per week. Capitulation can send the crypto markets down in a hurry, particularly due to the amount of leverage that is used by crypto traders. Once capitulation gets some momentum, margin calls and liquidations will simply add to the snowball of crypto selling.
The crypto industry is filled with FUD or Fear Uncertainty and Doubt, as well as large emotional swings by traders due to the volatility. Once the negative sentiment of capitulation kicks in, it is difficult to reverse that trend. This is why the crypto market goes through prolonged periods of minimal price action called crypto winters. The last crypto winter lasted from January of 2018 to December of 2020.
Capitulation in Trading Summary
Capitulation means different things to different traders. The textbook definition of capitulation shows that traders have given up on the market and are selling their stocks at any price just to cut down on their losses. Capitulation is generally seen as the last leg down in a downtrend before a stock or market finds a bottom.
While it can serve as a stark reminder of how unforgiving the markets can be, it also provides contrarian traders with a window of opportunity. While everyone is selling their stocks, contrarian traders are looking to buy stocks at their lowest point. Although it isn’t a guarantee of a bottom, the end of the capitulation period is usually capped off with a flush, where a near-term bottom is then formed.
4 Signs of Market Capitulation (How to Spot a Real Panic Bottom)
Not every sharp drop is capitulation. Most pullbacks are ordinary profit-taking. True capitulation has a specific fingerprint that combines volume, volatility, and sentiment. Here are the four signals to look for before risking capital on a contrarian reversal trade.
1. Volume Climax (the most important signal)
Capitulation prints a volume spike 2–5× the 20-day average. This is forced selling: margin calls, mutual fund redemptions, and stop-losses cascading on top of each other. Without the volume spike, you are watching a normal pullback, not capitulation. Pull up relative volume (RVOL) to spot it in real time.
2. Wide-Range Reversal Candle
Look for a candlestick with a long lower wick that closes near or above the open — a hammer, dragonfly doji, or bullish engulfing. The close matters more than the low. Buyers stepped in, sellers were exhausted, and the daily range trapped late shorts. Review the doji and indecision candles guide for the exact patterns that print at capitulation lows.
3. VIX Spike Above 35–40
The VIX measures expected S&P 500 volatility. At capitulation, the VIX typically spikes above 35 and frequently breaches 40. The reversal signal is not the VIX peak itself — it is the next-day decline from that peak. If the VIX is making a fresh high while the S&P 500 is making a higher low, you are seeing bullish divergence. See shorting the VIX strategies for context on how this plays out.
4. Sentiment Extremes
The AAII Investor Sentiment Survey is the cleanest read. When bearish sentiment crosses 50% — especially when it stays above 50% for multiple weeks — it tends to coincide with major market lows. Add to that put/call ratios above 1.2 and CNN's Fear & Greed Index pinned at extreme fear, and you have a confluence of contrarian signals.
3 Historical Examples of Capitulation
October 2008 — Global Financial Crisis
The S&P 500 dropped 30% in eight weeks during the Lehman collapse. Capitulation arrived on October 10, 2008: the index opened at 902, traded down to 839, and reversed to close at 899. The VIX spiked to 76 — a record at the time. Volume on the SPY printed 870 million shares, nearly 4× its average. The market made a final low five months later in March 2009, but the October session was the volume climax.
March 2020 — COVID Crash
The fastest bear market in S&P 500 history bottomed on March 23, 2020. The VIX hit 82.69 (an all-time closing high), and SPY printed a wide-range reversal day on volume over 350 million shares. From that low, the S&P 500 rallied 70% in the following 12 months. Anyone who waited for confirmation — a higher low and a reclaim of the 10-day moving average — caught the move with manageable risk.
October 2022 — Inflation Bottom
The 2022 bear market produced a textbook capitulation on October 13, 2022. The S&P 500 gapped down on the September CPI print, traded down 2.4% intraday, then reversed to close up 2.6% — a 5% intraday swing. The VIX failed to make a new high while the index made a new low (bullish divergence). That session marked the cycle low; the index rallied 26% over the next 10 months.
How to Trade a Capitulation Bottom (Without Catching a Falling Knife)
The phrase “don’t catch a falling knife” exists because most attempts to bottom-pick fail. Here is a rule-based framework that filters out the noise:
Step 1: Wait for the climactic session. Do not buy during the sell-off. Wait for the wide-range reversal candle with the volume spike. The candle must close — intraday hopes do not count.
Step 2: Wait for a higher low. After the climactic candle, the market needs to retest. If it makes a higher low and holds, capitulation is confirmed. If it makes a lower low on weaker volume, the bottom is still in progress.
Step 3: Enter on the breakout. A reclaim of the 10-day or 20-day moving average on rising volume is the entry. Stop goes below the capitulation low. The reward-to-risk on these setups typically runs 3:1 or better because the panic low gives you a sharp, well-defined invalidation point.
Step 4: Size for the downside. Even confirmed capitulation can fail. Position size assuming the trade is wrong half the time. Test the framework in a futures trading simulator or replay platform before risking live capital — TradingSim replays the exact tick data of capitulation sessions like October 2008 and March 2020 so you can practice the timing.
Capitulation vs Correction vs Bear Market: Know the Difference
These terms get used interchangeably, but they describe different things.
A correction is a 10–20% decline from the highs — routine, happens roughly once a year, and usually resolves without capitulation. A bear market is a 20%+ decline that typically lasts 9–18 months. Capitulation is an event that can occur during a bear market — the single session where the selling exhausts itself. A bear market without capitulation often produces a slow, grinding bottom (think 2000–2002). A bear market with capitulation produces a sharper V-shaped recovery (think March 2020).
The framework matters because it changes your trade management. In a slow-bleed bear market, you scale in. After a capitulation event, you can take a more concentrated position because the risk is well-defined.
Frequently Asked Questions
What does capitulate mean in trading?
To capitulate in trading means to give up on a position and sell at any price to escape losses. Market capitulation is the climactic phase of a downtrend where panic selling produces a volume spike, a wide-range reversal candle, and a VIX spike. It often marks a near-term bottom.
Is capitulation bullish or bearish?
Capitulation is structurally bullish for forward returns because it signals seller exhaustion. However, you do not buy during the panic — you wait for confirmation: a wide-range reversal candle on high volume, followed by a higher low. Trying to catch the falling knife is what makes capitulation feel bearish to most traders.
How do you identify capitulation in the market?
Look for four signals: (1) volume 2–5× the 20-day average, (2) a wide-range reversal candle that closes near the high of the day, (3) a VIX spike above 35–40, and (4) AAII bearish sentiment above 50%. When all four align in a single session, you are likely watching capitulation.
What is a flush in trading?
A flush is the final climactic drop at the end of a capitulation period. It is the move that takes out the last weak hands and stops out the holdouts. Flushes often print on high volume and close back inside the prior range, leaving a long lower wick. Traders watch for flushes as setups for contrarian long entries.
Who is buying when everyone is selling?
Contrarian traders, value investors, and systematic strategies that buy mean-reversion signals. Institutional buyers with cash on hand step in at capitulation lows because forced sellers create dislocations that pay above-average returns over the next 6–12 months. The famous quote applies: be greedy when others are fearful — but wait for confirmation first.
Capitulation vs. the Slow Bleed
The reason traders lose money trying to buy capitulation is that they mistake a slow bleed for a flush. They look similar on a monthly chart and behave nothing alike.
Real capitulation is loud and compressed. It shows up as a vertical drop on enormous volume, often inside a single session or two, with a wide-range bar that closes well off its low. The selling is indiscriminate — quality names get dumped alongside the junk, because people are selling what they can, not what they want to. Then it stops, because the sellers are actually finished.
A slow bleed has none of that. Volume is unremarkable or declining, each down day looks like the last, and there is no single bar you can point to and say “that was the panic.” Nobody has capitulated because nobody has been forced to. There is no exhaustion, so there is no bounce — just lower lows, patiently, for months.
The tell is volume, and it is the whole game. If you cannot find a volume spike, you have not found capitulation, and what looks like a bottom is more likely a dead cat bounce waiting to happen. Checking relative volume against the stock’s own average is a faster read than eyeballing the volume bars.
What Changed in This August 2026 Update
This guide is reviewed on a rolling schedule so the mechanics, numbers, and links stay accurate. Here is what was verified or added in the August 2026 review:
- Removed a stale 2022 time reference from the opening that no longer described the current market.
- Re-verified every internal and outbound link on the page.
- Added a section on the difference between capitulation and a slow bleed, which is where most bottom-callers get hurt.
- Refreshed structured data with a current dateModified.
Related Trading Resources
Continue your trading education with these related guides from TradingSim:








 Chart Patterns