VIX Futures Overview
VIX futures, short for volatility index is one of the most popular derivatives instruments listed on the Chicago Board Options Exchange (CBOE).
The VIX futures are also known as the CBOE Volatility Index futures or VX for short.
The contracts are tied to the forward 30-day implied volatility of the S&P500 index in real-time.
How Do CBOE VIX Futures Work?
SPX options forecast the volatility between the current day and the expiration date of the contract. The estimates are implied based on how much buyers are willing to pay.
To go much deeper into the calculation, read this article from CBOE.
To put it generally, when the market dips, investors, fearful of losing equity purchase SPX PUT options. This results in higher premiums for SPX PUT options, which leads to a spike in the VIX index.
The chart below displays the E-mini S&P 500 futures and the CBOE VIX index. Is there anything that jumps out at you?
Could it be the high readings coinciding with market bottoms?
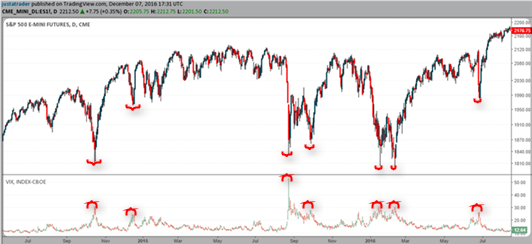
VIX Index and market bottoms in the S&P500 market
VIX Futures Contract Specifications
Settlement
Unlike other commodity contracts, there is no physical settlement for the VIX. The final settlement date is 30 days before the third Friday of the following month. Generally, VIX futures contracts expire on Wednesday with the last trading day falling on a Tuesday.
Ticker
The ticker symbol for the VIX futures is VX, with some brokers using other tickers such as VIX or VI.
Contract and tick size
There is a total of nine serial contract months available at any point.
Each VIX futures contract is 1000 units. In other words, the contract multiplier is 1000 of the respective forward VIX index value.
The minimum tick size is 0.05 VIX points or equivalent to $50.
| Ticker |
VX |
| Contract Months |
Monthly |
| Multiplier |
1000 |
| Min. Tick |
0.05 |
| Tick Value |
$50 |
VIX Futures Contract Summary
VIX Trading Session
The regular session is from 5:00 pm (previous day) to 8:30 AM and 3:30 to 4:00 PM. There is a small break from 3:15 PM to 3:30 PM and from 4:00 PM to 5:00 PM.
The trading week starts on Sunday at 5:00 PM, so if you are holding any positions over the weekend, you will want to check-in before Monday morning.
To learn more about the trading timeframes for both futures and options, check out the CBOE site.
How to Trade VIX Futures Contracts
First, the VIX index oscillates within a range.
Therefore there are no long-term bull markets to ride like the S&P 500 index. Lastly, due to the volatile nature of the VIX index, being caught on the wrong side of a trade can cost you dearly.
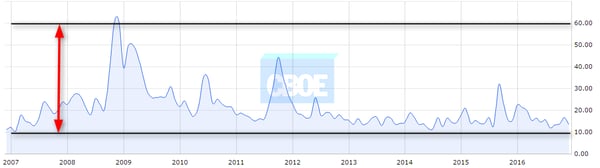
VIX Futures Range 60 – 10 (10-year chart) Source CBOE
The above chart shows a 10-year price history for the VIX futures. You can see that the index oscillates between 60, reached in late 2008 and bottoms out near 10.
Below are a few trading strategies worth testing with VIX futures.
5 VIX Futures Trading Strategies
#1 – Mean Reversion
Mean reversion states when the price rises sharply, price tends to pull back to the mean.
First, wait for volatility to spike.
Bear in mind that the VIX tends to spike on a daily basis. If these spikes do not coincide with a market low or steep selloff, you should filter out these signals.
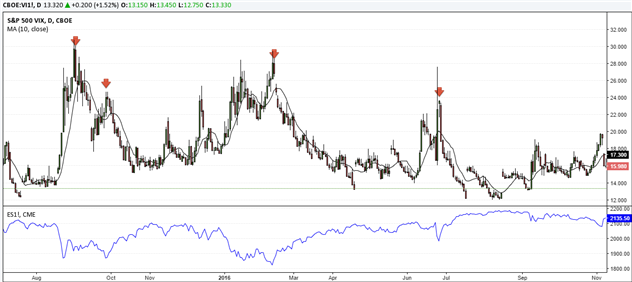
Trading VIX futures based on mean reversion
The chart above shows a few instances of trading setups where the spike in the VIX index coincides with a bottom in the S&P500 futures. Using this as a confirmation, traders can then look to go short on the VIX targeting the 10-period EMA as the mean.
#2 – Trading based on the VIX/ES chart
A unique approach to trading the VIX is to use a ratio chart of the VIX and the ES futures contracts. You do this by waiting for the ratio to generate a cross of two moving averages, as shown below.
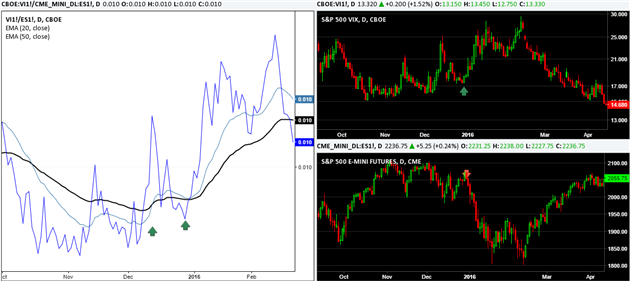
Trading VIX futures based on the VIX ES ratio
Here you can see that the main ratio chart on the left shows a buy signal on the VIX/ES as the moving average crosses up.
Again, you will need to develop further rules to rule out signals as trading every crossover is a sure way to run up commission costs and trading losses.
#3 – The VIX Index and VIX Futures Divergence
In this trading method, you look for divergences between the CBOE Volatility index, VIX and the VIX futures.
The chart below shows the VIX index on the top and the VIX futures chart on the lower half. The areas marked by the red line connecting the highs shows areas of price divergence.
Following this sort of divergence, the VIX futures will often break one way or the other. Its your job to assess the divergence and take a long or short position accordingly.
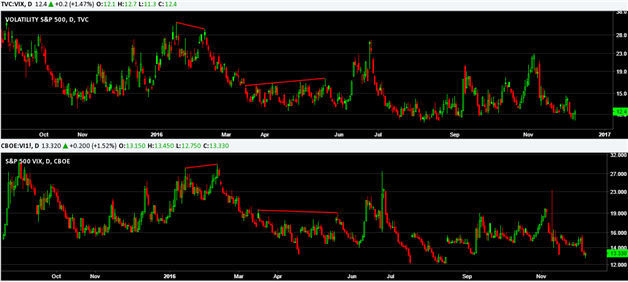
VIX index and VIX futures divergence
#4 – VIX Contango and Backwardation
Contango and backwardation are two aspects that govern futures markets regardless of the underlying asset.
Contango in VIX futures is where the price of the current month futures is lower than the price of the far-out VIX futures contracts. This simply denotes the fact that investors expect volatility to rise in the future.
Backwardation in VIX futures is where the front-month contract prices are higher than further out contract month prices. It is widely accepted that backwardation often results in a bearish move with the S&P500 in the near term.
Contango and Backwardation can also be compared between the spot and the current month VIX contracts. When the spot VIX closes higher than the current month VIX contracts, it signals backwardation. This closely ties into the previous method of VIX divergence that is described.
#5 – Analyzing S&P500 Markets
Another simple approach to trading the VIX futures is to analyze the S&P500 market itself or the E-mini S&P500 futures. In this approach, the futures trader can conduct a long term analysis of the S&P500 market and wait for the price to reach a specified/identified support level. When this coincides with a peak in the VIX futures, it can serve as a confirmation to go short on the VIX futures.
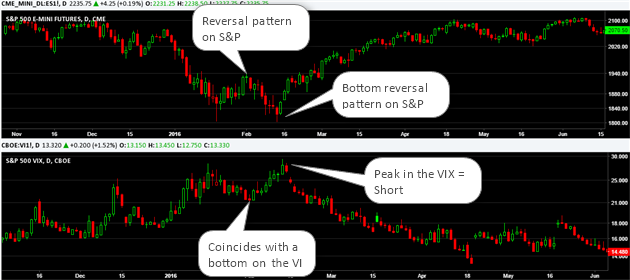
VIX and ES Markets analysis
The above chart shows the ES markets on the top and VIX futures below.
How Can Tradingsim Help?
The above methods merely outline some of the ways traders can employ techniques to trade VIX futures.
To explore additional strategies, check out Tradingsim.com. We provide access to a futures replay trading platform that allows you to trade the most liquid futures contracts on the global exchanges.
VIX Futures FAQs
What is the difference between the VIX index and VIX futures?
The VIX index is a real-time calculation of the market's expected 30-day volatility based on S&P 500 options pricing, but it isn't directly tradable. VIX futures are the tradable derivative contracts tied to where the market expects the VIX to settle on a future date, which is why futures prices often diverge from the spot VIX index.
Can you day trade VIX futures?
Yes. VIX futures trade nearly around the clock on the CBOE Futures Exchange, and many day traders use them to hedge equity exposure or speculate on volatility spikes. Because the contracts can move sharply during market stress, it helps to practice execution on a futures trading simulator before risking real capital.
Why do VIX futures often trade differently than the VIX index?
This gap is explained by contango and backwardation, discussed above. In contango, longer-dated VIX futures trade above the spot index because traders expect volatility to rise; in backwardation, near-term contracts trade above longer-dated ones, which historically has coincided with sharp bearish moves in the S&P 500.
What moves the price of VIX futures?
VIX futures respond to shifts in expected S&P 500 volatility, which is driven by macro events, earnings season, Fed policy decisions, and sudden risk-off selling. Traders often cross-reference VIX futures with candlestick patterns on the underlying index to time entries.
Is trading VIX futures riskier than trading equities?
VIX futures can be significantly more volatile than typical equity positions because the underlying index itself measures volatility. Position sizing, understanding margin requirements, and reviewing your trading psychology around fast-moving markets are especially important before trading VIX futures live.
Related TradingSim Resources







 Commodity Futures