This article is going to discuss a very simple, yet powerful day trading strategy that is used to capitalize off the greed and fear from novice traders. I refer to this setup as the “three bar reversal and go” strategy; it can be described as a stock that has recently made new intraday highs and then abruptly stages a pullback in the form of three to five bars on light volume. I look for a reversal bar on the final bar of the pullback and use that as the trigger bar. Once the high of the trigger bar is penetrated, a long entry can be established.

Three Bar Reversal and Go Strategy
Now, there are a few rules I use to identify the most powerful day trading setups. Firstly, you want to look at the volume on the pullback bars. They should be lighter than the preceding up bars. Second, the trigger bar should be a reversal bar that opens lower and closes near the high of the bar. You can see some common candlestick charting reversal patterns as a guide. Third, keep an eye on the “tape”, or the time and sales window; you want to make sure that the breakout above the trigger bar has some conviction behind it. This day trading setup can be used on any time frame chart; however, I like to use it on five minute charts.
Psychology
The psychology of this setup takes advantage of newbies, or novice traders. First, breakout buyers will step in when they see fresh highs being set for the trading session. These new buyers will immediately see the stock reverse on them and consider the breakout to be a false signal. As the stock continues lower, these traders will become fearful and sell out for a loss, only to have more experienced traders step up and buy into that fear. More experienced traders, using the rules outlined above, will understand that the stock is still bullish and step in when the fear is at its peak.
The setup is pretty easy to trade from a risk management perspective. I will stop this trade out below the low of the trigger bar. The reward to risk ratio on this trade is very much in your favor. Look for the previous highs of the day to exit at least half, if not all, of the position.
Example

Three bar reversal and go example
Trading the Three-Bar Reversal Pattern on U.S. Tech Giants
As we all know, the United States tech giants – Apple, Facebook and Google are some of the most highly traded equities over the past decade in the world.
No matter where you call home, you are likely a client of at least one of these companies.
For this reason, the U.S. tech giants are perfect candidates for the three bar reversal pattern because of their high liquidity.
Again, the secret of the success for this chart pattern is the fearful psychology of newbie traders.
Let’s now see how a three bar reversal pattern strategy works on Apple:
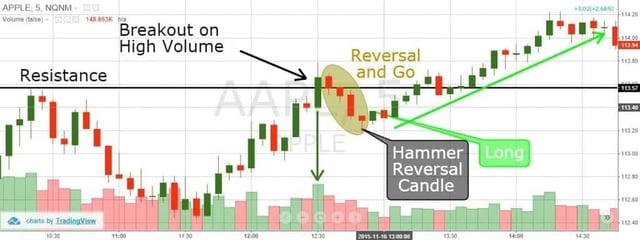
AAPL Reversal and Go
This is the 5-minute chart of Apple Inc. from Nov 16, 2015. The black horizontal line marks a resistance level at $113.57. At 12:30 pm, this resistance level was breached on higher than average trading volume.
This is when newbie traders go long, which actually isn’t that bad of a trade.
Then suddenly we get 4 bearish candles in a row! At that point, the newbie traders abandon the trade with a loss, believing the bullish breakout on Apple is a fake out – wrong!
As I stated in the beginning of this article, the three bar reversal pattern can consist of 3 to 5 bearish candles. In this case, there are 4 candlesticks. Do you remember the next requirement? The last candle should have some sort of a reversal, where the closing price is near the open. Sure enough, a hammer develops which is a reversal candlestick pattern.
Now we know that the 4 bearish candles are more likely to be a correction of the bullish trend rather than a new bearish trend. At this point, newbie traders exit their positions, at which point we go long after the next candle closes above the hammer.
We then watch as AAPL begins an impulsive move higher for more than 2 hours – for a total gain of 85 cents per share.
Let’s now go through another three bar reversal up pattern, but this time on the Google stock chart:
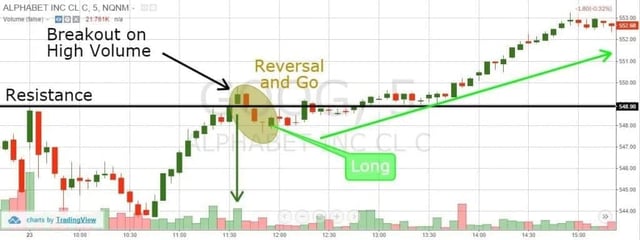
GOOG Reversal and Go
This is the 5-minute chart of Alphabet Inc (Google), showing the price move from May 23, 2014. The chart image starts with a top, which we mark with a resistance line at $548.90.
Price eventually breaches this resistance line with high volume. Then price begins to decrease with light volume, highlighted in the brown circle by three bearish candles.
Notice that the last candle is a dragonfly Doji. This candle has a strong reversal characteristic and we need it to confirm our three-bar reversal system strategy. The next candle is bullish and it surpasses the high of the Doji.
We go long after the bullish bar reversal, at which point the price starts increasing and once again clears resistance.
At this point, we could close part of our long position, which is an optional approach depending on the risk management style of your trading system. If we close a portion of our position, we will have a guaranteed profit out of this trade. However, the further gains from the remaining position would be smaller.
So, what are we to do?
For me, I would say clear a portion of your position as no one has ever gone broke taking money out of the market.
The price keeps increasing and Google reaches $553.58 per share. This day trading reversal pattern allowed us to ride Google for a profit of $5.18 per share.
Let’s now review the bullish bar reversal pattern with the maximum number of bearish candles – 5!
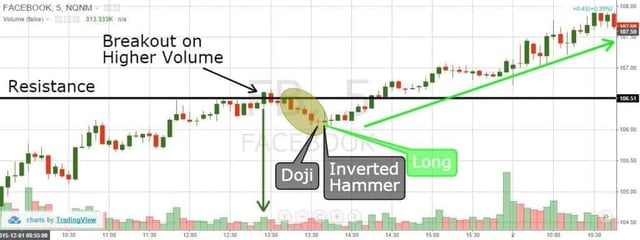
FB Reversal and Go
For this example of the trade, we are going to review the 5-minute Facebook chart from December 1, 2015.
The black line represents the resistance level at the $106.51 level. This level was tested twice and the price backed off both times from resistance. As you can see in the chart, the price approached for a third attempt.
This third test was slightly different, as the volume accompanied the move.
As in our previous examples, after the test with higher volume, price began to decrease and a number of bearish candles developed. This is where newbie traders lose confidence and exit the trade while the stock is pulling back on light volume.
This lack of understanding of market mechanics is a great trading opportunity for us.
After the fifth candlestick develops into a Doji, this confirms a reversal could be in play. We go long Facebook on the next candle, which closes above the Doji. Furthermore, the next candle after the Doji is an inverted hammer, which also has a further reversal characteristic. This gives us another bullish signal, making us even more certain in our long position.
Facebook doesn’t stop there and the price ultimately reaches $107.92, at which point we close our position.
Notice that this time, the three-bar reversal came a bit later after the break. This is normal and we should not disregard the pattern and its potential. In stock trading, sometimes patterns need time to develop.
Now that we have covered the 3, 4 and 5 candlestick formation of three bar reversal pattern, let’s now discuss the reality of false signals.
False Signals – Three-Bar Reversal and Go
You might be asking yourself, “How is it possible that such a sure signal as the three bar reversal pattern could trap me in a losing trade?”
I would like to ensure you that anything is possible in the stock market and there are no guarantees.
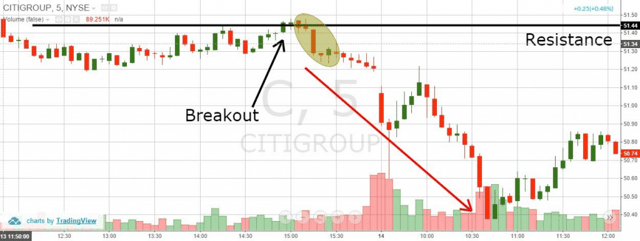
C Reversal and Go
This is the 5-minute chart of Citigroup showing the price move in the middle of October 2015. We have a resistance level at $51.44, marking the top from 2:15 PM. The next price increase closes a candle above the resistance, creating our breakout.
Suddenly, contrary to the bullish breakout, a price decrease appears in the form of four bearish candles. The last one is a small hammer, where the close of the candle is near its high. This indicates that the pattern is possibly a reversal and go. The next candle is bullish and it closes above the hammer, signaling that we should take a long position with Citigroup. This is where the false signal appears. As you see, the following events and subsequent trading action the next day were heavily bearish.
The Citigroup stock slumps $0.90 (90 cents), reaching a 10-day low of $50.37. If we had taken a long position, the results would have been devastating to our bankroll.
Let’s review another example:
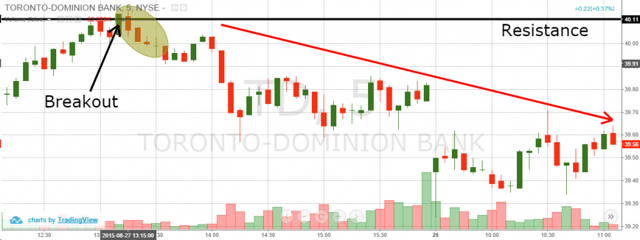
TD Reversal and Go
This is the 5-minute chart of Toronto-Dominion Bank showing the price behavior on Aug 27, 2015.
We have a clear resistance level at $40.11. The black arrow shows the bullish breakout through resistance indicating that a new bullish activity might be on its way. The next three candles are bearish and they create our three bar reversal and go pattern. The next candle after the pattern is a doji.
After a short hesitation, TD Bank price has a minor increase and then rolls over.
This is when we have to ask ourselves, “Is there any way to be protect ourselves from these losing trades?”
Yes, and that my friend is what we mentioned earlier in this article – stop-loss orders.
Stop-Loss Orders – Three-Bar Reversal Patterns
The easiest way to spot potential stop levels on the three-bar reversal pattern is to identify the last candle’s low. If your reversal and go pattern is 4 bearish candles, you place the stop under the lower wick of the fourth candle. If it consists of 5 candles, you place the stop under the lower wick of the fifth candle.
Let’s see how stop-loss orders would have worked on the two losers mentioned earlier in the article.
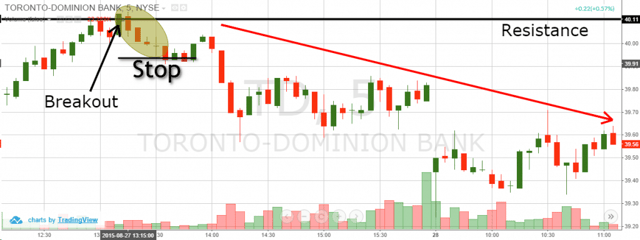
TD Reversal and Go – Stop Loss Order
This is the TD Bank trade, but this time we place a stop-loss order below the wick of the Doji candlestick. In this case, the stop-loss order would have been triggered with the next candle. This means that the loss would have been limited to only $0.05 (5 cents) per share and we would have avoided the big price decrease of $0.80 (80 cents) per share – thus protecting our bankroll.
Let’s now see how stop loss would have worked with the Citigroup trade.
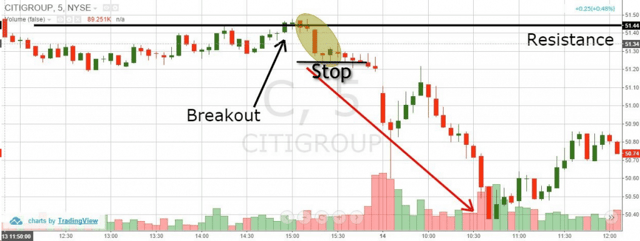
C Reversal and Go – Stop Loss Order
Although the candle after the reversal and go pattern is bullish, it still hits our stop below the small hammer. Again, we exit the trade, which protects us from the upcoming decrease.
Our stop results in a loss of only $0.08 (8 cents) per share instead of experiencing the $0.90 (90 cents) drop illustrated earlier in the article.
Notice that in both cases our stops are very tight. The reason for this is that the stops are right below the previous candle. This way, in both cases we lose only 8 cents and 5 cents respectively. At the same time, the three successful patterns I presented brought big profits of $0.85, $5.18, and $1.78 per share. In all the cases this is around 1.00% of the share value, while our stop-loss orders kept our losses to 0.02% and 0.01%.
In other words, you are risking roughly about 0.02% of the stock price to gain about 1.00%. This is about 1:50 risk-to-return ratio – an extremely high result.
If you approach trading with these sort of odds, you are in good shape.
Conclusion
- The three Bar Reversal & Go pattern consists of 3 to 5 bearish candles after a bullish breakout.
- This chart pattern also gives false signals.
- The best way to handle losing trades when trading three-bar reversals is to place a stop loss below the last candle of the pattern.


 Candlesticks


