The Head and Shoulders Pattern: How to Trade Tops and Bottoms
Feb 24, 2022
Written by: Al Hill
✓ Reviewed by Kunal Vakil, Co-Founder of TradingSim · Updated Mar 31, 2026
The Head and shoulders pattern is a reversal trading strategy, which can develop at the end of bullish or bearish trends. It is often referred to as an inverted head and shoulders pattern in downtrends, or simply the head and shoulders stock pattern in uptrends. In theory, they foretell the slowing momentum in either direction as the stock is unable to put in further highs or lows.
Traders like to trade head and shoulders patterns as the price targets are very predictable and the formation has an overall high success rate.
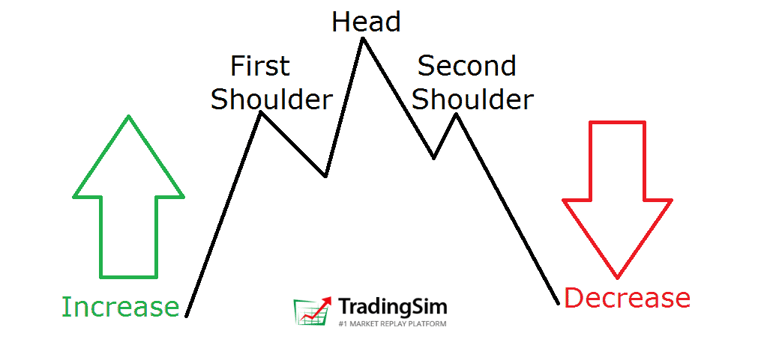
The head and shoulders chart formation consists of three peaks, which develops after a strong bullish trend. The first and last peak are approximately the same height and are classified as the shoulders.
The second peak is the highest of the three and is classified as the head of the pattern.
Head and shoulders charts represent the transfer of power from the bulls to the bears in a topping pattern. In essence, it is a distribution pattern. Bulls who were buying the breakout (head), provided the liquidity for larger players to sell into, thus bringing the stock back down.
Please see the below illustration of a head and shoulders pattern top:
Head and Shoulders Top
What Do Inverse Head and Shoulders Chart Patterns Look Like?
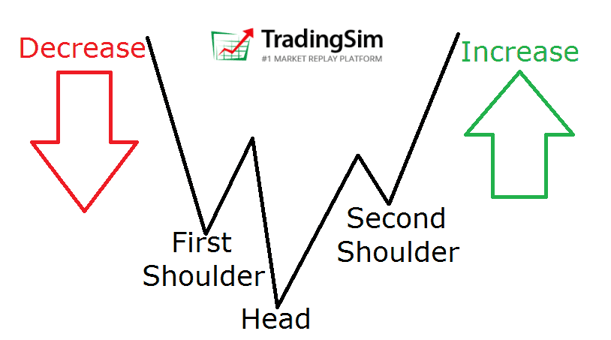
Conversely, the inverted head and shoulders pattern is the head and shoulders bottom.
Instead of peaks, there are troughs. This reversal pattern develops after an extensive bearish trend and represents the transfer of control from bears to the bulls. Like the topping pattern, here bulls are using the breakdown as an opportunity to go long at lower prices. It could also give longer term bears the liquidity to cover their positions.
Below is an illustration of a head and shoulders bottom:
Head and Shoulders Bottom
This is an outline of the inverse head and shoulders pattern. As you see, it is the mirror image of the head and shoulders topping pattern.
Identifying the Neckline in a Head and Shoulders Pattern
Every technical chart pattern has a trigger line, which provides confirmation for entering or exiting a trade.
For the head and shoulders pattern, the trade signal is called the neckline.
When you think about it, this name makes sense, because the neckline is directly beneath the head and shoulders. Get it?
When we identify the pattern on the chart, the first thing we should do is to draw the neckline.
So, how do we draw the neckline?
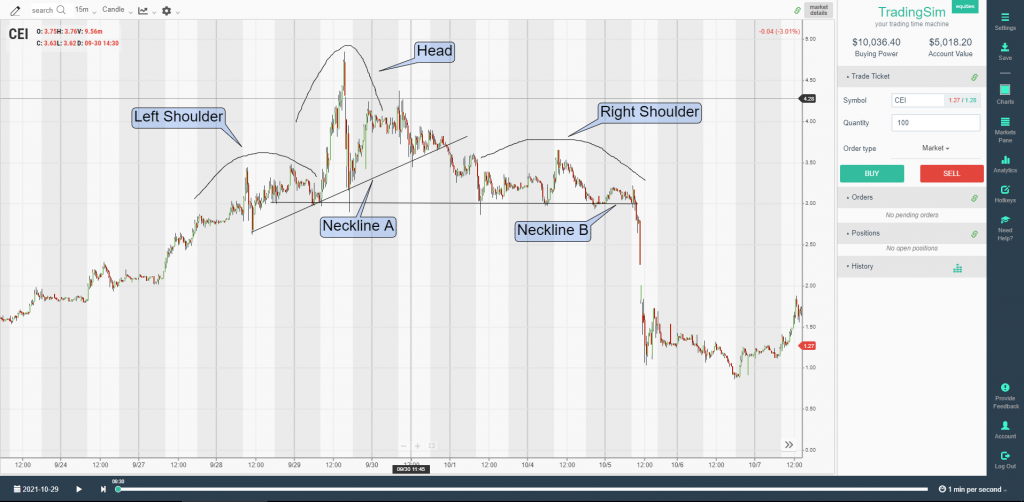
The proper way to set up your neckline is to connect the two peaks or troughs (depending on if it’s a top or bottom). Here’s an example with $CEI:
$CEI head and shoulders pattern example
Please note the neckline isn’t always flat. If the peak or trough values are slightly different, then the neckline could have a slope.
We’ve tried to give you two examples of an early entry “Neckline A” and a later “Neckline B”. Both would work. It will depend on you and your style to outcome test head and shoulders chart patterns for the best entry.
What do Head and Shoulders Stock Patterns Foretell?
To determine the size of the formation, you should first set up the neckline as we just discussed.
Then, you take the mid-point of the neckline and draw a vertical line connecting the mid-point of the neckline to the top of the head. The distance between the neckline mid-point and the head is the distance we expect the stock to run after breaking through the neckline.
Please note, measuring price targets for head and shoulders and inverted head and shoulders will mirror each other. Again, the only difference is the formations are inverted.
How to Trade a Head and Shoulders Chart
When should you open a position?
When you identify the formation, you should start looking for the signal you need in order to enter the market. This signal is the moment when the price breaks through the neckline, for all intents and purposes.
When the neckline is broken, you should open a short position for head and shoulders tops and a long position for head and shoulders bottoms.
Granted, this is the old-school way to trade the pattern. Educators like Gil Morales teaches you to short into the pops on the right shoulder. He likes to find weaknesses into the overhead moving averages for good risk/reward.
This is a tricky question as traders’ opinions are pretty controversial regarding stop loss placement for the pattern.
Some traders claim that the stop loss should be loose and placed just above the head of the pattern.
A more conservative approach used by traders is to place the stop loss beyond the shoulder peak/trough.
We prefer placing the stop loss above the shoulder, as placing the stop above the head provides a 1:1 risk reward ratio. This isn’t very favorable odds.
When should you collect profits – Reverse Head and Shoulders Pattern Example 1
Again, the rule of thumb for this pattern is to determine the price target based on the depth of the pattern.
If this sounds confusing to you, have a look at the image below:
Price Target
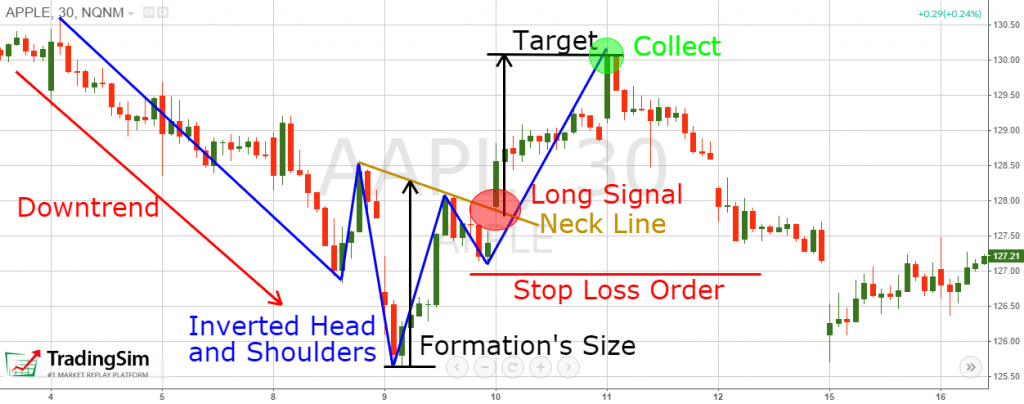
This is a classic inverted head and shoulders scenario. This is the 30-minute chart of Apple. First, we have a bearish market followed by the creation of an inverted head and shoulders formation.
You can see the neckline – the brown line. Once the neckline is broken to the upside, we were able to set our price target based on the depth of the neckline to the trough of the head, which is represented with the black arrow.
After we establish our long position, we place our stop loss below the last shoulder as shown in the image.
After 24 hours, our minimum target is reached and we exit the position after the first bearish candle circled in green.
This inverted head and shoulders formation brings us a profit of $2.20 per share with the Apple equity.
While we exited this position near the target, you should not exit your position if the price continues to move in your favor.
Reverse Head and Shoulders Target Example 2
Having fun? Let’s go through another example.
Price Target
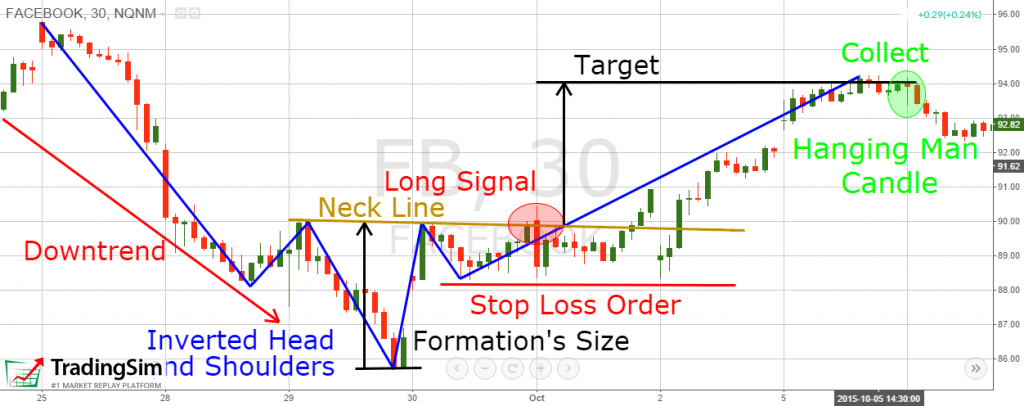
This is the 30-minute chart of Facebook.
After a strong downtrend, an reverse head and shoulders pattern develops. Again, we identify the neckline by drawing a brown line across the shoulders.
We open a long position with the first candle that closes above the brown neckline. Meanwhile, we establish our minimum target, which is illustrated with the black arrow.
After a few days, the price reaches our minimum target, but we stay with our long position until our bearish signal develops. For more information on bearish candlestick patterns as entry and exit signals, visit our guide to candlesticks.
A few hours later, a hanging man develops and we close our long position. From this long position, we were able to generate profits of ~ $4.00 per share.
When does the Head and Shoulders Pattern Fail
Although head and shoulders are considered one of the most reliable chart patterns for equity trading, like any other chart technique – it can fail.
Sometimes, we will receive our confirmation signal and the price does not reach our minimum target.
In other cases, the price will confirm the formation by breaking the neckline, and we will see absolutely no movement in our favor. These cases are not rare at all.
Pattern Failure
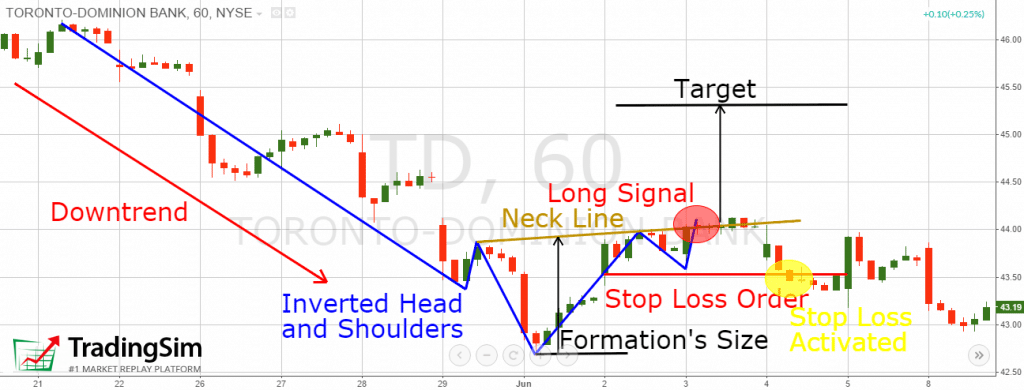
This is the 60-minute chart of Toronto-Dominion Bank. After a steady downtrend, an inverted head and shoulders formation develops.
We establish the neckline, price target, and stop loss, which are best practices for identifying the formation.
Unfortunately, after opening a long position, TD Bank begins to retreat below the neckline and ultimately trips our stop-loss order.
From this position, we accumulated a loss of ~52 cents ($0.52) per share. Although all the symptoms of an effective pattern are there, things didn’t work out.
This is why it is important to respect your stops!
The first thing to consider when day trading this pattern is that it requires time. Unless you are on sub-minute charts or tick charts, you will likely need two days worth of bars or an early afternoon set up for the formation to fully develop.
Like any other trading setup, you will need more than just the chart pattern to be a success. Some of these items include proper money management and a firm understanding of risk on each trade.
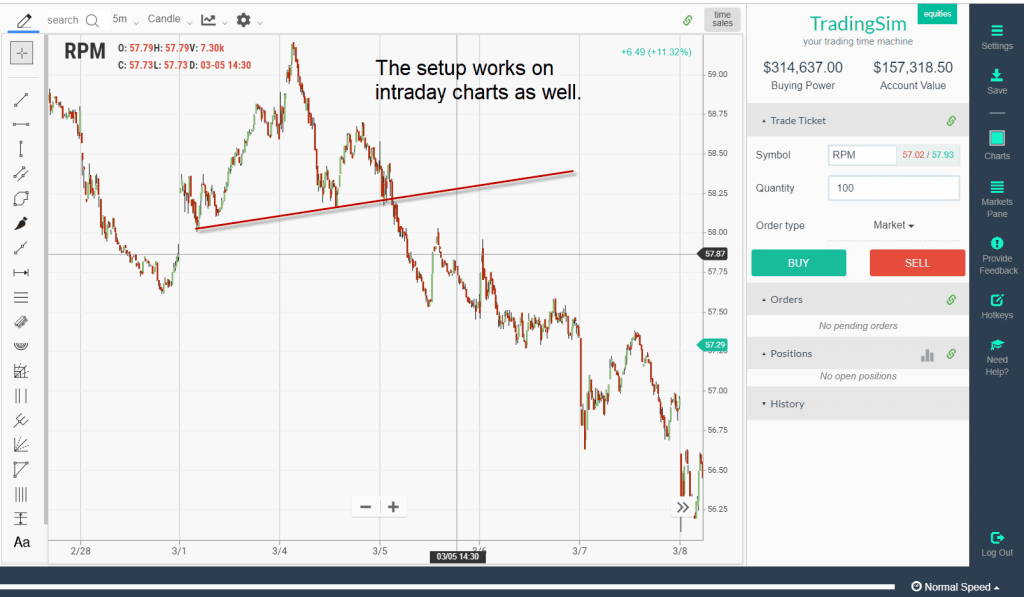
Back to an intraday example, check out this head and shoulders chart of RPM.
Intraday Chart Example
You can see the setup is the same as all the other charts previously discussed, even though the chart is on a 5-minute time frame.
The key point, again, is that you will need to let the trade setup. It’s not like an opening range breakout with 4 or 6 candles after a major gap. It takes time.
This pattern requires you to let the trade come to you, which takes extreme patience. The positive is that the reward from the trade is significant because the “cause” built up before the move creates a large “effect,” typically. There are many traders on both sides of the trade placing real money on the line.
The key is, after the break of the neckline, managing the trade properly. This means placing your stop above the recent peak or trough point. Also, it means adding to the position as it goes in your favor, all while managing a core position.
Key Summary Points on Head and Shoulders Chart Patterns
Head and shoulders tops and bottoms are reversal chart patterns.
It is one of the most reliable technical formations.
Inverted head and shoulders can reverse a bearish trend to bullish.
You will need to identify the formation, neckline, and stop loss levels.
Open a position when the price breaks through the neckline.
Advanced/Early entries can be taken on pops into the moving averages on the right shoulder
Place a stop loss order on the edge of the last shoulder.
The price target for the formation is equal to the depth of the neckline to the head of the formation.
When the price target is met, stay with the position until a contrary signal develops.
The pattern can fail, so don’t get too sure of yourself.
Use a global news source to understand the financial impacts outside of your market which can impact the trade.
How Can TradingSim Help
As with any strategy, we never recommend putting your money to work without testing the setup first. Ideally, you’ll want a set of as many simulated trades as possible in order to know your probability for success.
In other words, don’t take our word for it. Jump in the sim, scan for reversals both long and short, and track them in the analytics page. This way, you’ll know ahead of time what your realistic outcome expectancy can be.
Along the way, be sure to study which areas provide the best points of entry for your specific head and shoulders pattern strategy.
Alton Hill is the Co-Founder of TradingSim with over 18 years of trading experience. He completed the Design Thinking Bootcamp at Stanford’s D.School and brings expertise in Product Development to create the best trading simulation experience. His strategy focuses on trend-following systems, targeting high-volatility stocks with strong primary trends using the 15-minute chart.
What is the Kicker Candlestick Pattern? The kicker formation is a reversal pattern that starts with a candle in the direction of the primary trend, followed by a gap contrary to the trend. Talk about...
Don’t you just love the word “best” as it applies to anything in life? Well, wait until we walk through the best day trading chart patterns, and you will see that sometimes the use of this adjective...
Three White Soldiers: 3 Things You Must Consider Before Trading
The Three White Soldiers pattern is a popular bullish candlestick pattern. It is fairly easy for most traders to spot in real time given the 3 large range successive candles. Moreover, in the right...


 Candlesticks


