Bull flag trading patterns are one of many patterns that traders study in the markets. Trading patterns are a way to simplify the markets and condense information into repeatable, visual formations. These formations become the framework for statistical edges in the market.
In this article, we're going to dive into the fine details of the bull flag patterns. We'll explain what a bull flag is, many of the subtle nuances in this pattern, and how to best trade the bull flag.
What is a bull flag?
A bull flag is a bullish stock chart pattern that resembles a flag, visually. The pattern occurs in an uptrend wherein a stock pauses for a time, pulls back to some degree, and then resumes the uptrend.
A bull flag must have orderly characteristics to be considered a bull flag. There must be a series of lower highs and lower lows within the bull flag consolidation. A lower volume signature should accompany the price action within the flag.
After a period of consolidation, the flag must resume the upward trend in order to be considered a bullish flag pattern. Otherwise, the pattern fails, which we'll discuss later in the post. This resumption should be accompanied by the presence of renewed volume (demand).
What does a bull flag indicate?
A bull flag means that there is a pause, albeit brief, in the upward momentum of a stock's move to higher prices. It indicates that the stock might be in a temporary overbought condition, which will likely bring in some early selling pressure in a young bull run.
However, once the stock has had a chance to pull back and consolidate, the bull flag should produce a breakout, allowing the stock to resume its prior momentum. This means that sellers were still far fewer than buyers. In other words, there are more traders willing to buy the flag than sell it.
A bull flag also indicates that demand is stronger than supply. The "flag pole," or initial uptrend, should be strong in demand. This demand then supports the ensuing pullback (flag). Once early bears realize the strength in the overall move, they give up their early shorting efforts.

What does a bull flag look like?
A bull flag looks like a typical flag pattern, with a strong flag pole, then a brief downward consolidation, followed by a resumed uptrend. It should appear similar to this diagram:
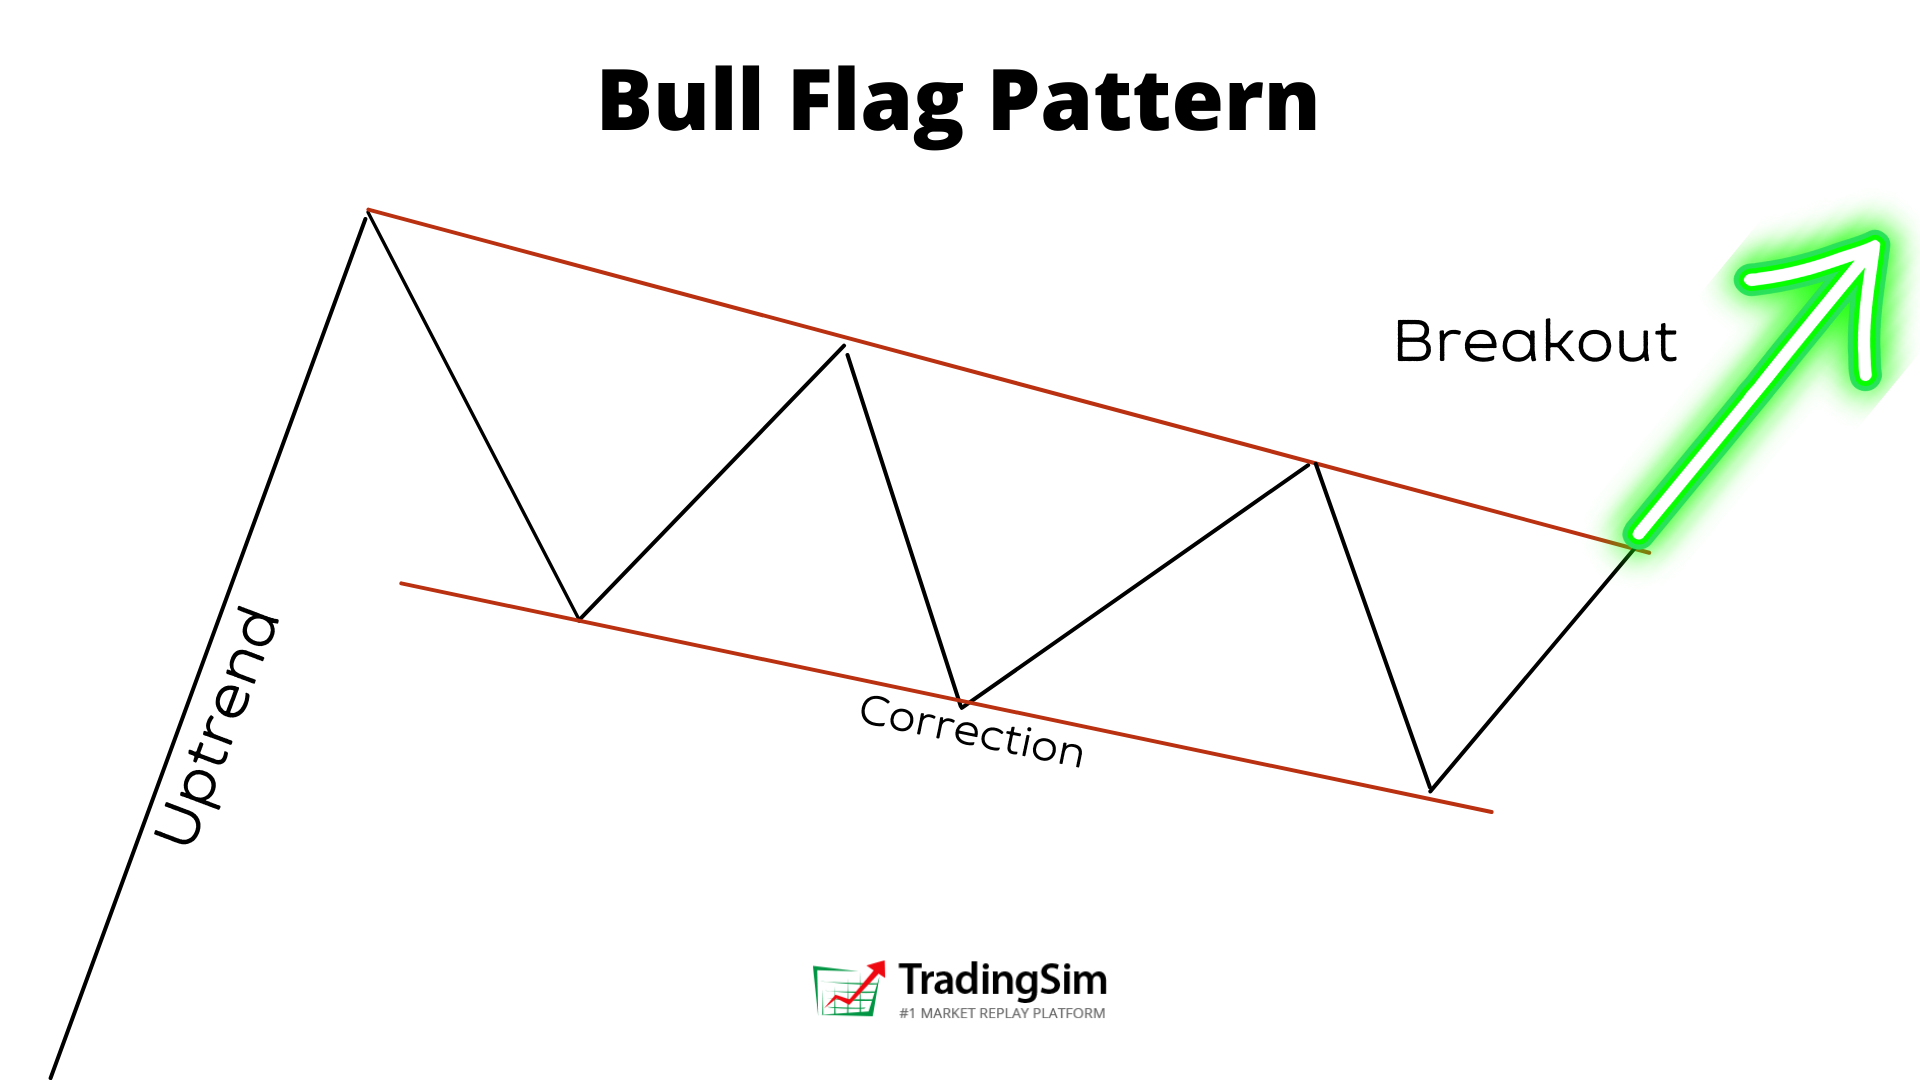
You should notice that the uptrend should be rather sharp and accompanied by strong volume. Into the pullback, you'll want to see a series of lower highs and lower lows.
However, once volume recedes into the pullback, the bull flag will overcome the selling pressure and break this counter-trend consolidation.
Bull flag candle pattern
Bull flags can occur on any time frame. The best way to view them is using a candlestick chart. With candles, you'll notice that a bull flag is usually generated with very large green candles, then a series of red candles that pull back, and then another large green candle that creates the breakout pattern.
Notice in this example of symbol AMC, you see a perfect bull flag formation on the 30-minute chart.
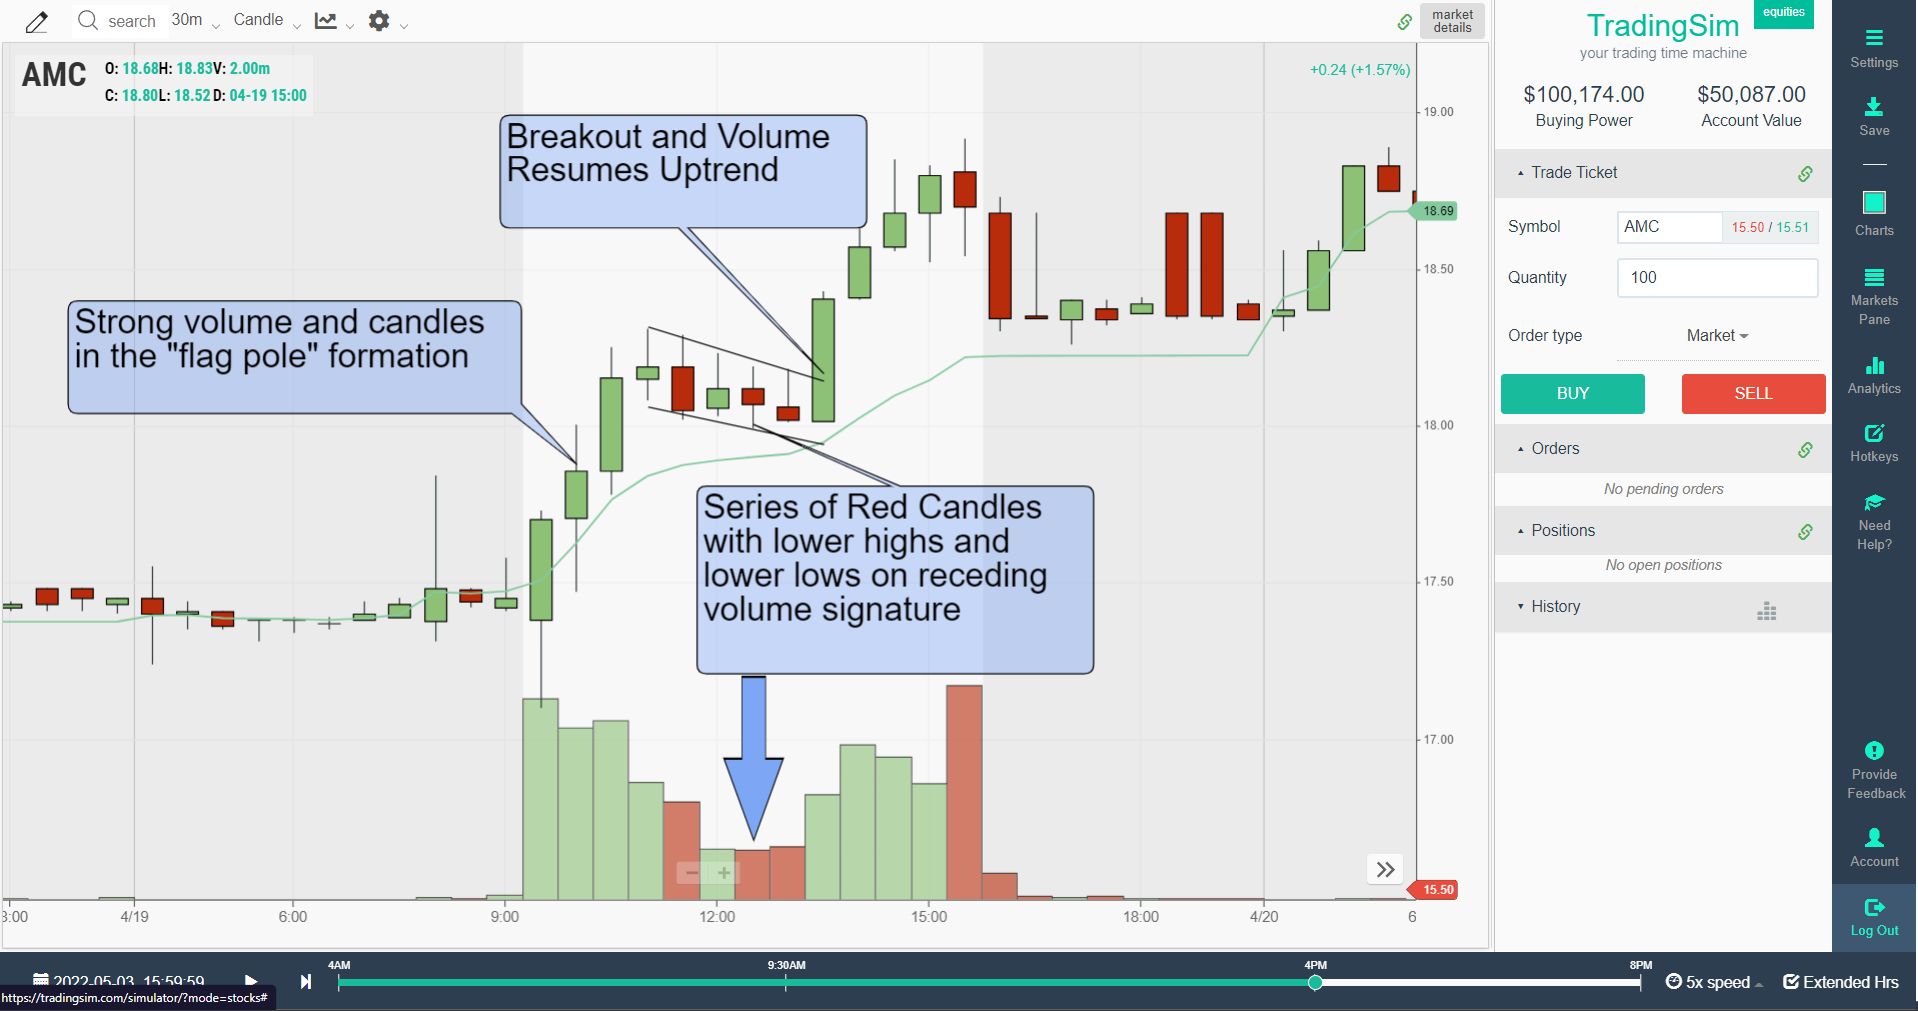
The volume and demand are there for the flag pole to form. This is noticeable on the chart and the big green candles. Then, during the flag formation, we get the pullback on lower volume and tighter range red candles. Lastly, the trend resumes as volume/demand returns and price breaks to a new 30-minute candle high.
How reliable are bull flags?
Generally speaking, a bull flag pattern is very reliable depending on the context of the stock you are trading. The later the run and the more consolidations you have, the less likely a bull flag is to perform well. The stock could be getting tired.
For example, the best bull flags occur at the start of a new uptrend. Stocks usually operate in waves and swings. So, the earlier you are in a bull run or momentum swing, the better your bull flag should perform.
Another scenario that fuels bull flags are short squeezes. If you can identify key levels on a chart where shorts could be underwater, then see a bull flag form, it could be indicative of a coming squeeze. These typically work really well. We discuss this strategy in detail in our post on liquidity traps.
Lastly, be sure to analyze volume to determine the reliability of your bull flags. If volume expansion returns well on a stock, it should lead to higher prices. This is somewhat discretionary, but you don't want to see a weak breakout on low volume. The best bull flags have big volume expansion.
Bull flag vs bear flag
What is the difference between a bull flag and a bear flag? The bear flag is a countertrend consolidation in a downtrend. The bull flag is a countertrend consolidation in an uptrend. They are essentially mirror images of each other.
Here is what these might look like, side by side:
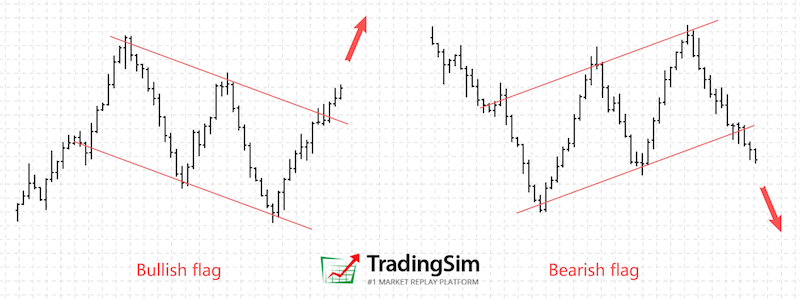
As you can see from the image above, the context is everything when comparing a bull flag to a bear flag. That being said, they are both very similar and should be treated almost identically, just in different trending contexts.
A bear flag should resume the downtrend in a stock's price markdown. The consolidation should look the same, however. In other words, the rally in a bear flag should be higher highs and lows with lower volume -- a weak rally. This should then breakout downwardly.
For a more detailed tutorial on bear flags, be sure to check out our tutorial here.
Difference between bull flag and pennant
A bull flag and a pennant can both resolve in the upward direction. However, a pennant is different in that it is usually a 50/50 scenario. It could go down, or it could go up.
A pennant is a symmetrical triangle that is formed in a horizontal consolidation pattern. As the pennant narrows into its apex, it can be difficult to determine which direction it will resolve. A bull flag doesn't typically form an apex, nor is it completely symmetrical. A bull flag will most often have a downward trajectory instead of a horizontal and level consolidation.
Nonetheless, for a pennant pattern to be bullish, you want it to have similar characteristics to a bull flag with regard to volume. The only real difference is that the pattern will be creating higher lows and lower highs into the apex.
Here is what it should look like in this AMC example:
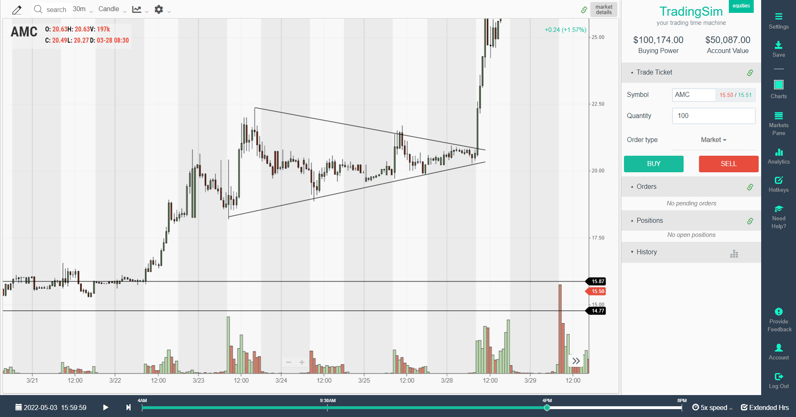
Notice the difference between the bull flag example above and this pennant example. Both look bullish, but the structure of the pattern is slightly different.
How to trade the bull flag pattern
In order to trade the bull flag pattern, you need to take into consideration the context of the stock, the trend, the volume, and the entry criteria. We've outlined these for you here:
- Identify a new strong uptrend on high volume.
- Wait for the stock to consolidate and pull back into the first uptrend.
- Analyze the volume in the pullback, it should be considerably lower.
- Watch for any support at a significant moving average.
- Buy the break of the first candle to make a new high above a prior candle.
- Add on a breakout to the high of the day if volume expands.
- Set your stop at the low of the most recent candle.
- Measure the move and set targets for exits.
This sounds very simple, but it takes a trained eye to really see the quality of the bull flag. As a breakout strategy, you want to make sure that you respect your stops and analyze the price and volume well. Similarly, you want to make sure you are trading off of the correct time frame for the context of the move.
If you are scalping early morning momentum, you might want to trade from the 1-minute charts. Later in the morning, you might see a better formation on the 5-minute chart. Or, like our AMC example, you might see a clean setup on the 30-minute chart.

Bull flag breakout
A bull flag breakout is the best way to trade the bull flag pattern. After a stock has an initial bull run, then consolidates on lower volume, you expect the initial demand to return and force a new breakout in the stock.
Let's examine the AMC example above with a little more detail. First, let's examine the bigger picture trade idea in the simulator. Notice how on this 30-minute chart, AMC has been mostly range-bound for a few days, bouncing between support and resistance.
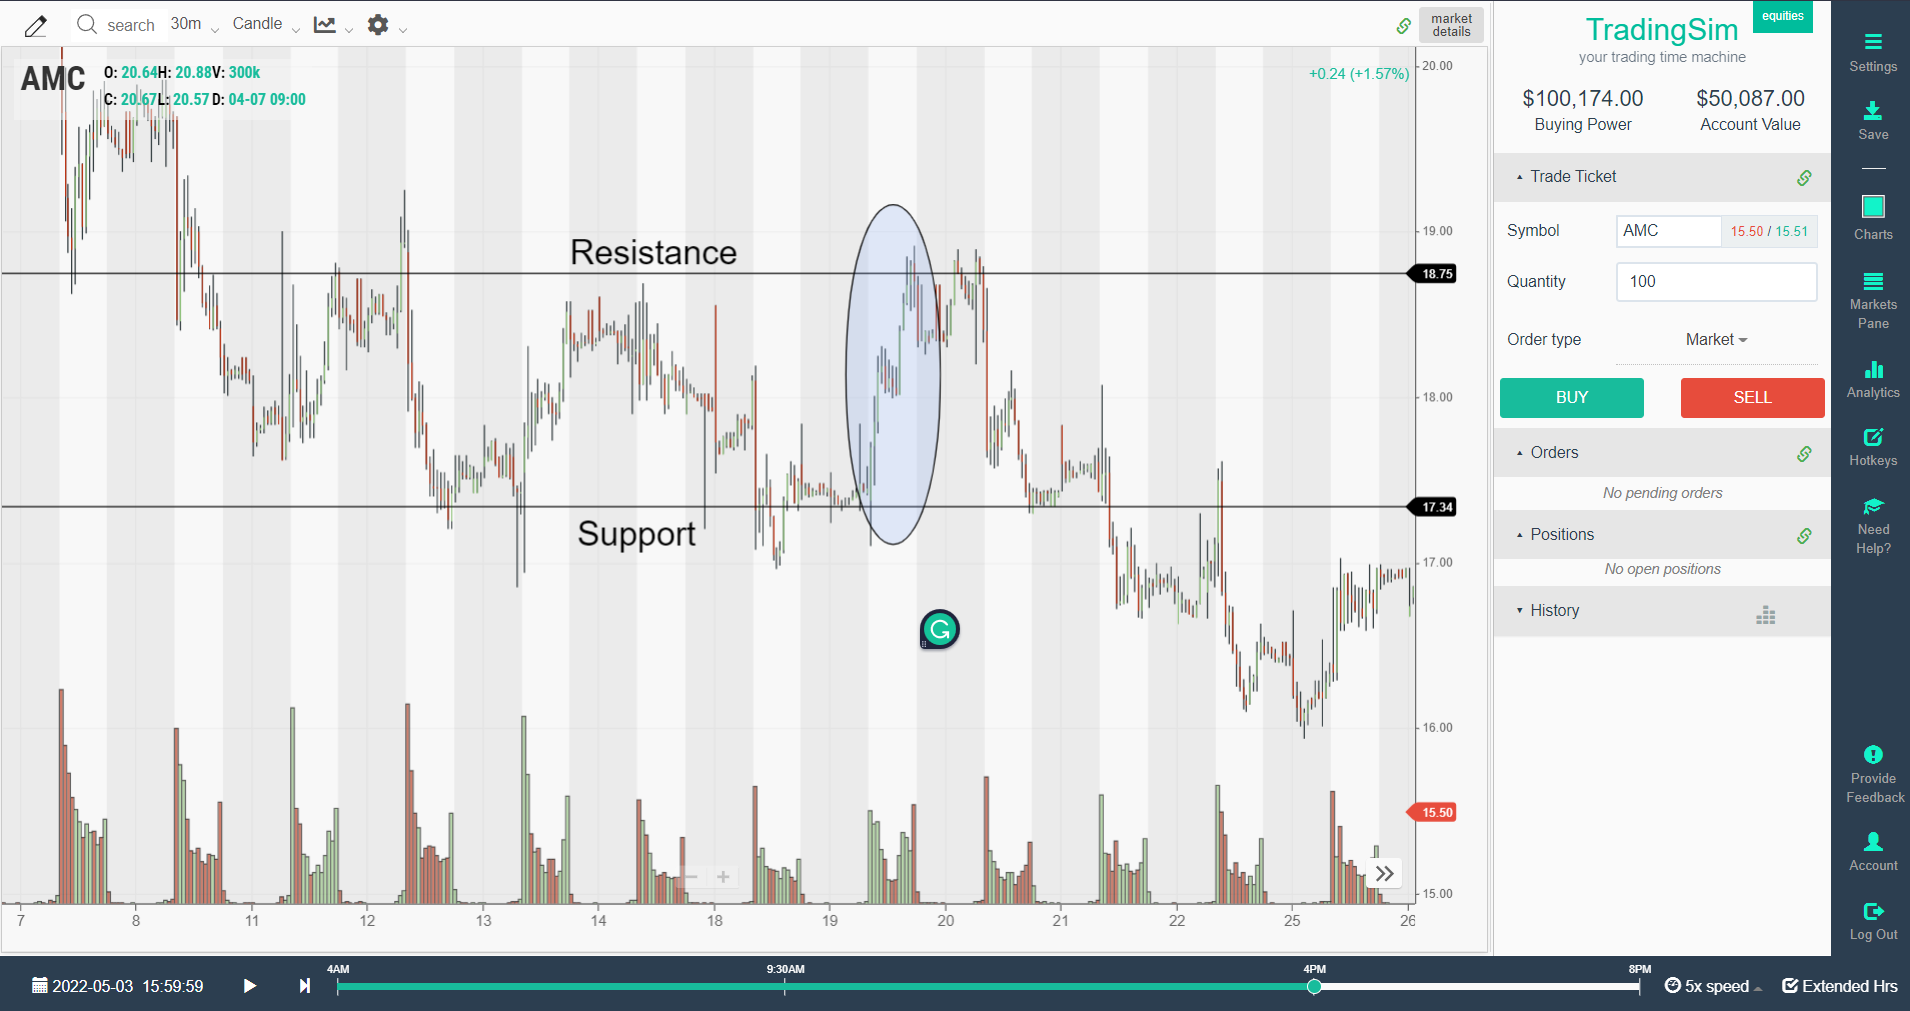
Now, inside this trading range we've drawn, you'll see the "current" day we are wanting to trade inside the blue oval. Within that range, a bull flag begins to form mid-day, right at the middle of the trading range.
If we are astute traders who understand support and resistance, we could have gauged the quality of the bull flag as a small consolidation along the way to the resistance area above. This would give us confidence, not only that the move might not be finished, but also as to where our target could be set.
Where to buy bull flag
The optimal place to buy a bull flag breakout is once the trend begins to shift once again in the desired direction. You'll buy the break of the prior candle's high. In this 30-minute chart example, you can see that the first candle to make a new high inside the bull flag becomes the breakout candle.
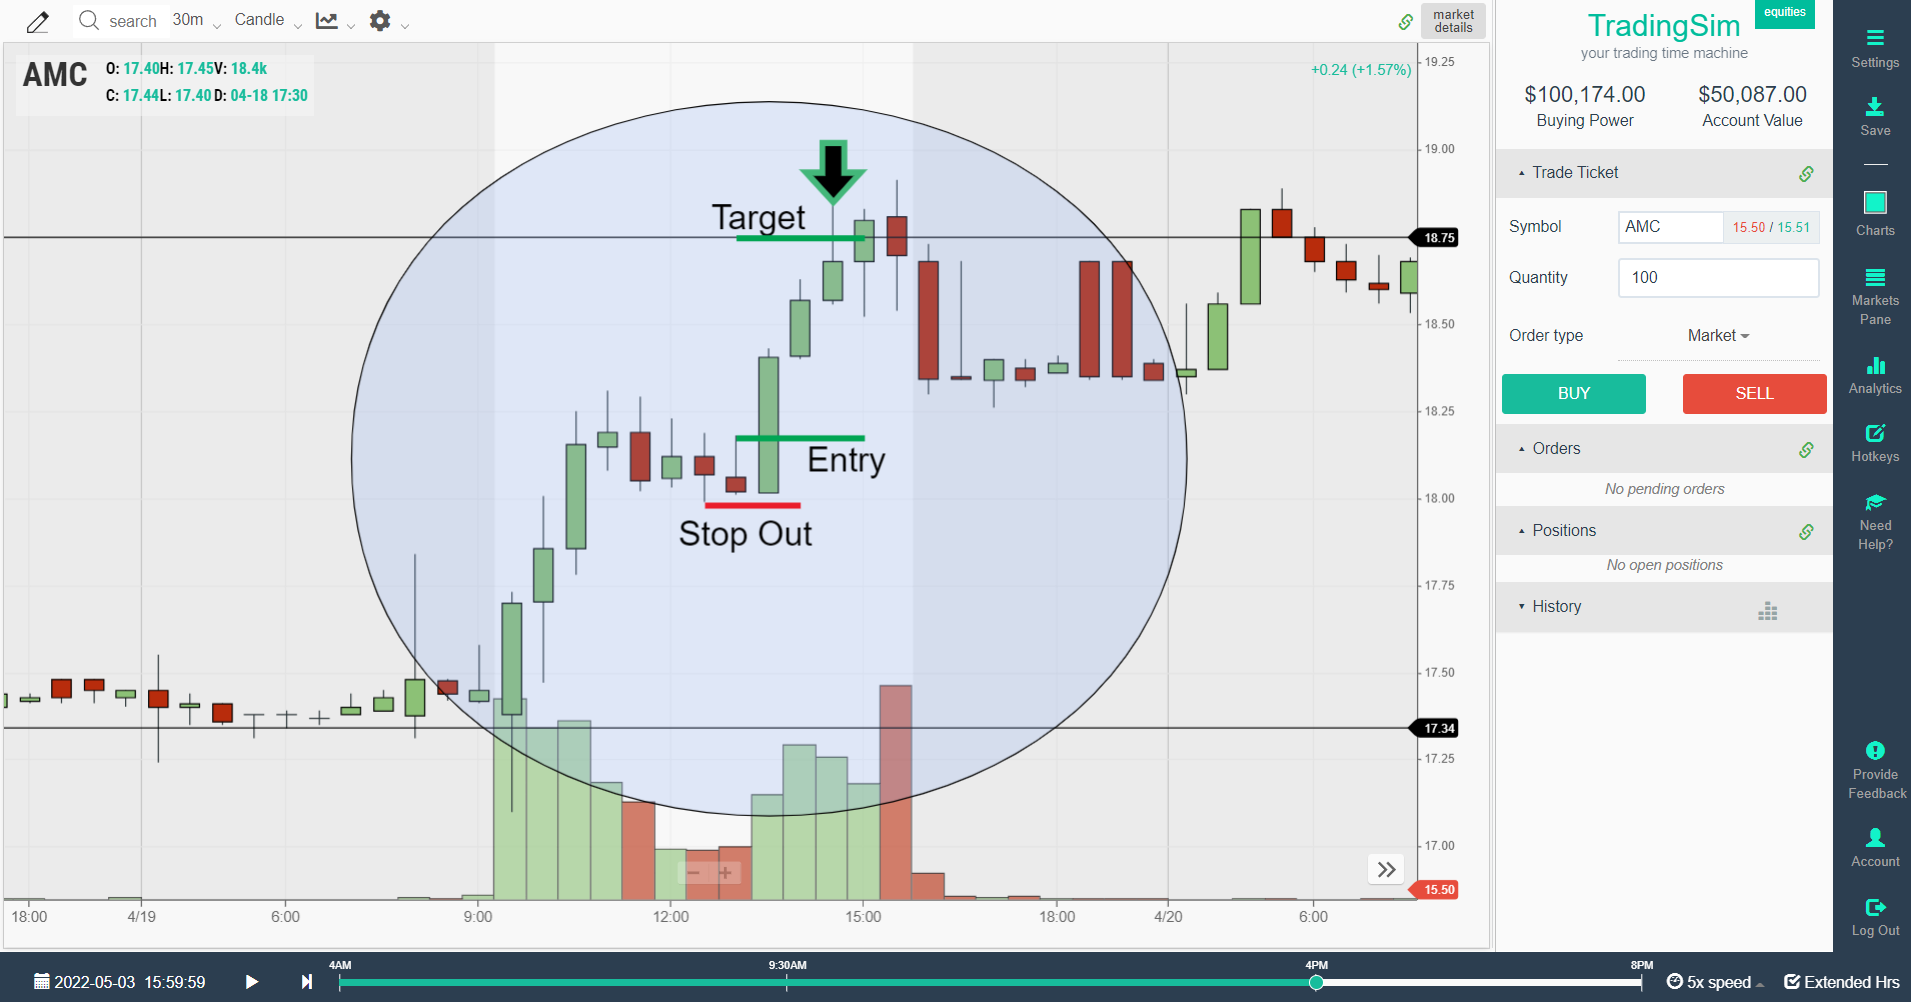
After you buy the breakout, you then set your stop below the breakout candle. In this example, your target is set for the "resistance" area on the bigger picture chart shown above. This gives you a solid reward/risk ratio of about 3/1.
Bull flag examples
Here are a few more examples of intraday bull flag patterns that work. Notice how each one appears clean and orderly no matter the time frame of the chart.
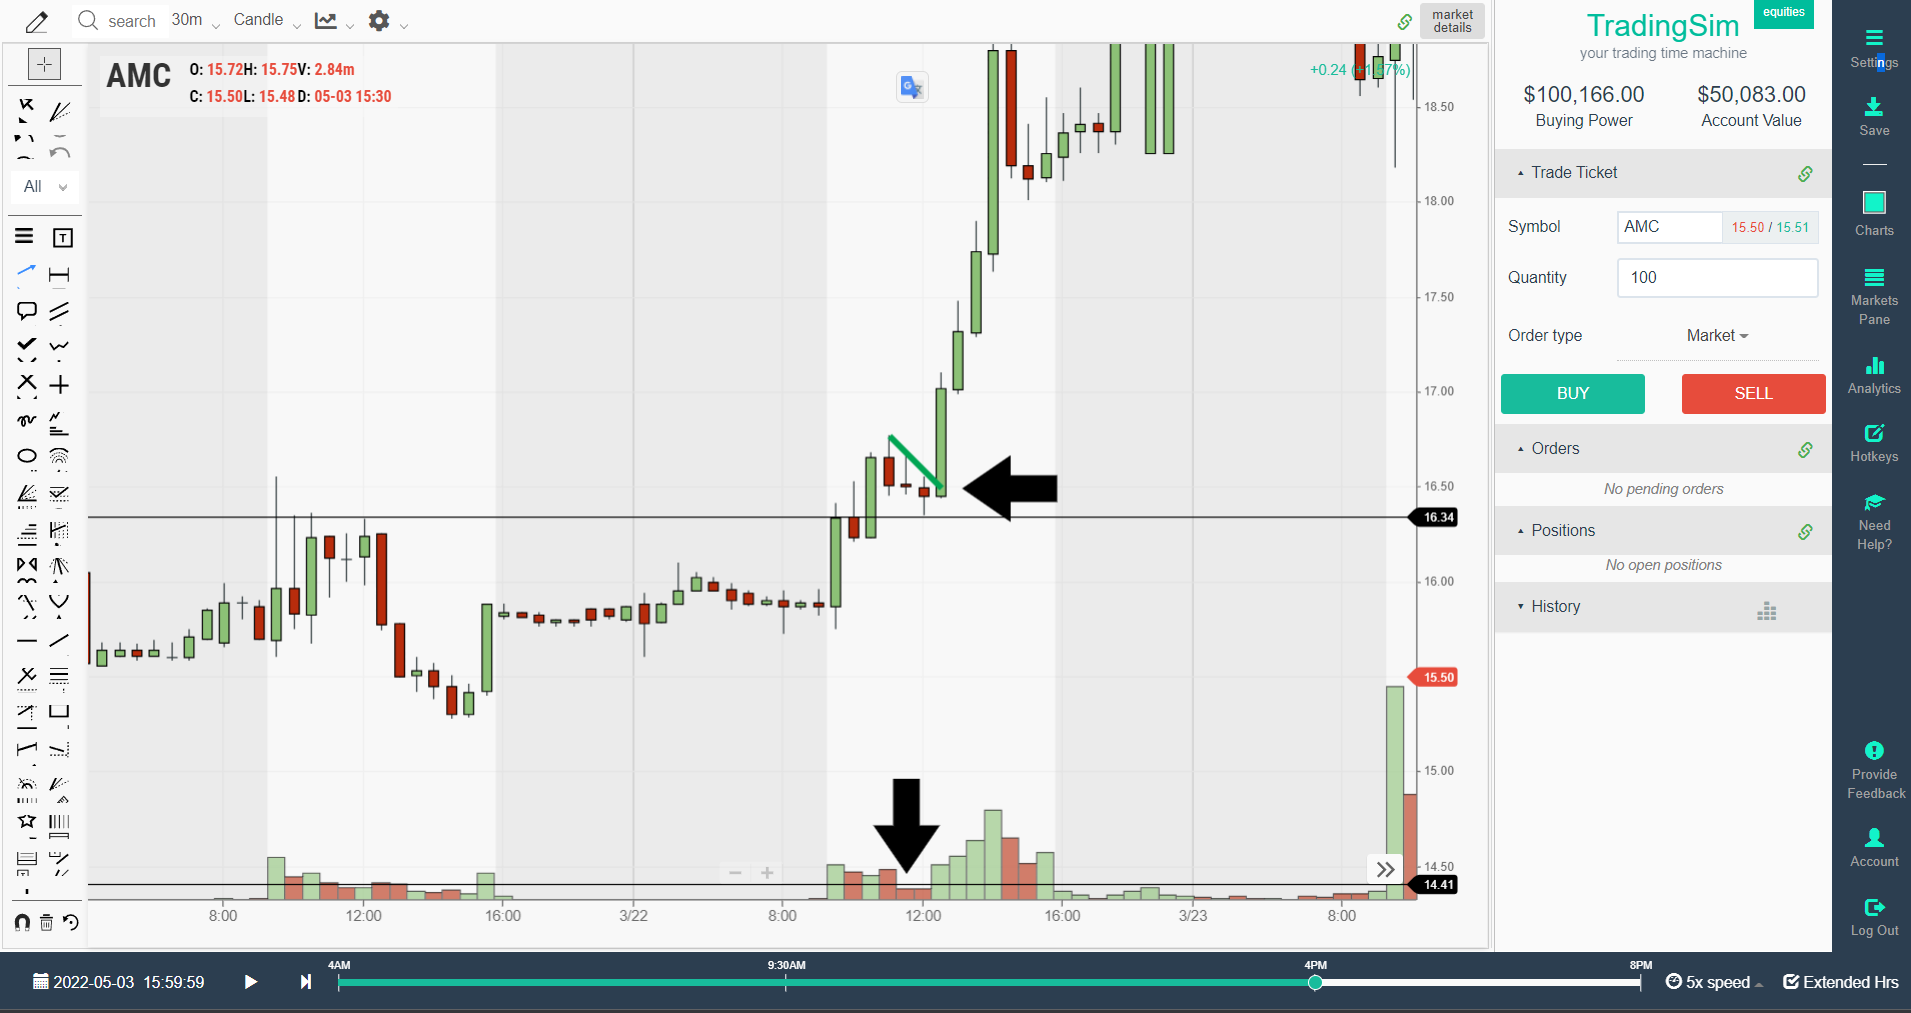
Example 1
In this example you have AMC breaking out of its prior trading range on increased volume. It then recedes for 3 candles and then breaks out again. A perfect bull flag example.
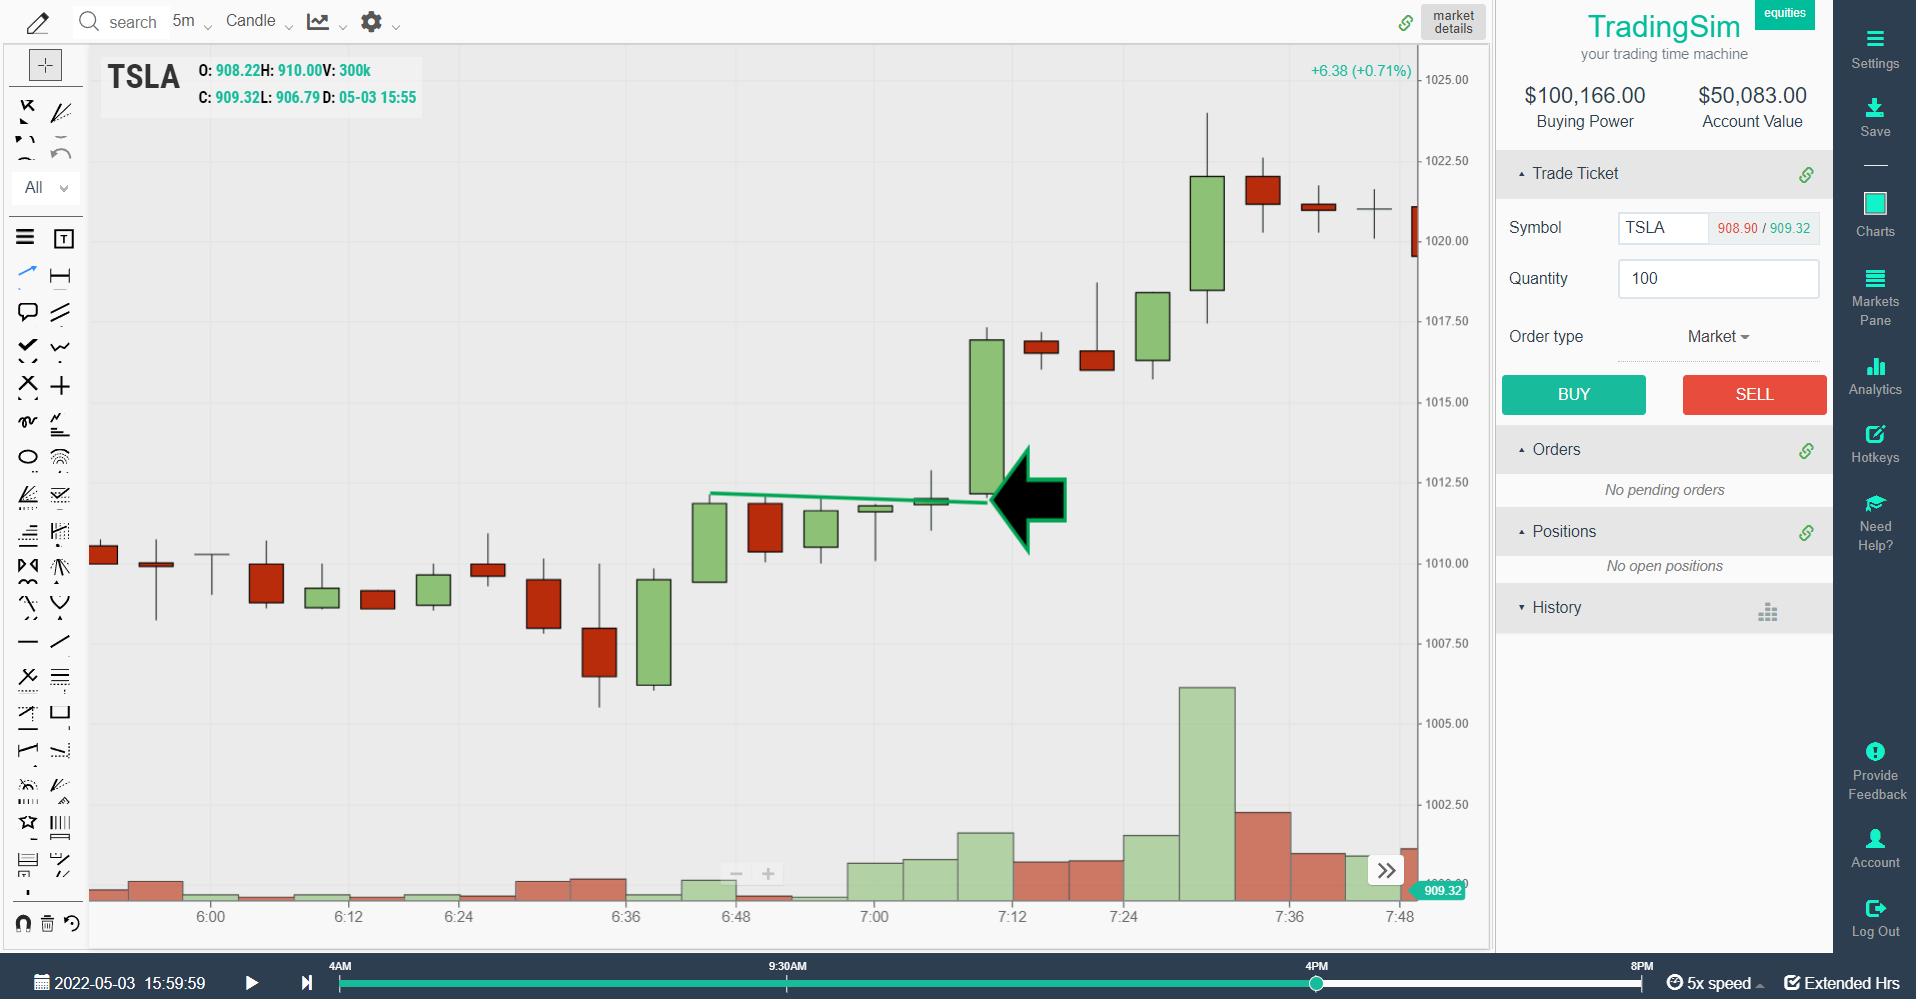
Example 2
In this pre-market bull flag example with TSLA, we are using a 5-minute chart. Notice that TSLA is beginning to curl upward on heavier volume, then pulls back with lower volume before resuming its new uptrend.
Bull flag on a daily chart
Bull flags can also occur on higher time frames like daily charts. The criteria always remain the same, whether you are trading a 1-minute chart or a daily chart. The only difference is the patience it takes to allow the pattern to develop.
You want to see a strong move upward in prior days to form the "pole" of the flag. Then you want a tight consolidation where the price begins to move downward or countertrend on lower volume. Lastly, when the volume returns, you'll buy the break of the previous candle's high.
In this example of NFLX, we have a perfect bull flag on a daily chart:
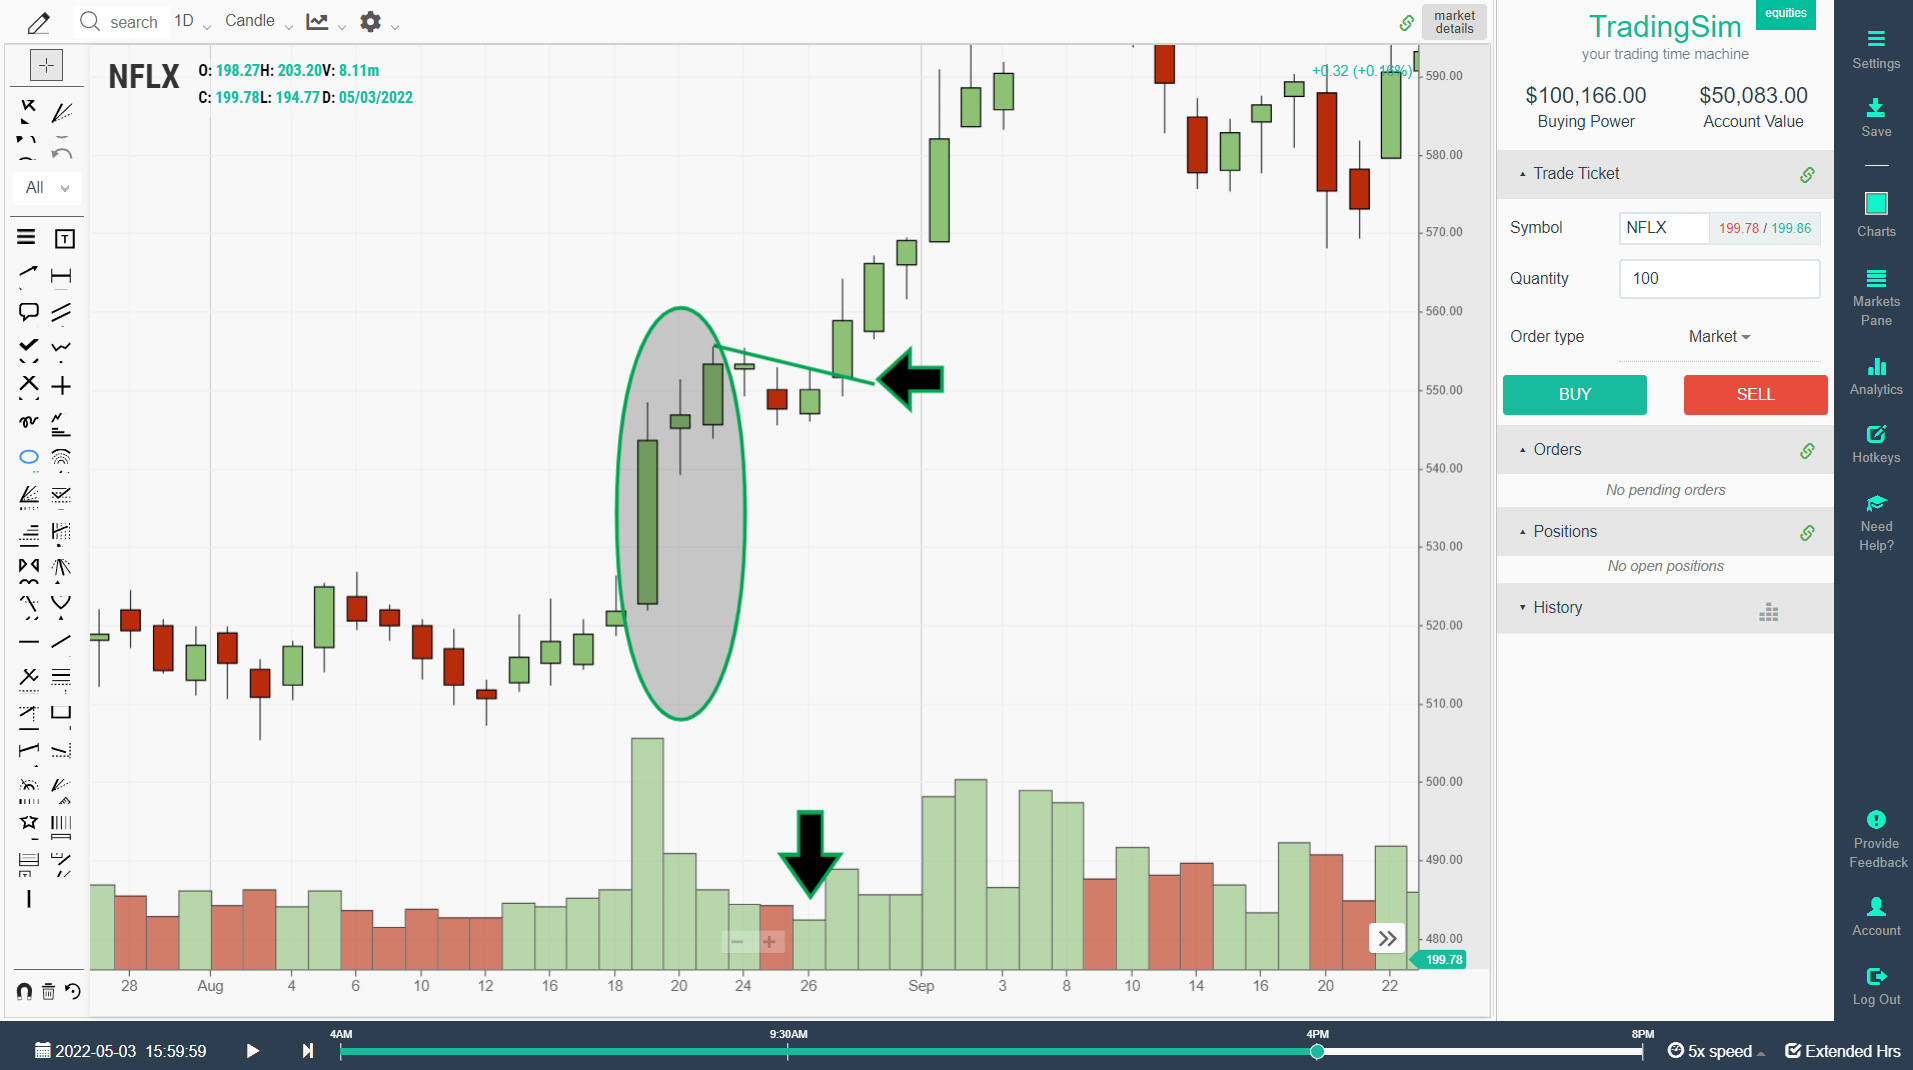
Pay attention to how the inside candles formed during the flag. They put in consecutive lower highs until the breakout day, which took them out.
Bull flag in crypto
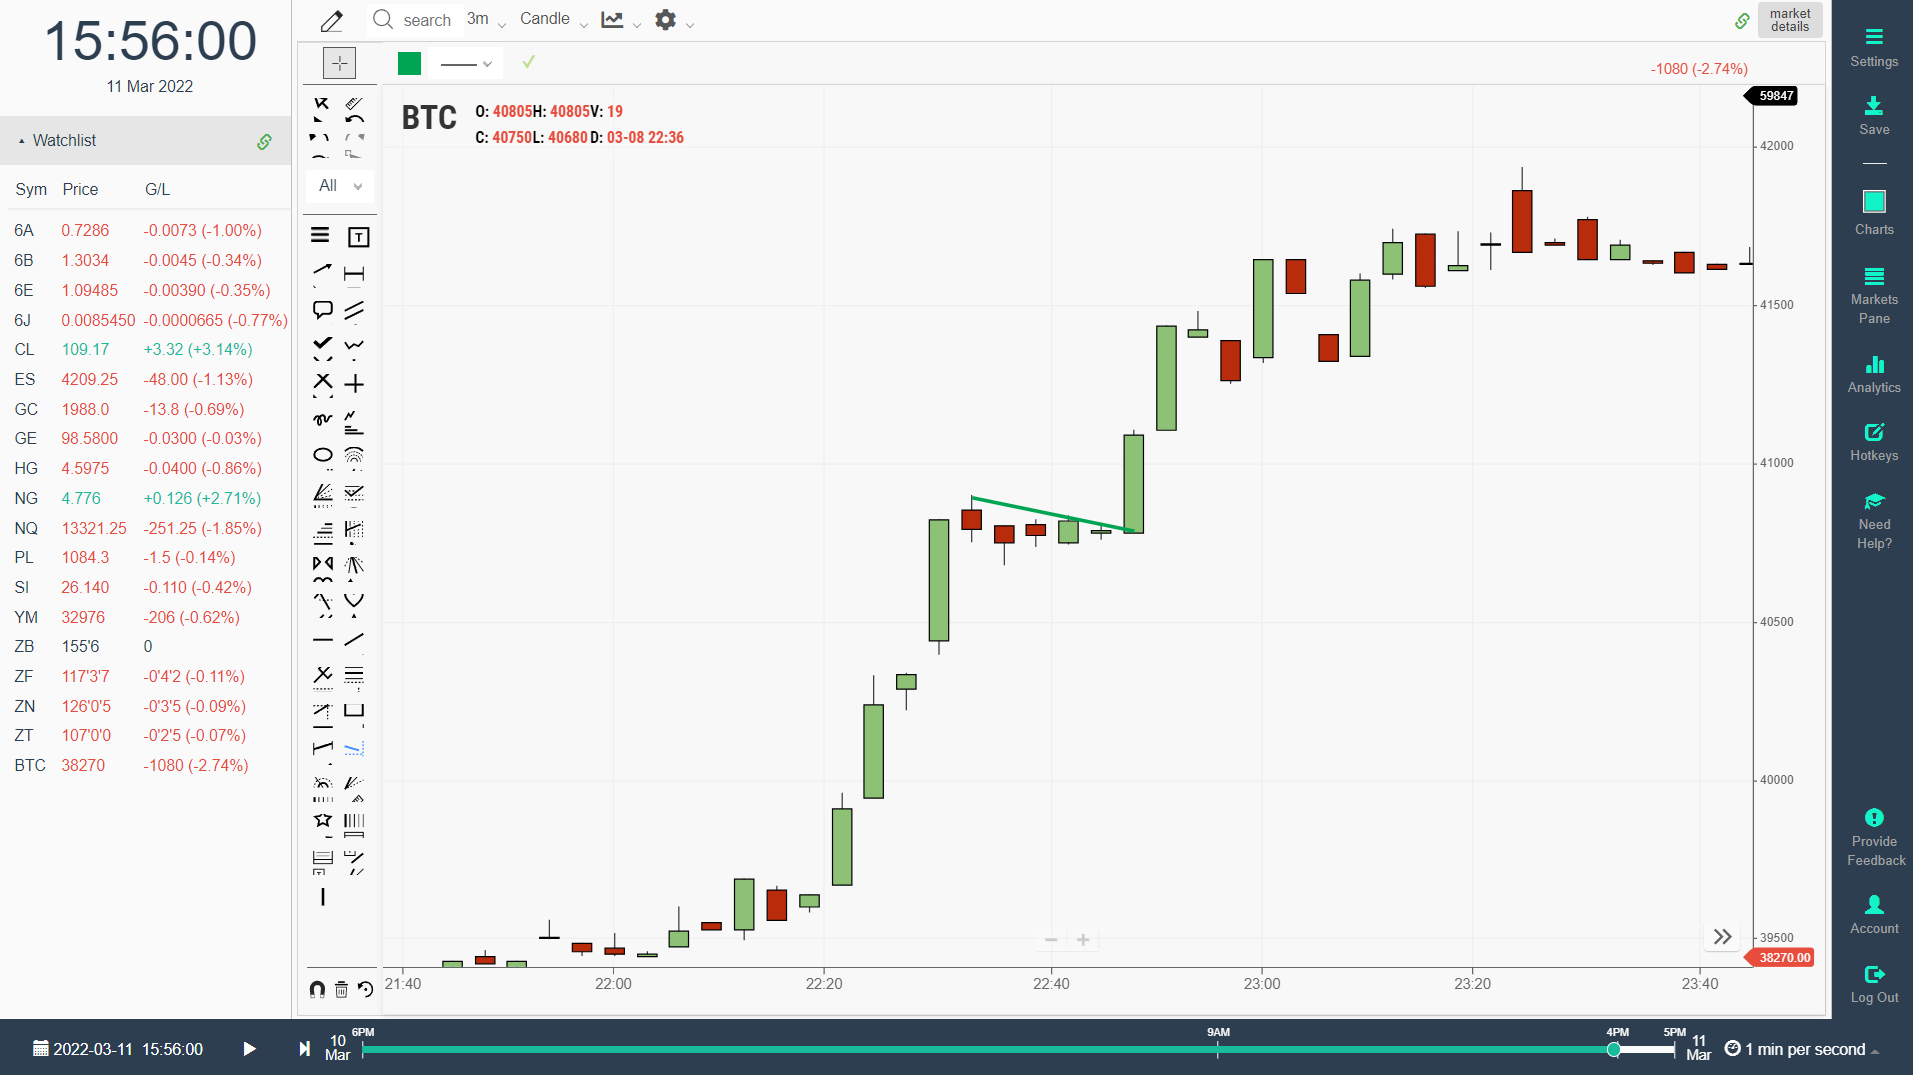
Yes, bull flags can occur in crypto as well. Even Bitcoin regularly repeats this common pattern. A bull flag in crypto has the exact same criteria as in stocks. Look for a demand pole, followed by a tight pullback with lower highs and lower lows, then a breakout to resume the uptrend.
In our simulator here at TradingSim, you can practice trading Bitcoin with BTC futures. It is a great way to get your feet wet and test your strategies without actually risking real money in Bitcoin.
In this example you can see that Bitcoin had a really nice bull flag on the 3-minute chart:
When is A bull flag invalidated?
Not all bull flags will work. If they did, everyone would trade them all the time. A bull flag fails or is invalidated once it breaks the low of the breakout candle. We would call this "failed follow-through".
As we mentioned above, you want a bull flag to put in a series of lower highs so that you can buy the breakout of the most recent candle's lower high. You then can set your stop at the lows of that prior candle.
If the breakout fails and hits your stop, then the bull flag is invalidated. This doesn't mean it cannot set up another pattern later on. But, for the time being, the bull flag becomes invalidated.
Here is an example of what this looks like:
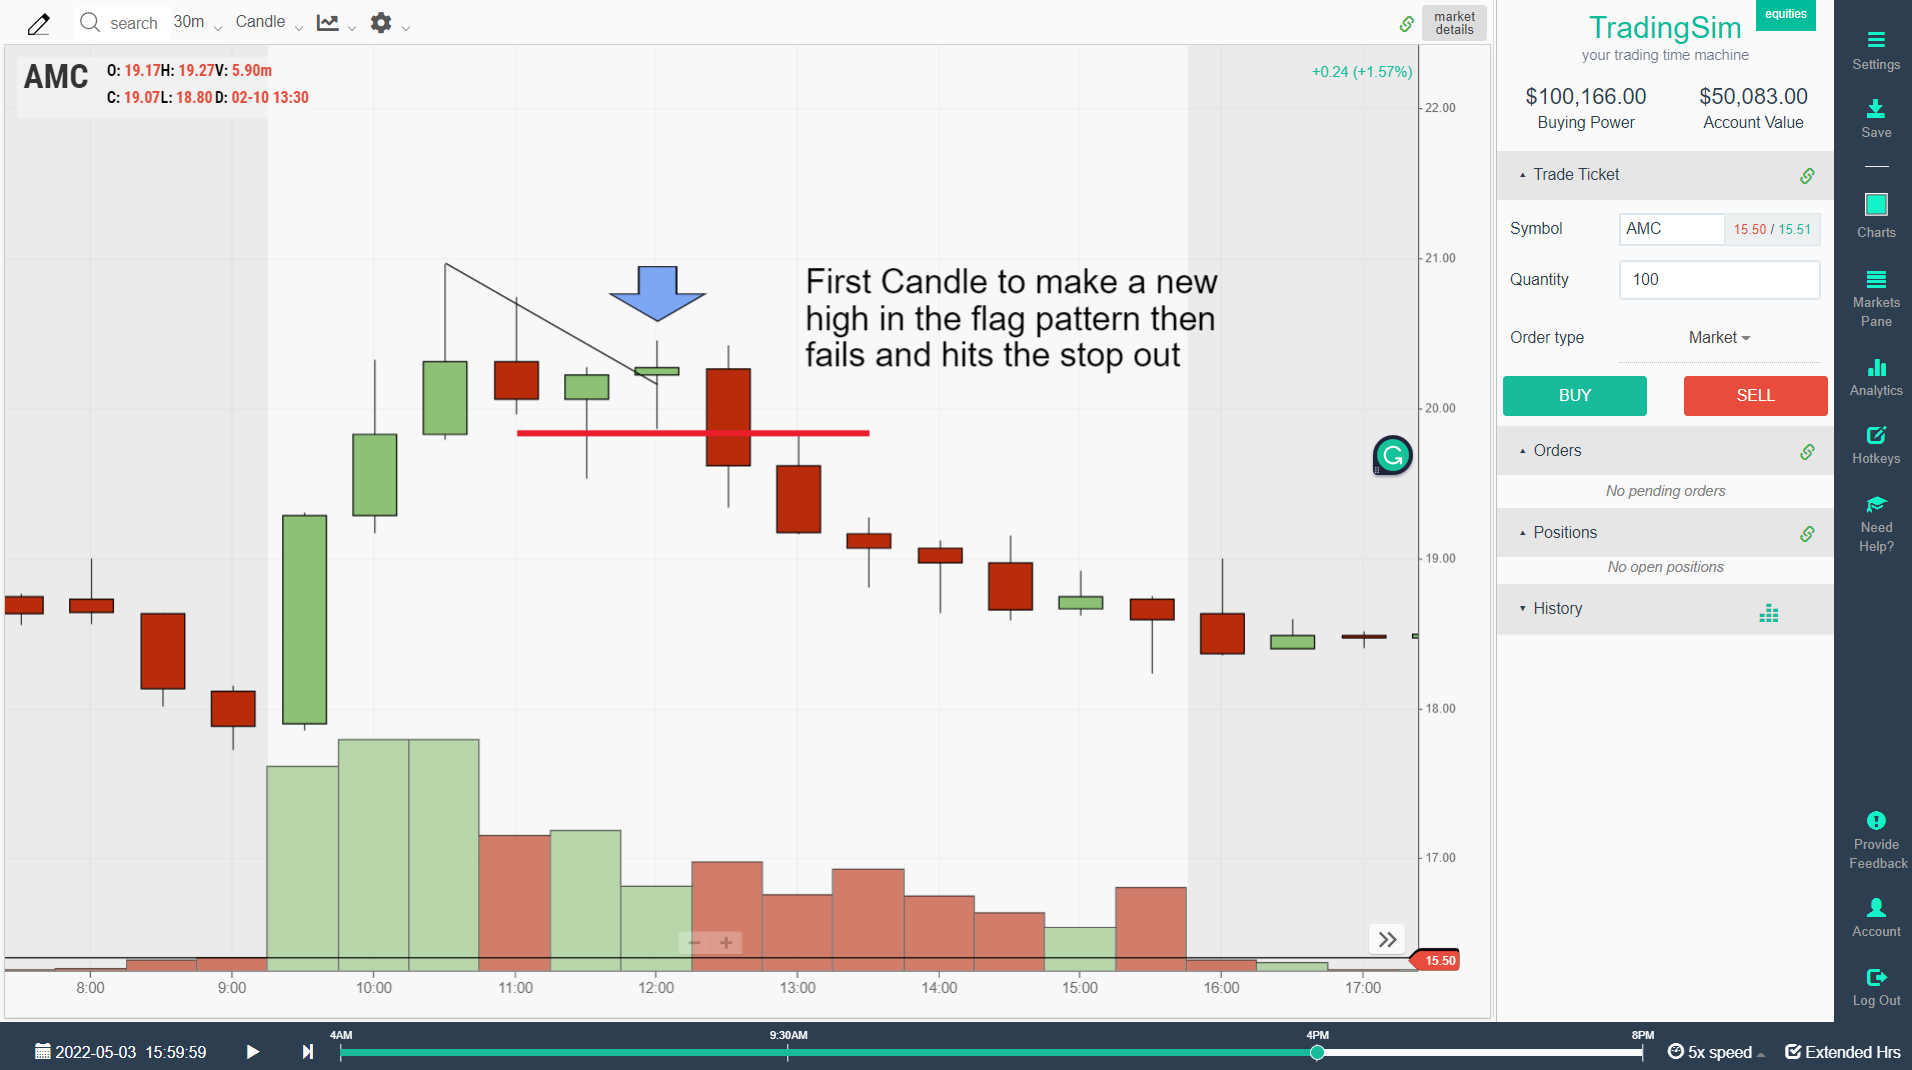
This is a great lesson on managing risk and respecting your stops. Never assume that any pattern in the market will work 100% of the time. Always set your stop and move on if the trade doesn't go in your favor.
A bull flag pattern is a continuation chart pattern that forms during a strong uptrend when price consolidates in a slight downward channel after a sharp move higher. The initial surge creates the flagpole, and the consolidation creates the flag itself. I consider the bull flag one of the most reliable patterns in day trading because it represents a pause in buying pressure rather than a reversal. Traders who missed the initial move get a second chance to enter during the flag formation. The pattern completes when price breaks above the upper trendline of the flag on increasing volume, typically continuing in the direction of the original breakout. In my experience trading bull flags across thousands of charts, the strongest setups form when the flag retraces no more than 50 percent of the flagpole and the consolidation lasts between 3 and 10 bars depending on your timeframe.
Trading a bull flag breakout requires patience and a clear plan for entry, stop-loss, and profit target. I enter the trade when price closes above the upper boundary of the flag formation with volume that exceeds the average volume during the consolidation phase. This volume confirmation is critical because breakouts without volume tend to fail. My stop-loss goes just below the lowest point of the flag, which keeps risk defined and manageable. For profit targets, I measure the length of the flagpole and project that distance from the breakout point. This gives a realistic target based on the momentum that created the pattern. One rule I follow strictly is avoiding bull flags that form after extended rallies with multiple consecutive green candles. These late-stage flags have a much higher failure rate because the move is already exhausted and smart money is looking to distribute rather than accumulate.
The main difference between a bull flag and a pennant comes down to the shape of the consolidation phase. A bull flag consolidates in a rectangular channel that slopes slightly downward against the trend, with parallel support and resistance lines. A pennant consolidates in a symmetrical triangle shape where the trendlines converge to a point. Both patterns signal continuation of the prior uptrend, but they offer different entry dynamics. Bull flags provide clearer support and resistance levels for placing stops, while pennants can produce more explosive breakouts because the converging trendlines create increasing pressure. In my trading, I find bull flags slightly more reliable because the clear channel structure makes it easier to identify false breakouts. Pennants can whipsaw more before the real breakout occurs. If you are just starting with continuation patterns, I recommend focusing on bull flags first and adding pennants to your playbook once you are consistently profitable.
Bull Flag Pattern: Key Trading Rules
After trading bull flags for well over a decade, I have distilled my approach into a set of rules that keep me disciplined and profitable. These are not theoretical concepts but practical guidelines I follow every trading day.
First, I only trade bull flags that form after a strong initial move with above-average volume on the flagpole. A weak flagpole produces weak breakouts. Second, the flag itself should show declining volume as the consolidation progresses. This tells me that sellers are losing interest and the pullback is just profit-taking rather than genuine distribution.
Third, I wait for a decisive close above the flag boundary rather than buying the first wick above resistance. Too many traders get burned chasing the initial pop only to watch it reverse. Fourth, my stop goes below the flag low with enough room to avoid getting stopped out by normal volatility. I typically add a small buffer of 2 to 3 percent below the flag low.
For profit targets, I project the flagpole height from the breakout point and take partial profits at 75 percent of that target. Then I trail my stop on the remaining position using the 9-period exponential moving average. This approach lets me capture the bulk of the move while still participating if the stock runs further.
How to Practice Bull Flag Trading
The best way to get comfortable trading bull flags is to practice in a risk-free environment before putting real capital on the line. I recommend using a day trading simulator to replay historical market data and identify bull flag setups in real time.
When I first started, I spent months scanning charts after hours, marking every bull flag I could find and writing down what happened after the breakout. That manual process taught me more than any book ever could. A simulator accelerates this learning because you can trade through hundreds of scenarios in the time it would take to experience just a few in live markets.
Focus on building a sample size of at least 50 bull flag trades in simulation before going live. Track your win rate, average gain, average loss, and the patterns that worked best. This data becomes your edge and gives you the confidence to execute when real money is at stake.
Bull flags share characteristics with other consolidation patterns. The volatility contraction pattern (VCP) is a cousin of the bull flag that focuses specifically on narrowing price ranges before breakouts. If you want to expand your pattern recognition beyond bull flags, understanding the ABCD pattern will help you identify reversal setups that complement your continuation plays.
Learn More
We hope this helps you in your trading journey and education in the markets. If you would like to learn more about chart patterns and trading strategies, please check out our free educational resources here at TradingSim.
And don't forget to sign up for our free 7-day trial to put all these new concepts to practice without the risk. Give the bull flag pattern a try and let us know how it works for you!

Frequently Asked Questions
What is a bull flag pattern?
A bull flag pattern is a bullish continuation chart pattern that forms after a strong upward price move (the flagpole). The flag portion is a brief consolidation or slight downward drift on lower volume. The pattern completes when price breaks above the upper flag boundary on increased volume, signaling continuation of the uptrend.
How do you trade a bull flag breakout?
To trade a bull flag breakout, wait for price to consolidate after a strong upward move. Enter when price breaks above the upper trendline of the flag on above-average volume. Set your stop loss below the lowest point of the flag. Your profit target should equal the length of the flagpole added to the breakout point.
What is the difference between a bull flag and a bear flag?
A bull flag forms after an upward move and signals continuation higher, while a bear flag forms after a downward move and signals continuation lower. In a bull flag, the consolidation drifts slightly downward; in a bear flag, the consolidation drifts slightly upward. Both are continuation patterns in their respective trends.
How reliable is the bull flag pattern?
The bull flag pattern is considered one of the most reliable continuation patterns in technical analysis. Its reliability increases when the flagpole forms on high volume, the flag consolidation shows declining volume, and the breakout occurs on a significant volume surge. Always confirm with volume and use proper risk management.
Can you practice trading bull flag patterns on a simulator?
Yes, TradingSim's stock and futures trading simulator lets you practice identifying and trading bull flag patterns using real historical market data. You can replay any trading day and practice your entry, stop loss, and profit target execution without risking real capital.
Bull Flag Pattern — Learn how to identify and trade the bull flag pattern with real chart examples. Complete guide to bull flag breakout strategies for day trading in 2026.
Source: TradingSim | Author: Al Hill, Co-Founder of TradingSim | Updated: April 2026


 Day Trading


