What are harmonic patterns in stock trading?
Harmonic patterns are used in technical analysis that traders use to find trend reversals. By using indicators like Fibonnaci extensions and retracement levels, traders are able to map out these harmonic patterns on a stock’s chart. When all of the points are joined, the harmonic pattern creates a geometric shape that helps to suggest low-risk entries and exits for trades.
The main purpose of using harmonic patterns in stock trading is to predict potential price movements in the underlying stock. It’s a way of using these geometric shapes as a guideline for forecasting what a stock’s price will do. Harmonic patterns were first written about in 1932 in a book titled Profits in the Stock Market by HM Gartley.
How to draw harmonic patterns?
Drawing these harmonic patterns is more than just simply connecting the dots at certain points on the chart. They take into account Fibonnaci extensions and retracements, which are levels of potential support and resistance. How are these numbers decided? They are taken from the FIbonacci Sequence and each Fibonacci level is associated with how much a stock retraces from its previous highs. The standard levels that are used include 23.6%, 38.2%, 61.8%, and 78.6%.
Harmonic patterns generally have five touch points on the chart that can be connected to create the image. Therefore ‘drawing’ a harmonic pattern is really just a matter of understanding Fibonacci retracement levels. The type of pattern you end up drawing will likely depend on whether you are bullish or bearish on the future price movement. Harmonic patterns work for both types of trading sentiment.
What are some different types of harmonic patterns?
Fibonacci
Fibonacci numbers provide the foundation for harmonic patterns. It has been shown that the price action of stocks often use Fibonacci numbers as levels of support and resistance. It’s an interesting phenomenon given that nobody has ever proven why Fibonacci numbers appear in the stock market. It has been a commonly used indicator in technical analysis, and some traders swear by these levels.
To learn more about this trading strategy, be sure to check out our Fibonacci tutorial here.
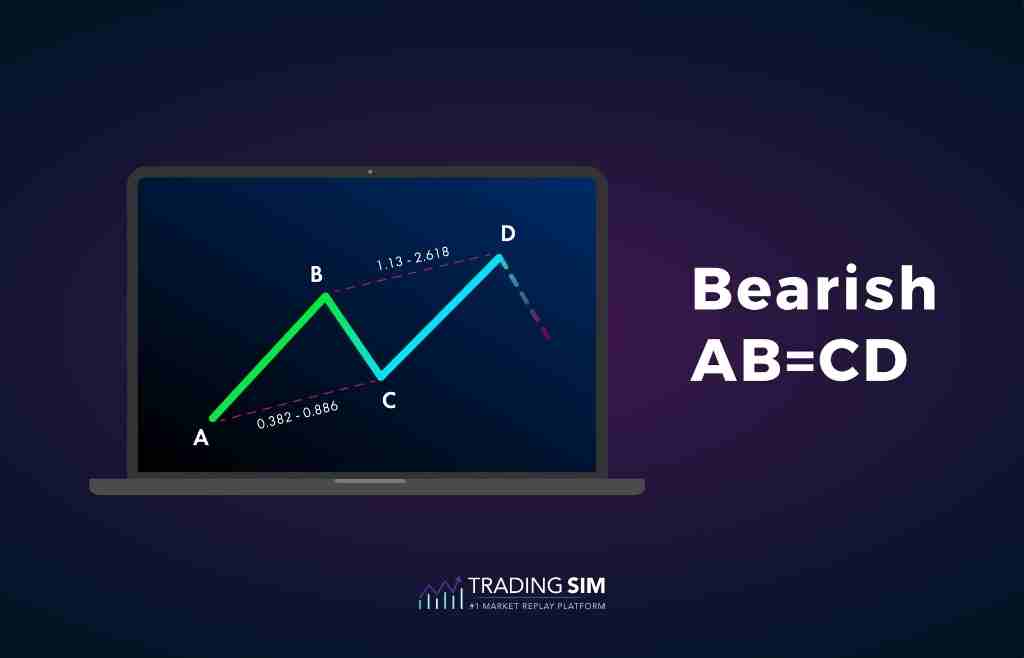
The ABCD Pattern is by far the simplest harmonic pattern to both draw and understand. This pattern only has four touch points and is created by only three different "swings" from the stock’s initial price movement.
The initial move is from A to B, followed by a retracement from B to C. This is followed by another impulsive move from C to D. Because of the Fibonacci levels, the line segment from A to B is roughly the same as the segment from C to D. In this example, Points C and D provide the best entry points for a trade.
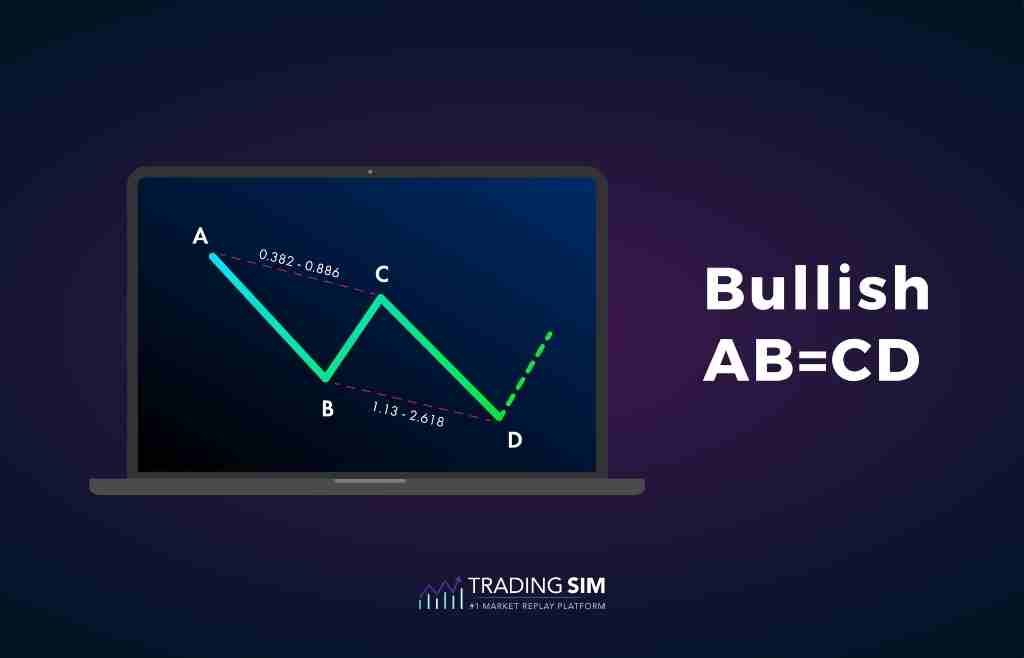
Depending on your sentiment, you can take either a long or short position in the stock from the time the stock hits D. The classical theory suggests that you initiate a position opposite of the ABCD trend.
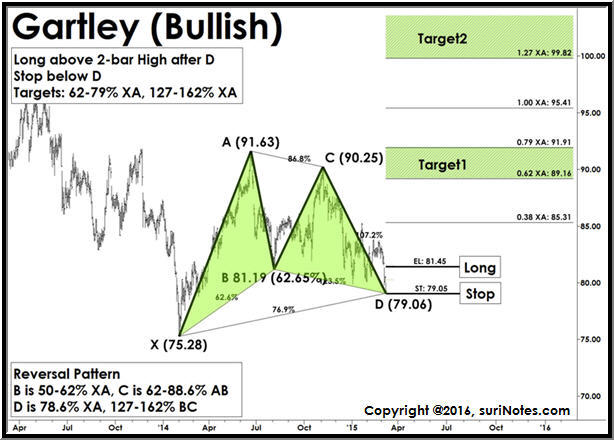
Gartley Pattern
The Gartley pattern was named after the founder of harmonic patterns. It's a little bit more complicated than the ABCD pattern. There are five different touch points on the Gartley Pattern which can either be bearish or bullish.
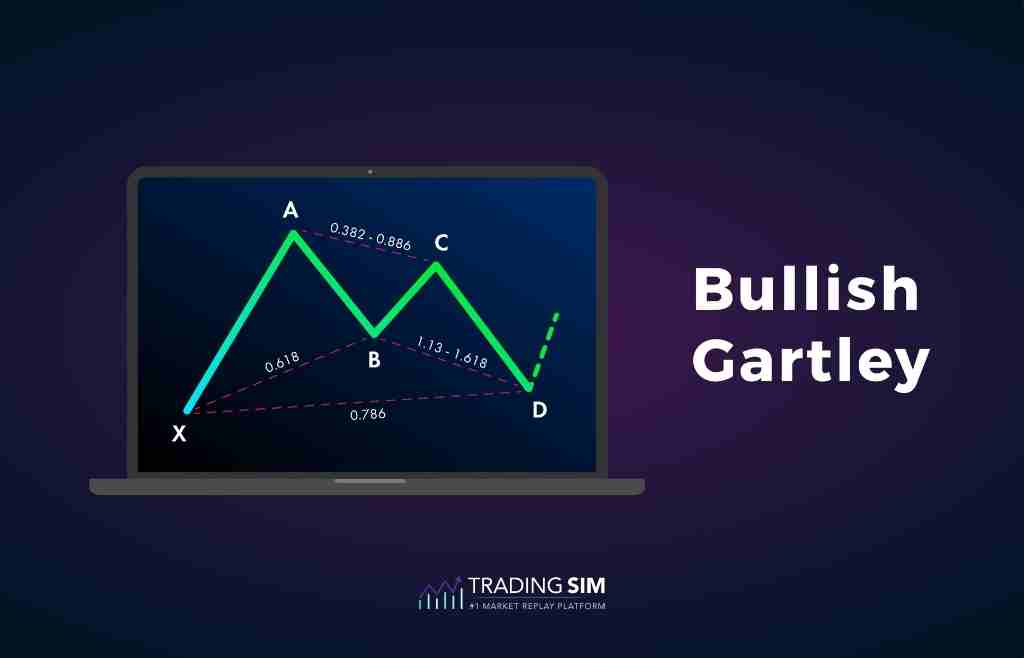
As you can see, the Gartley Pattern requires four distinct movements or "intraday swings" before making the final move to either the upside as a Bullish Gartley pattern. It resembles the letter M for bullish or W for bearish, as seen below.

The swings and retracements are all dictated by Fibonacci levels. A Gartley pattern has three distinct rules:
- The AB leg retraces 61.8% of the initial XA leg. This is a fairly large retracement.
- The BC leg by 38.2% of XA.
- The CD leg is at the minimum a 78.6% retracement of XA.
So the initial XA leg is critical in determining the rest of the retracements that form the Gartley Pattern.
Butterfly Pattern
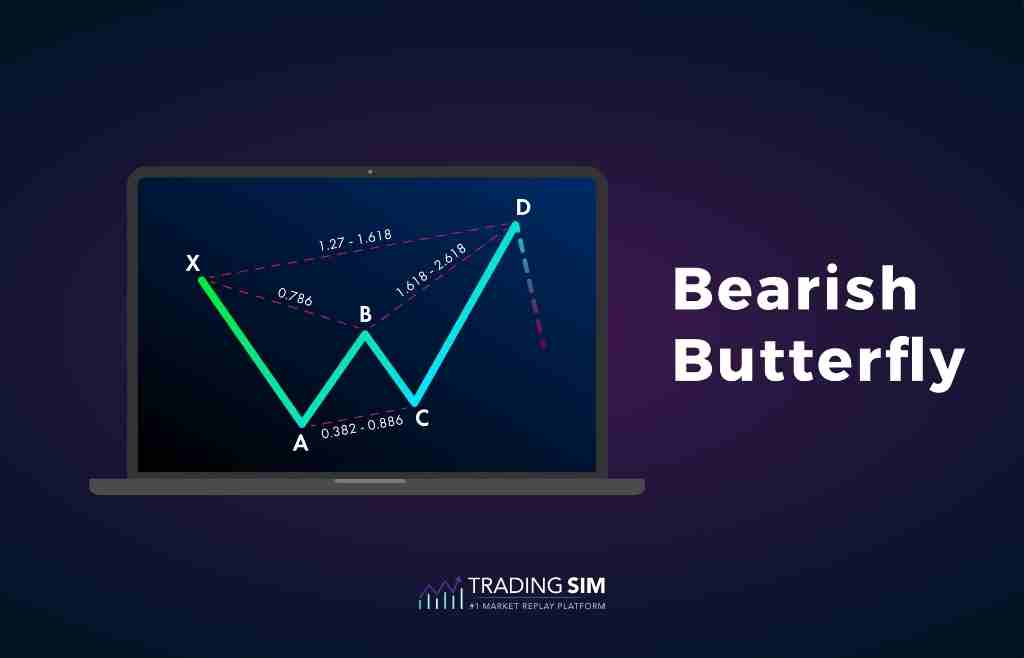
Another common harmonic pattern, the Butterfly Pattern can usually be used to determine the end of a trend move. The Butterfly Pattern consists of five touch points with four distinct movements, and it can be either bullish or bearish in nature.
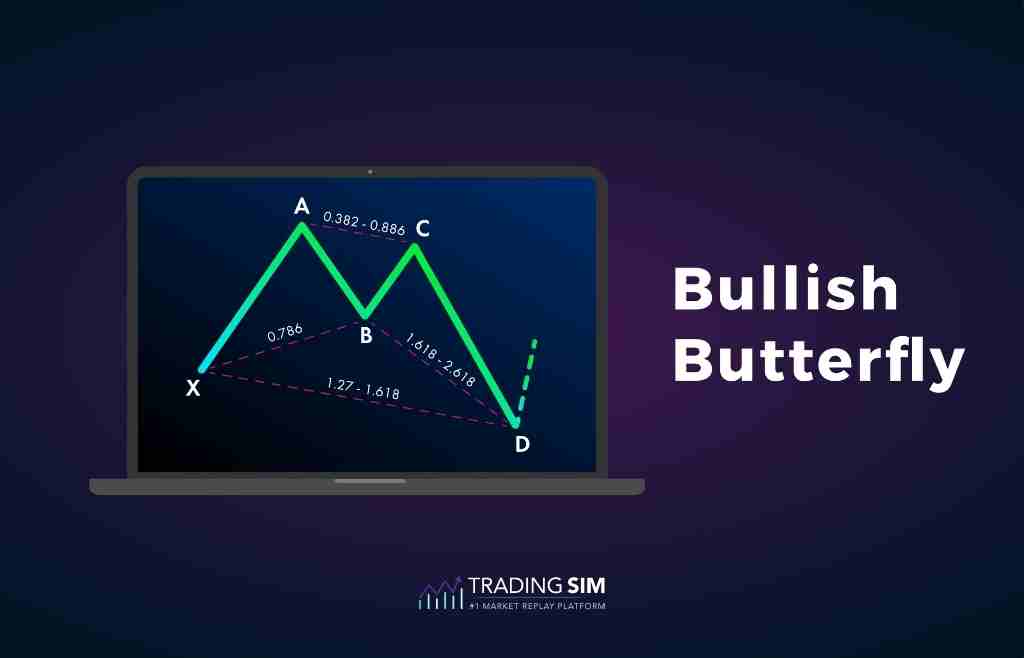
In the Butterfly Pattern, Point D acts as the point where traders will either buy or sell the trade, depending on the bearish or bullish nature of the pattern. This pattern also has several rules that follow Fibonacci levels, and the most critical one is that the retracement from A to B is 78.6% retracement of X to A. This determines where Point B is calculated and provides insight into where the potential reversal zone will be.
The bat pattern
The Bat Pattern is a relatively new harmonic pattern that was discovered in 2001 by Scott Carney. This pattern also has five touch points and four distinct movements. The Bat Pattern generally has a tighter geometric form and does not see large retracements like in the Butterfly or Gartley Pattern.
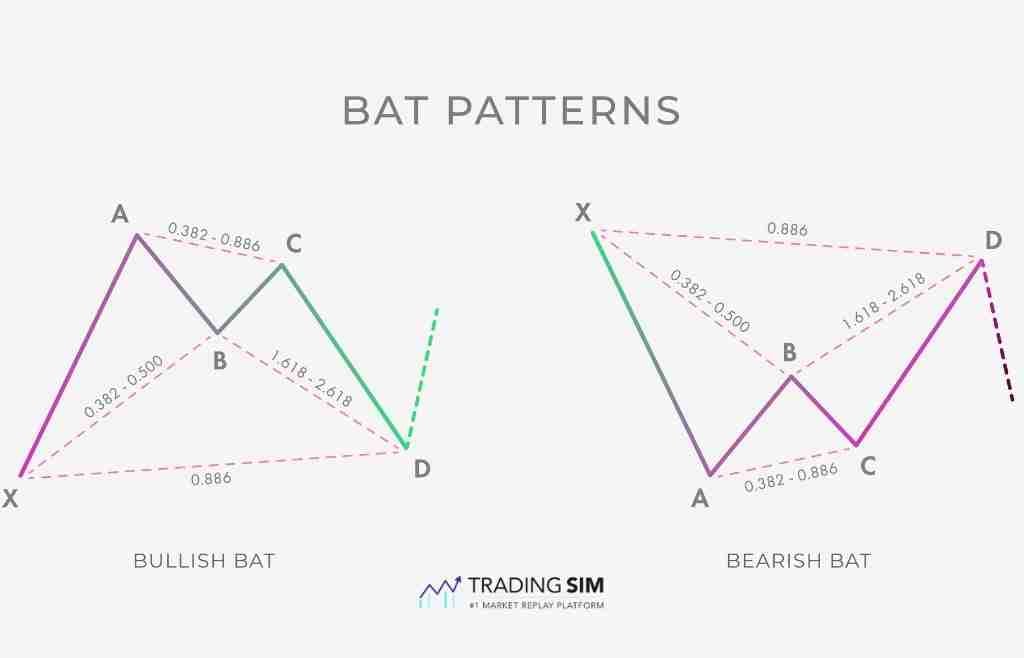
Here are the four rules for the Bat Pattern:
- The AB segment will retrace from 38.2% to 50.0% of the XA.
- The BC segment will retrace from 38.2% to 88.6% of the AB segment
- The CD segment can retrace anywhere up to 88.6% of the XA segment.
- The CD segment can be an extension of the AB segment of between 161.8% to 261.8%.
This means the CD segment is generally a larger retracement than the AB retracement.
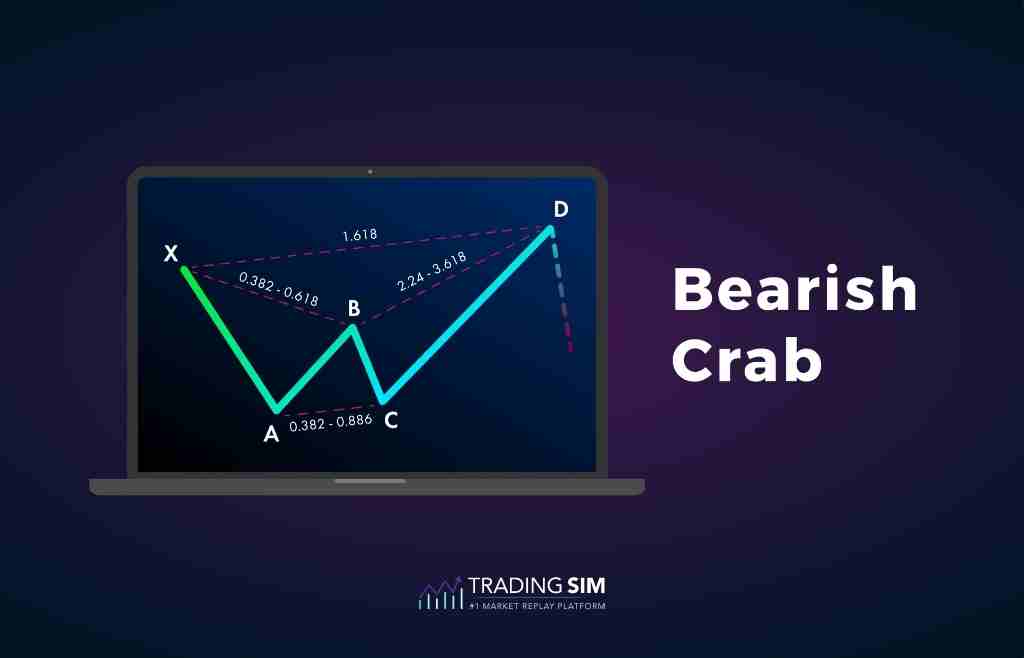
The Crab pattern
The Crab Pattern was also founded by Scott Carney, who believes that it is the most effective harmonic pattern to use when trading. Again, the Crab pattern has five touch points with four distinct movements. This pattern allows the trader to take advantage of an extreme high or low price as an entry point. Carney believes that the Crab Pattern allows for a higher risk/reward set up for traders.
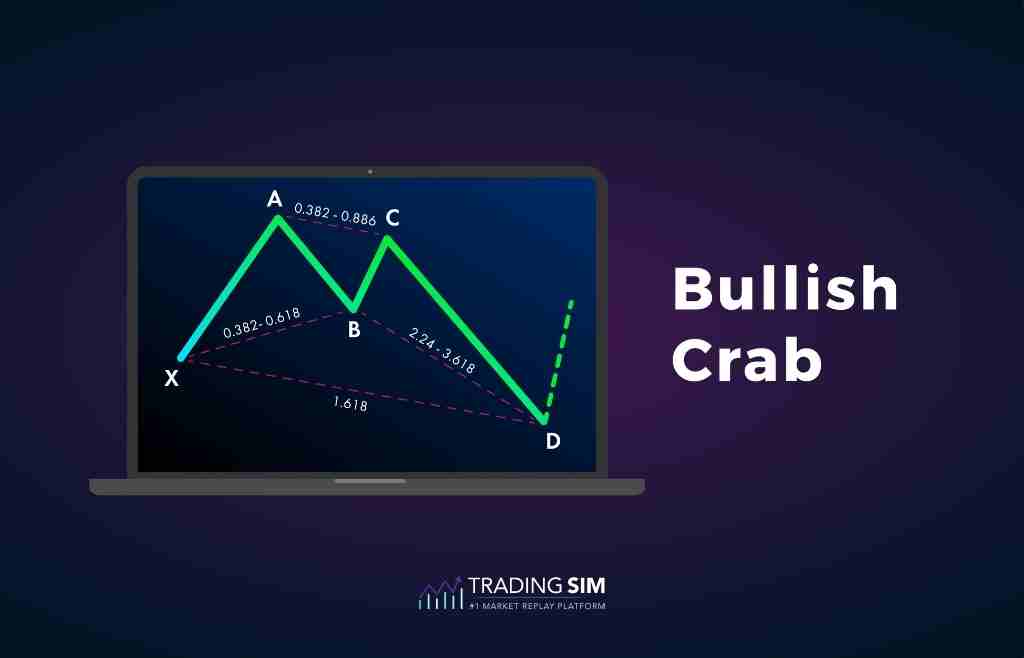
The Crab pattern follows these Fibonacci rules:
- AB will retrace between 38.2% and 61.8% of the XA segment.
- BC will retrace between 38.2% and 88.6% of the AB segment.
- Point C will never exceed Point A, whether higher or lower.
- The CD segment is the longest segment by up to 161.8% of the XA segment.
How to trade harmonic patterns?
Where to enter a harmonic pattern trade?
Each harmonic pattern has a specific entry or exit point for the trade. It is often following a major retracement to a Fibonacci level, where the stock is setting up for either the next move up or down. For a majority of the harmonic patterns, the entry point comes at Point D which is usually the last point in the pattern. A common mistake is that traders will trade as soon as it hits these levels, rather than wait for a confirmation of price action.
When to exit a harmonic pattern trade?
Most of your targets for a harmonic pattern trade are going to be near the highs or lows of the pattern depending on the bearish or bullish character of the pattern. For example, if you were to take a long trade on a bullish Gartley Pattern, your first target would a retracement back to the AC double-top. This correlates with a Fibonacci retracement area of around 62-79% percent. You can then hold the remainder of your position for a 2x target of around 127%.
The bearish trade would be no different, just a mirror image of the target zones but on the downside.
Bullish harmonic patterns
As mentioned earlier, harmonic patterns can be either bullish or bearish in nature. This means that every pattern has both a bullish and bearish version. Generally speaking, bullish harmonic patterns begin with a bearish price movement from A to B. This first downward movement is usually a good indicator as to what the potential reversal zone at Point D.
Bearish harmonic patterns
Anything that was mentioned in the harmonic patterns subsection above can also apply to the bearish harmonic patterns. Bearish harmonic patterns typically begin with an upward price movement from Point A to Point B. A bearish harmonic pattern will usually lead to a trader either selling their position at Point D or shorting the asset.
Forex harmonic patterns
Are harmonic patterns used in other types of investing? Absolutely. The currency markets are a great example of when harmonic patterns can be used. The same harmonic patterns used for equities are also used for foreign currency, as they help traders predict future price movements from currency as well.
Harmonic patterns work well for Forex traders because of how fast that market can trade. By having an idea of the price prediction for the underlying asset, traders can attempt to time the entry of a trade when the currency is most vulnerable.
Harmonic pattern summary
As with every trading strategy, some traders will swear by harmonic patterns and some won’t believe in them at all. Harmonic patterns are really just a visualization of a Fibonacci retracement move. While it hasn’t exactly been proven that Fibonacci levels are 100% accurate and reliable, there are a large number of traders that use them religiously.
Harmonic patterns have sets of rules that need to be followed. The size of the extensions and retracements will dictate exactly which harmonic pattern to use on the charts. As with any technical analysis, harmonic patterns should only be used as a guideline to future price prediction in addition to any other technical or fundamental analysis you might need.
Lastly, and most importantly, it is up to you to test your strategies before assuming they will work. The best way to do this is in a simulator with an analytics tool to track your setups over time. We hope you'll give TradingSim a try and put Harmonic Patterns to the test.
Quick Answer: What Are Harmonic Patterns?
Harmonic patterns are price structures defined by specific Fibonacci retracement and extension ratios between four or five pivot points (XABCD). Unlike classical patterns (bull flags, triangles), a valid harmonic setup requires each leg to hit precise ratios — usually measured at 38.2%, 50%, 61.8%, 78.6%, 127.2%, and 161.8% retracements/extensions. The most widely traded harmonics are the Gartley, Butterfly, Bat, Crab, Shark, and Cypher.
- They are reversal patterns — you enter at point D expecting a reversal back toward point C or beyond.
- They require precise measurement — loose fits don't count.
- They work on any timeframe, but higher timeframes tend to produce cleaner structures.
The Six Most Traded Harmonic Patterns — Cheat Sheet
| Pattern | Key B-point ratio | D-point entry ratio | Bias |
|---|
| Gartley | 0.618 of XA | 0.786 of XA | Reversal |
| Bat | 0.382–0.500 of XA | 0.886 of XA | Reversal |
| Butterfly | 0.786 of XA | 1.272–1.618 ext of XA | Reversal (deep) |
| Crab | 0.382–0.618 of XA | 1.618 ext of XA | Reversal (very deep) |
| Shark | 1.13–1.618 of XA (5-0) | 0.886–1.13 of XA | Reversal |
| Cypher | 0.382–0.618 of XA | 0.786 of XC | Reversal |
How Traders Enter and Manage a Harmonic Trade
- Identify XA, AB, BC, CD legs on the chart with Fib retracement and extension tools.
- Verify every ratio is inside tolerance (typically ±3 percentage points). If any leg is out, skip the setup.
- Wait for a reversal candle at the D point — bullish engulfing, hammer, or inside-bar break.
- Stop above/below the D swing by a buffer (ATR or swing tick).
- First target is typically 0.382 or 0.618 retracement of CD, with partial profit-taking at each level.
Why Harmonic Patterns Work (And When They Don't)
Harmonic structures work because price retracements cluster around Fibonacci ratios for the same reason round numbers act as support: enough traders watch those levels and place orders there. When you get a stack of confluences — a Fib ratio at D, a prior swing high/low at D, and a round number at D — the probability of a clean reversal rises.
They stop working when price blows through the D point without hesitation, which usually means the market structure has flipped and you're trading against a stronger trend. Three rules that reduce harmonic losses:
- Don't force patterns. If the ratios aren't clean, there is no pattern.
- Trade with the higher-timeframe trend when possible — a Gartley long in a confirmed daily uptrend is a much higher-probability setup than the same Gartley long inside a daily downtrend.
- Use confirmation at D. A reversal candle or a break of an intra-pattern trendline is the trigger, not the Fib ratio alone.
Practice Harmonic Patterns in the TradingSim Simulator
Harmonic trading is one of the hardest technical frameworks to master because the ratios are unforgiving and valid setups are rare. The TradingSim stock trading simulator lets you scan and replay sessions across years of historical data, so you can build pattern recognition for clean harmonics faster than you could in live markets. Futures traders can study harmonics on ES, NQ, CL, and GC in the TradingSim futures simulator.
Related TradingSim Reading
Frequently Asked Questions
How accurate are harmonic patterns?
When ratios are precise and confirmation is required at D, clean harmonic setups tend to produce favorable risk/reward even when win rates are moderate (often 45–55%). The edge comes from tight stops at the D swing.
What is the most reliable harmonic pattern?
Most practitioners consider the Bat the most reliable because its 0.886 D-point entry produces tighter stops and cleaner R:R than deeper Butterfly or Crab setups.
Can you use harmonic patterns for day trading?
Yes, but intraday harmonics form fast and require strict ratio discipline. They are easier to find on 15-minute, hourly, and daily charts.
Do I need special software to find harmonic patterns?
No. You can identify them manually with a Fibonacci retracement/extension tool. Pattern scanners exist but often flag loose fits; visual confirmation is still required.
What timeframe is best for harmonic patterns?
Hourly, 4-hour, and daily charts usually produce the cleanest harmonics. Very short timeframes (1–5 min) have too much noise for precise ratios.


 Day Trading Indicators


