
choppiness indicator
Wouldn’t we all love to know when a stock is trending and when it is in flat territory?
Close your eyes for a second and imagine a world where you know on the first tick that the market is starting to trend. An indicator that would somehow tell you to ignore all of the head fakes and shakeouts, and only focus on the move that counts.
Sounds too good to be true right? Well, if you have not figured it out yet, I am trying to downplay the choppiness index indicator a bit, because on first glance of the title, it sounds like it packs a powerful punch.
In this article, I will explore 4 trading strategies you can implement using the choppiness index indicator; however, it does require some work on your end. Unfortunately, you cannot trade the buy and sell signals blindly, if only it was that easy.
Overview of the Choppiness Index Indicator
How befitting of the choppiness index indicator to be an oscillator. Funny to think for an indicator that is supposed to dictate choppiness, it too is bound by ranges.
Like many other oscillators, the range for the choppiness index is 0 to 100. The choppiness index indicator uses a standard lookback period of 14 days and takes into account the average true range indicator, price high, and price low to determine a percentage value.
To learn more about the choppiness indicator formula, please visit the following link. For those that follow the Tradingsim blog, you fully understand that I do not claim to be a statistician, so I don’t bog myself down in memorizing formulas.
I try to stick to interpreting the signals provided by these indicators and how well they measure up in the real world.
Inputs for the Choppiness Index Indicator
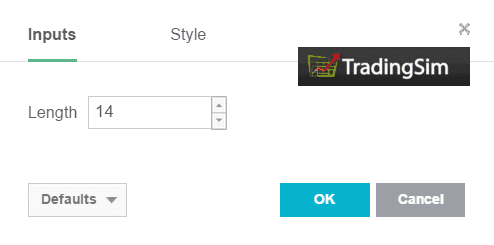
The input length for the lookback period is 14. Not that interesting if you ask me. However, when you look at the style inputs, where you define the boundaries for the indicator, things become more intriguing.
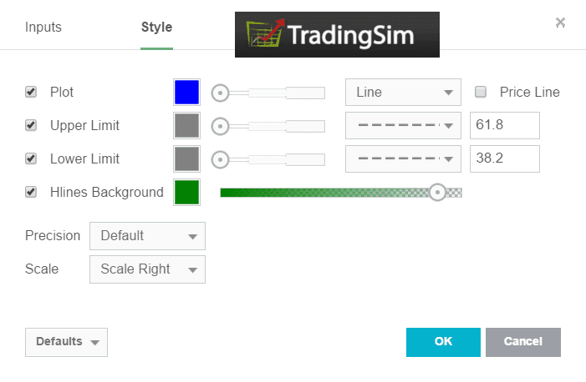
choppiness index inputs
Do you notice anything peculiar about the inputs?
Take a hard look and no, it is not the color options.
For my Fibonacci students out there, you will notice that upper and lower limits are set to the 61.8% and 38.2% retracement levels. In another article related to slow stochastics, I explored the concept of testing out other values to denote overbought and oversold. Therefore, for me the fact the indicator defaulted to anything other than the standard 80 or 20 was a breath of fresh air.
If the indicator is above 61.8%, then the stock is experiencing a choppy trend; however, if the reading is below 38.2% the stock is beginning to trend. Therefore, the closer you are to 100, the choppier the market and the closer to 0, the greater the trend.
To be honest, pretty straightforward stuff, but what are the trading strategies we can use with the indicator? Well, please continue reading on to find out.
4 Trading Strategies for how to use the Choppiness Indicator
#1 – Buy or Sell the Breakout after extreme Choppiness Index Readings
Now, if you take a browse of the articles on the web, they will simply inform you to buy or sell the break of the 38.2% retracement of the choppiness index as the stock is starting to trend. While this is the basic trigger for the indicator, I think there is more value to this indicator if we dig a little deeper.
For example, when a stock is trending above the 61.8% reading for an extended period of time, this is a sign to you that the market is beyond flat but practically dead.
Therefore, instead of buying or selling the break of the 38.2% retracement, another approach is to wait for a fall back below the 61.8% retracement level to signal a trend is in its infancy.
Let me show you a picture, to further illustrate this point.
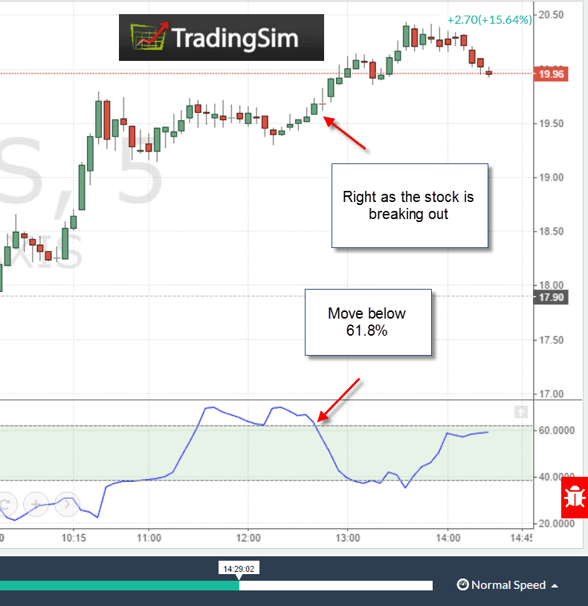
choppiness index breakout
A couple of points to note is that the choppiness indicator of course would be best used for gauging a breakout after lunch. Any of us that have been day trading for an extended period of time have come to respect the flatness of the mid-day trading session.
Therefore, it is critical for this breakout strategy to (1) occur in the late afternoon and (2) have extreme readings on the choppy index for 1 to 2 hours on a 5-minute chart. This is a sign to you the trader, that when a breakout occurs as the stock is starting to trend, you may be able to catch some late-day fire.
#2 – Ride the Trend using the Choppiness Index Indicator
Beyond identifying when a stock is choppy, the other value add for the choppiness indicator is the ability to stay in a stock when it’s trending. Placing a slight twist on the readings for the indicator, try applying the below logic when reviewing the charts.
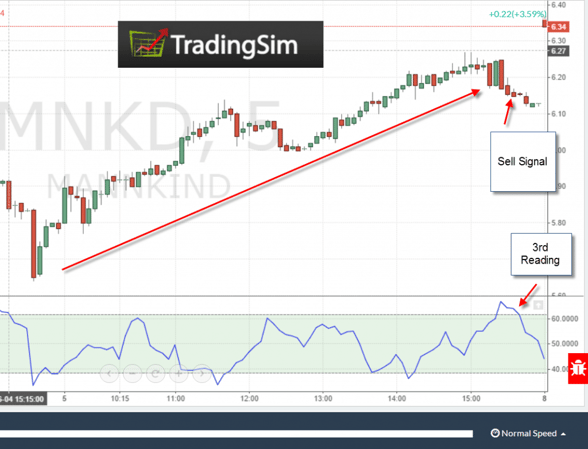
If the choppiness indicator does not print 3 or more readings above the 61.8% retracement, and the stock is in a strong trend, hold on for the ride.
Below are a few illustrations of this setup.
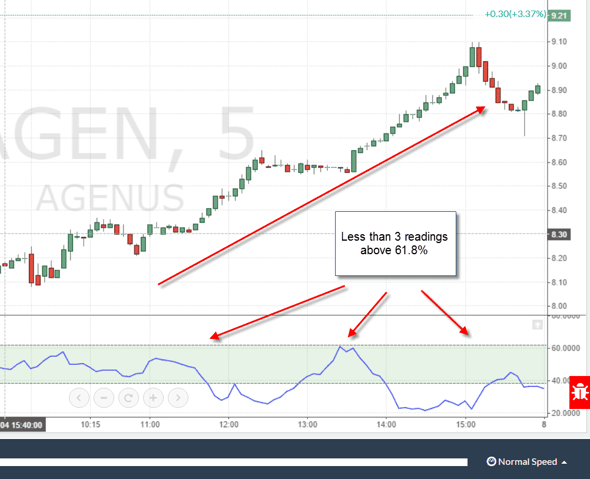
choppiness indicator and trending stocks
choppiness indicator and trending stocks 2
What I like about using this approach, is that you can weed out all of the false readings, as these pullbacks are just noise inside of the context of the primary trend.
The key point to bring home is that you have to develop a solid system for determining when a stock is starting to trend. If you are unable to consistently identify a trending stock, you will find yourself making trade decisions based on false signals.
#3 Trade within Choppy Markets
This is an obvious strategy for the choppiness index indicator; I just did not want to lead with this approach in our list of strategies.
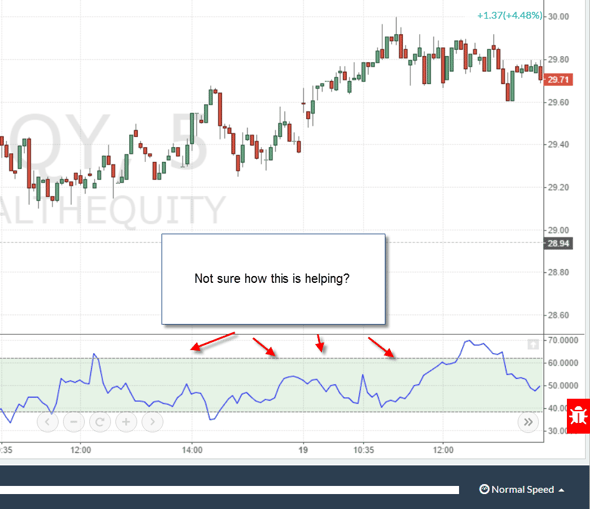
Honestly, I do not see the value of using the choppiness index indicator to trade choppy markets. From what I can see of the readings, it is not like you hit the top of a range and therefore volatility should drop off, which should coincide with a subsequent pullback and increase in volatility.
The choppiness indicator is not like an oversold or overbought indicator, so trying to time the moves inside of a tight range could prove a little difficult and may need a little help from a stochastics or Williams R.
Another way of saying this is just because the indicator is at 61.8% does not mean the stock will all of a sudden start trending. You really need price action like in examples 1 and 2 above to increase the level of certainty provided by the indicator.
Lastly, trading the chop, as I call it, has not served me well over the years. Not saying that you cannot figure it out, because choppiness may match your personality to the letter.
To further illustrate this point, take a look at the chart below that is in a late-day afternoon trading range. Please tell me if you see a way the indicator can help jump in front of the move.
choppiness indicator and choppy markets
#4 – Walk away from stocks that do not trade nicely with the Choppiness Index Indicator
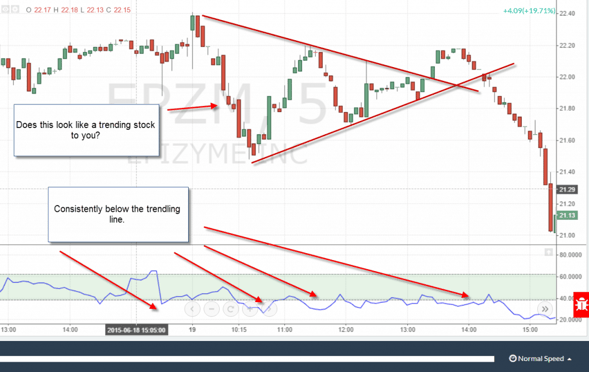
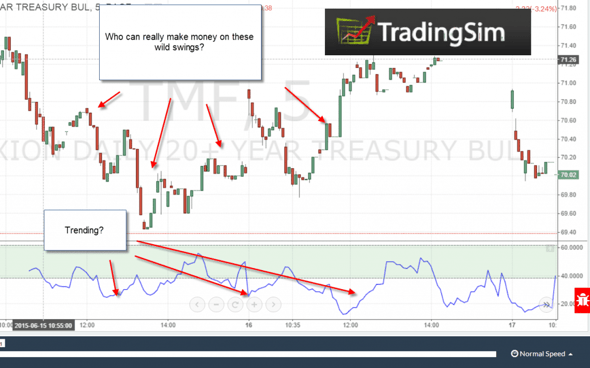
One item to point out is that some stocks will not adhere to the nice boundaries of 61.8% and 38.2% for the choppiness index indicator. You will look at some charts and there will be all sorts of false signals above and below the boundaries of the indicator.
This sort of chart action will be very evident at quick glance. A few breaches of the boundaries do not warrant writing off the indicator; however, if you cannot make heads or tails of it, please do not start modifying the settings to fit each security perfectly.
The reason I say this, is that you are now trying to take an indicator and make it custom for every single stock in the market. Honestly, that sort of effort just is not worth the time. If anything, you want to use the fact the stock does not adhere to the boundaries as a reason to filter out the stock from your list of potential candidates.
Trust me; there will be tons of other opportunities.
To further illustrate this point, please tell me if you can get a reading on any of the charts below.
choppiness index false signal
choppiness index false signal 2
In both of these examples, you will notice that the indicator was giving readings all over the place, yet the price action was either coiling or still within the confines of a larger range.
Not that you cannot make money trading these patterns, but it is much easier to focus on the stocks that adhere to the boundaries, versus trying to solve for the 20% that do not.
In Summary
True to its name, the choppiness index indicator does help identify when a stock is experiencing volatility; however, trading choppy markets is not where the indicator excels. The strength in the indicator is best displayed when used as a confirmation that a stock is starting to trend or breaking out.
A simple, yet effective way to validate signs from the choppiness index indicator is to see if volume accompanies the move. Where there is volume, there is likely something brewing.
Lastly, just to reiterate the point from strategy number 4, if you find yourself having to customize any indicator, you are trying to fit a square peg into a round hole.
In the same way you do not force trades, you should not force indicators to fit stocks or markets that trade differently.
To see how we can better help you understand the choppiness index indicator, please take a look at our homepage.
Much Success,
Al


 Day Trading Indicators
