I'll be honest with you. For the first year of my trading career, I thought chart patterns were voodoo. I'd sit at my desk, coffee going cold, staring at candlesticks that supposedly formed meaningful shapes. A head and shoulders? It looked like random noise to me.
Then something clicked. I wasn't looking at random squiggles. I was watching a crowd of traders and their collective emotions play out in real time. The same psychological pressures that shape Apple show up in Microsoft, oil futures, and Bitcoin. Once you understand why a pattern forms, you stop memorizing shapes like flashcards and start recognizing them like a friend's face.
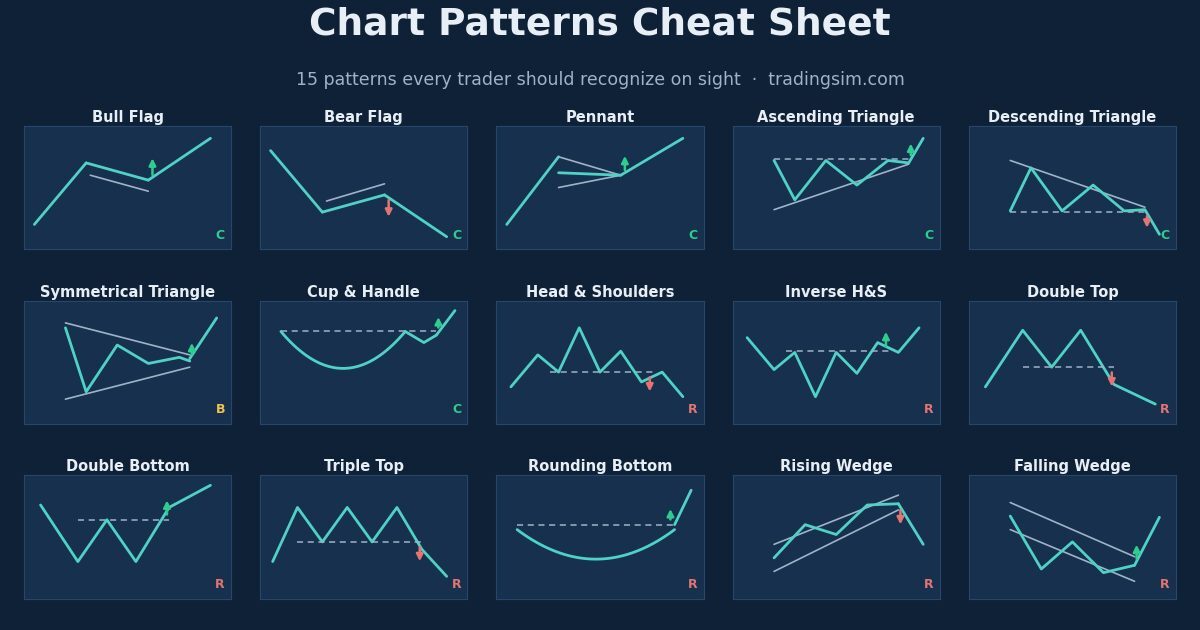
That's what this cheat sheet is for. Below are the 15 patterns I actually trade, each with a specific entry trigger, a stop-loss level, and a way to measure the target. Bookmark it, and pull it up when you are sizing up a setup and need a fast, honest read.
What is a chart pattern cheat sheet? A chart pattern is a repeatable price shape that forms when the same crowd psychology, fear, greed, and hesitation, plays out on a chart. This cheat sheet covers the 15 patterns I trade most, split into two families. Continuation patterns like bull flags, pennants, and ascending triangles show a trend pausing before it resumes, so you trade them in the direction of the existing move. Reversal patterns like head and shoulders, double tops, and rounding bottoms mark the point where one trend hands off to the other, so you trade the break against the prior move. For every pattern the recipe is the same three questions: where is the entry trigger, where does the stop go if I am wrong, and how far can price reasonably travel. Answer those three and the name of the pattern almost stops mattering.
How Chart Patterns Actually Work
A pattern is a picture of an argument between buyers and sellers. A flag is buyers catching their breath after a sprint. A double top is buyers failing twice to push through the same ceiling and finally giving up. A rounding bottom is panic slowly draining out of a stock as steady hands accumulate. None of these shapes predict the future on their own. What they do is tell you where the crowd has drawn its lines, and where a break of that line will trigger a wave of orders in one direction.
That is the real reason patterns work often enough to trade: they mark the price levels where a lot of stop-losses and breakout orders are stacked up. When price crosses one of those support and resistance lines, the resulting rush of activity is what gives the move its follow-through. Volume is the tell. A breakout on heavy volume has conviction behind it. A breakout on thin volume is a coin flip dressed up as a signal.
What Are the Three Main Types of Chart Patterns?
Everything on this cheat sheet falls into one of three buckets. Continuation patterns form during a pause in a trend and usually resolve in the same direction the trend was already going. Reversal patterns form at the end of a trend and signal that control is changing hands. Bilateral patterns, like the symmetrical triangle, can break either way, so you wait for the break rather than guessing. Knowing which bucket you are in tells you which direction you are hunting before you ever place an order.
Continuation Patterns: Trading With the Trend
These are my bread and butter because the odds sit with an existing trend. You are not calling a top or a bottom, you are joining a move that is already working.
1. Bull Flag. A sharp rally forms the flagpole, then price drifts lower in a tight, orderly channel against the trend. Entry: a close above the upper flag line on rising volume. Stop: below the low of the flag. Target: measure the flagpole and project that height up from the breakout. Bull flags and their cousins are covered in depth in my guide to flags and pennants.
2. Bear Flag. The mirror image. A steep drop forms the pole, price drifts up in a shallow channel, then breaks down. Entry: a close below the lower flag line. Stop: above the flag high. Target: the pole height projected down.
3. Pennant. Like a flag, but the pause converges into a small symmetrical triangle right after a strong move. Entry: a break in the direction of the prior surge. Stop: the opposite side of the pennant. Target: the prior move projected from the breakout.
4. Ascending Triangle. A flat ceiling of resistance with a rising floor of higher lows underneath. Buyers are stepping up more aggressively each dip. Usually bullish. Entry: a close above the flat top. Stop: below the last higher low. Target: the height of the triangle added to the breakout. See my full ascending triangle walkthrough.
5. Descending Triangle. A flat floor of support with falling highs pressing down on it. Sellers are getting impatient. Usually bearish. Entry: a close below the flat support. Stop: above the last lower high. Target: the triangle height projected down.
6. Symmetrical Triangle. Lower highs and higher lows coil together into a point. This one is bilateral, so let it show its hand. Entry: a close outside either boundary. Stop: the other side of the triangle. Target: the widest part of the triangle measured from the breakout. It most often resolves in the direction of the trend that preceded it.
7. Cup and Handle. A rounded, U-shaped base forms the cup, then a small shallow pullback forms the handle. Bullish continuation. Entry: a break above the handle high. Stop: below the handle low. Target: the depth of the cup projected up from the breakout. Here is how to trade the cup and handle in detail.
Reversal Patterns: Trading the Turn
Reversals are higher risk because you are betting against the trend in motion. I demand more confirmation here, usually a clean break of the pattern's trigger line on strong volume, before I commit.
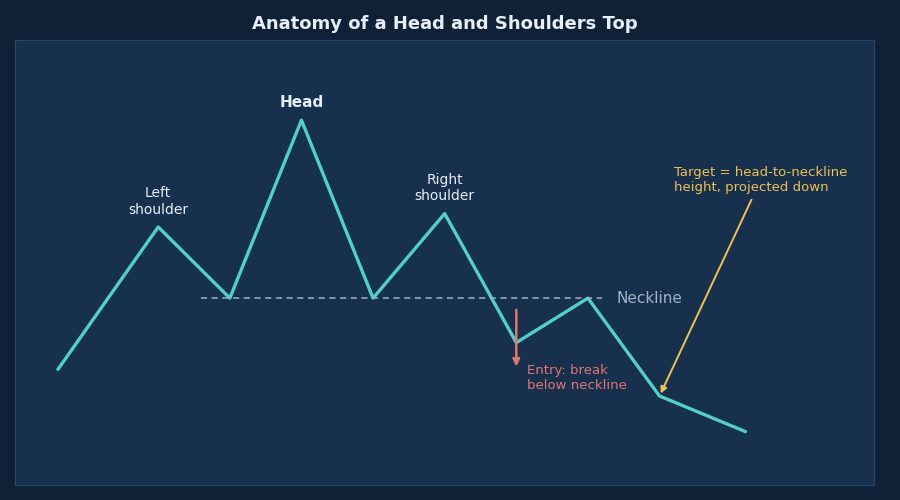
8. Head and Shoulders. Three peaks, the middle one (the head) highest, flanked by two lower shoulders, all sitting on a neckline. It tops out an uptrend. Entry: a break below the neckline. Stop: above the right shoulder. Target: the distance from the head down to the neckline, projected below the break. Full breakdown in my head and shoulders guide.
9. Inverse Head and Shoulders. The same shape flipped over, marking the bottom of a downtrend. Entry: a break above the neckline. Stop: below the right shoulder. Target: the head-to-neckline height projected up.
10. Double Top. Two peaks at roughly the same level form an M, meaning buyers failed twice at the same ceiling. Entry: a break below the trough between the two peaks. Stop: above the second peak. Target: the pattern height projected down. I broke this one down fully in my double top guide.
11. Double Bottom. A W shape where sellers failed twice at the same floor. Entry: a break above the peak between the two troughs. Stop: below the second trough. Target: the pattern height projected up.
12. Triple Top and Triple Bottom. The same logic as the doubles but with a third test of the level. More touches of a line usually means a more meaningful break when it finally goes. Entry, stop, and target follow the same rules as the double versions.
13. Rounding Bottom. A long, gradual, U-shaped turn with no sharp shoulders, the sign of panic slowly draining and steady accumulation taking over. Entry: a break above the rim resistance. Stop: below the most recent higher low. Target: the depth of the bowl projected up.
14. Rising Wedge. Price grinds higher inside two upward-sloping lines that converge, and momentum quietly fades. It usually resolves to the downside. Entry: a break below the lower wedge line. Stop: above the recent high. Target: a move back toward the base of the wedge. More in my guide to rising and falling wedges.
15. Falling Wedge. Two downward-sloping lines converge as selling exhausts itself. It usually resolves to the upside. Entry: a break above the upper line. Stop: below the recent low. Target: a move back toward the top of the wedge.
What Is the Most Reliable Chart Pattern?
There is no single pattern with a guaranteed edge, and anyone who tells you otherwise is selling something. Reliability depends on context: the pattern that forms in the direction of a healthy trend, on a liquid stock, with a clean volume expansion on the break, is worth far more than the textbook-perfect shape that appears on a thin, choppy chart. In my own trading, the setups I trust most are continuation patterns that align with the prevailing trend, the bull flag and the ascending triangle chief among them, and the head and shoulders when it appears after an extended, tired run. If you want to dig into the statistical reliability of each pattern, Thomas Bulkowski's encyclopedia of pattern research is the most thorough public resource I know of.
How Do You Trade Chart Patterns Without Blowing Up Your Account?
The pattern is only half the trade. The other half is the risk plan, and that is what actually keeps you in the game. Three rules I never break. First, confirm with volume; a breakout without a pickup in participation is a trap waiting to spring. Second, know your stop before you enter and size the position so that being wrong costs a small, survivable amount, never a number that hurts. A hard stop-loss order is not optional. Third, wait for the trigger. Anticipating a breakout feels smart until the pattern fails and you are the one holding the bag.
The fastest way to internalize all of this is repetition without financial risk. Before I ever risked a dollar on a head and shoulders, I watched hundreds of them play out. You can compress years of that screen time by drilling these setups on a simulator that replays real historical market data, so you learn what a real breakout feels like before your money is on the line.
Do Chart Patterns Actually Work?
They work as a framework, not as a crystal ball. A pattern does not make price do anything; it simply organizes what a crowd of traders is already doing into a picture you can act on with defined risk. Used mechanically, without volume confirmation or a stop, patterns will lose you money. Used as one input inside a disciplined process, they give you clean, repeatable places to enter with a known downside. If you want the honest, evidence-based case for and against, it comes down to one thing: patterns only earn their keep when you pair them with volume confirmation and strict risk control. For a plain-English primer on the broader discipline, Investopedia's overview of technical analysis is a solid starting point, and their head and shoulders entry is a good companion to the diagram above.
Frequently Asked Questions
How many chart patterns do I need to learn? Far fewer than you think. Master the handful that fit your style, a couple of continuations and a couple of reversals, before you try to memorize all 15. Depth beats breadth. Knowing one pattern cold is worth more than recognizing ten vaguely.
Which chart timeframe is best for chart patterns? Patterns appear on every timeframe, from one-minute to monthly, and the rules are the same. Higher timeframes produce fewer but generally more reliable patterns because more participants see them. Day traders lean on the 5-minute and 15-minute charts; swing traders lean on the daily.
Do chart patterns work in crypto and futures too? Yes. Patterns are a reflection of crowd psychology, and crowds behave the same whether they are trading stocks, futures, or Bitcoin. The more liquid the market, the cleaner the patterns tend to be.
What is the difference between a chart pattern and a candlestick pattern? Chart patterns are large structures that form over many bars, like a head and shoulders. Candlestick patterns are the shape of one to three individual candles, like a doji or an engulfing bar. The best entries often line up both at once.
Print this cheat sheet, keep it next to your screen, and hold yourself to the entry, stop, and target discipline on every setup. Then go put in the reps. The TradingSim simulator lets you trade these exact patterns against real historical data so the recognition becomes second nature before real money is ever involved.
More Pattern Guides From TradingSim
Each pattern on the cheat sheet has a full walkthrough with annotated charts and the exact entry, stop and target rules:








 Day Trading Penny Stocks