Day trading at the end of the day comes down to timing. Funny how the smaller the time frame you trade, the more accuracy is required of you the trader.
I cannot tell you how many times I opened a position 5 minutes too soon or closed a minute early.
We are literally talking about seconds here and the difference between a profitable or losing trade.
To help improve timing, day traders will heavily rely on time and sales and level 2. However, understanding how the broad market is moving can help you stay on the right side of the market.
For example, if you were long a stock in the Nikkei the night of the 2016 presidential election results came in with Trump as the winner, you were just blindsided. It wasn’t that you picked the wrong stock or anything. The Nikkei shot lower across the board due to the election results, only to rally by the close.
Well, in this article we will cover these market breadth indicators and how you can use them to improve the accuracy of your trading.
Top 7 Market Breadth Indicators for Day Traders
It’s not an official TradingSim post if we do not provide a top 10 list.
#1 – TICK Index
The TICK Index is a measurement of the short-term bias of the overall market and is one of the most important tools for day trading.
It measures the difference between the number of stocks on the NYSE that have registered an uptick versus the number of stocks that have registered a downtick. While a trader should not concern themselves with every Tick index reading, it is important to keep an eye on extreme levels, especially 1000 and -1000 which indicate an overbought or oversold condition.
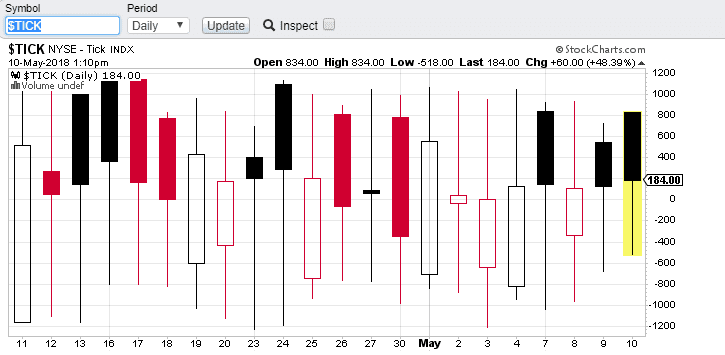
So, how would you use the Tick index when trading? Well, you can wait for a -1000 reading and then buy into a pullback of a strong trend. Conversely, if you are long and you see a reading of 1,200 registering, it’s likely time to book some profits or at least begin to keep a close eye on Level 2.
#2 – TRIN (ARMS Index)
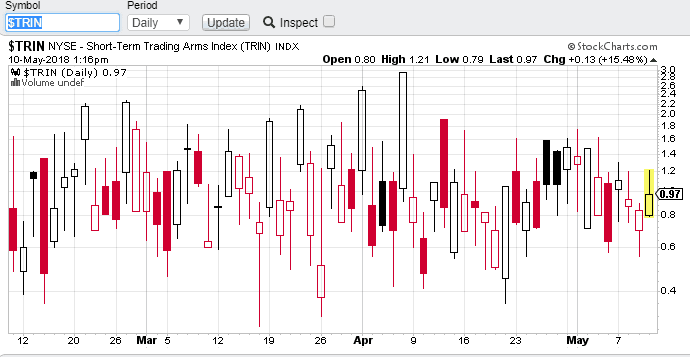
The ARMS index, aka. TRIN index, measures the breadth of the market in terms of volume and advancing issues. Essentially, it gauges whether the market is moving higher with volume support.
A reading above 1 is considered bearish and a value below 1 is bullish. If the market somehow manages to stay at the sweet spot of 1, things are considered balanced in the market.
Just like the TICK Index, there can be a lot of noise; however, keep an eye out for closing TRIN readings near 2 and .5. These can signal a change in trend on the following days open. On intraday charts, you want to see the TRIN and price moving in opposite directions. When that stops happening, it is time to look for a change in trend.
TRIN
I personally like the readings of the TRIN, because the readings include volume. If there is only a handful of stocks pulling the market up, I would want to know this before holding onto a long position expecting the market to climb higher.
If there are only a few issues holding things up, the gas will likely run out.
#3 – Premium/Discount on S&P Futures
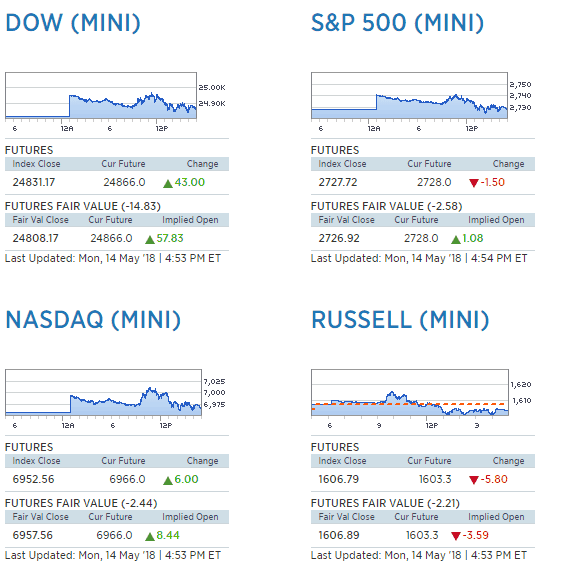
Next, we will discuss the spread between the S&P cash and S&P futures contract. This spread is often referred to as the premium or discount. It is said that the futures market leads the cash market and an expansion in this spread indicates the cash market should move higher while a contraction indicates the market should move lower.
You need to review spread charts for price extremes between futures and spot markets for trade opportunities. To determine extreme levels, you will need to look back at a set number of periods.
Essentially, this is an arbitrage play where you look to capitalize on pricing inefficiencies between the futures and spot markets.
Premium/Discount SP Futures
#4 – McClellan Oscillator
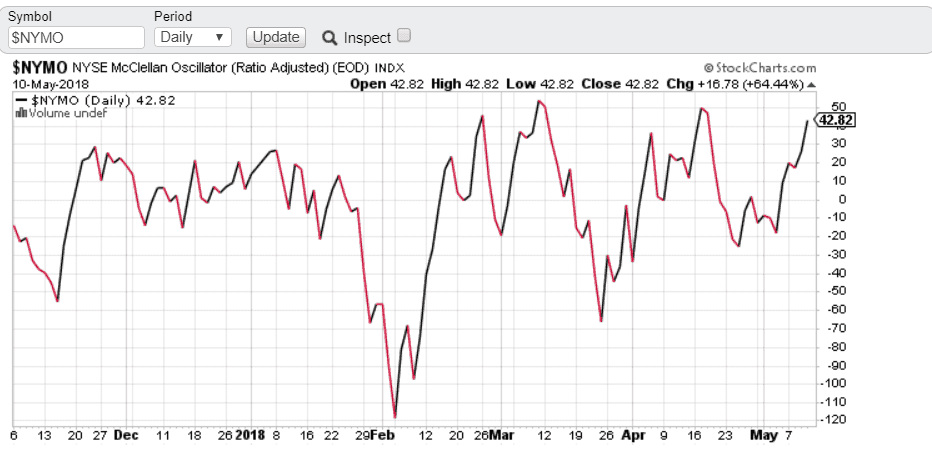
The McClellan Oscillator is a measure of the spread of advancing and declining issues across the NYSE.
Why the NYSE? The NYSE has the largest number of stocks trading of any exchange in the US.
This market breadth indicator reaches extreme levels at + or – 70.
McClellan Oscillator
At some point if the advancing stocks are outpacing losers by a large margin, the amount of air just runs out at extreme levels, and someone is left without a parachute.
The McClellan is like the TRIN, except it does not include volume and is not based on ticks but comparing stocks against one another. The challenge you will have with the McClellan is that the small and mi-cap stocks can start to pull this market breadth indicator higher or lower, but without the volume accompanied with the heavy hitters.
So, readings can reach extreme levels and go unchecked at times until the market normalizes.
#5 Absolute Breadth Index
So, why absolute in the name of the formula?
This market breadth indicator does not factor in if the stock is up or down, it just cares about market volatility.
Therefore, the indicator may display a high value, while the market is putting in a major bottom.
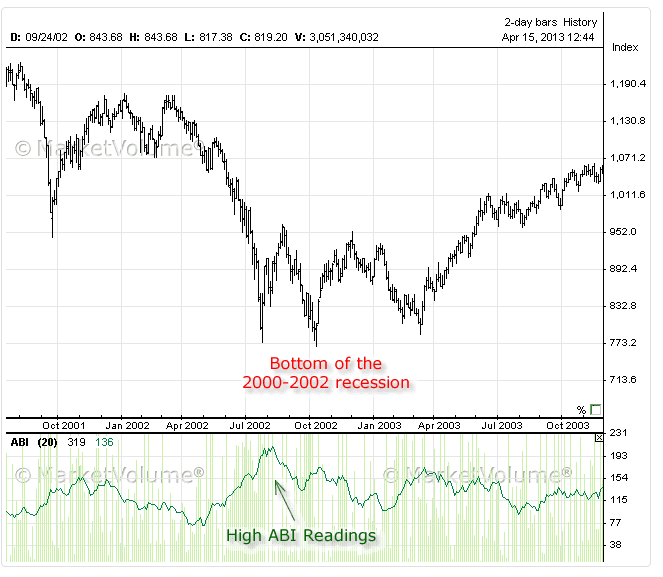
Absolute Breadth Index
The above screenshot is from the site marketvolume.com.
As you can see a spike in the ABI was registered right before a major market low.
The challenge you will face with the ABI is that spikes intraday are tough to gauge when the market will turn. As we stated earlier in this article, timing is everything and as you can see from the major market bottom that started the bulls of all bull markets, it was tough to determine when the bottom was really in.
Let alone trying to determine at 11 am on some random day that the ABI is not giving you the day trader a signal to go short or long.
#6 Your Market Scanner
You were not expecting to see this one, right?
To date these are all market breadth indicators you can find with specific values public to all.
Well, your own market scanner is slightly different. What I mean by this is you need to gauge the market based on your setups and trading plan.
Look at the below screenshot of the market scanner from Tradingsim at 10am, but on two different days.
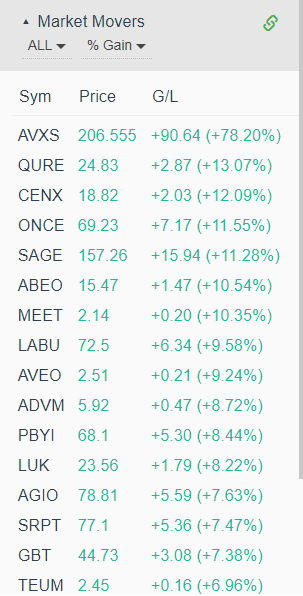
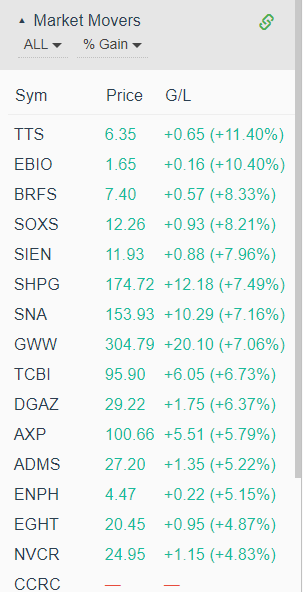
Can you see any material differences between these two lists?
If it’s not jumping out at you, the list on the left has more market movers with higher gains.
So, what does this tell me? Well, this informs me that the market is clearly stronger on the left.
These stocks are relatively close in terms of price, but there will come days where the gainers may top out at 6%. You could go out there and use the same trading approach, but a smaller movers list depending on your style, equals less opportunities.
Using a subjective approach requires you to trade regularly, because you are not looking for a specific reading like in the TRIN or Tick Indexes. You will need to have a feel for when things are off.
#7 Comparing Broad Markets
Similar to comparing the spreads of the futures and spot markets, you can also compare large indexes to one another.
For example, if you see one Index making new highs, while another Index is flat or worst rolling over, this is a clue that the market is losing steam.
This is slightly different than looking at spreads. You are looking to identify when internals of the broad market are starting to differ to call a market turn.
If you are looking for an in-depth study on market spreads, checkout this spreads paper by the CME comparing the SP500 to the DJIA.
It’s interesting to see how closely the price of each index tracks to one another even though the Dow only represents 30 blue chip stocks.
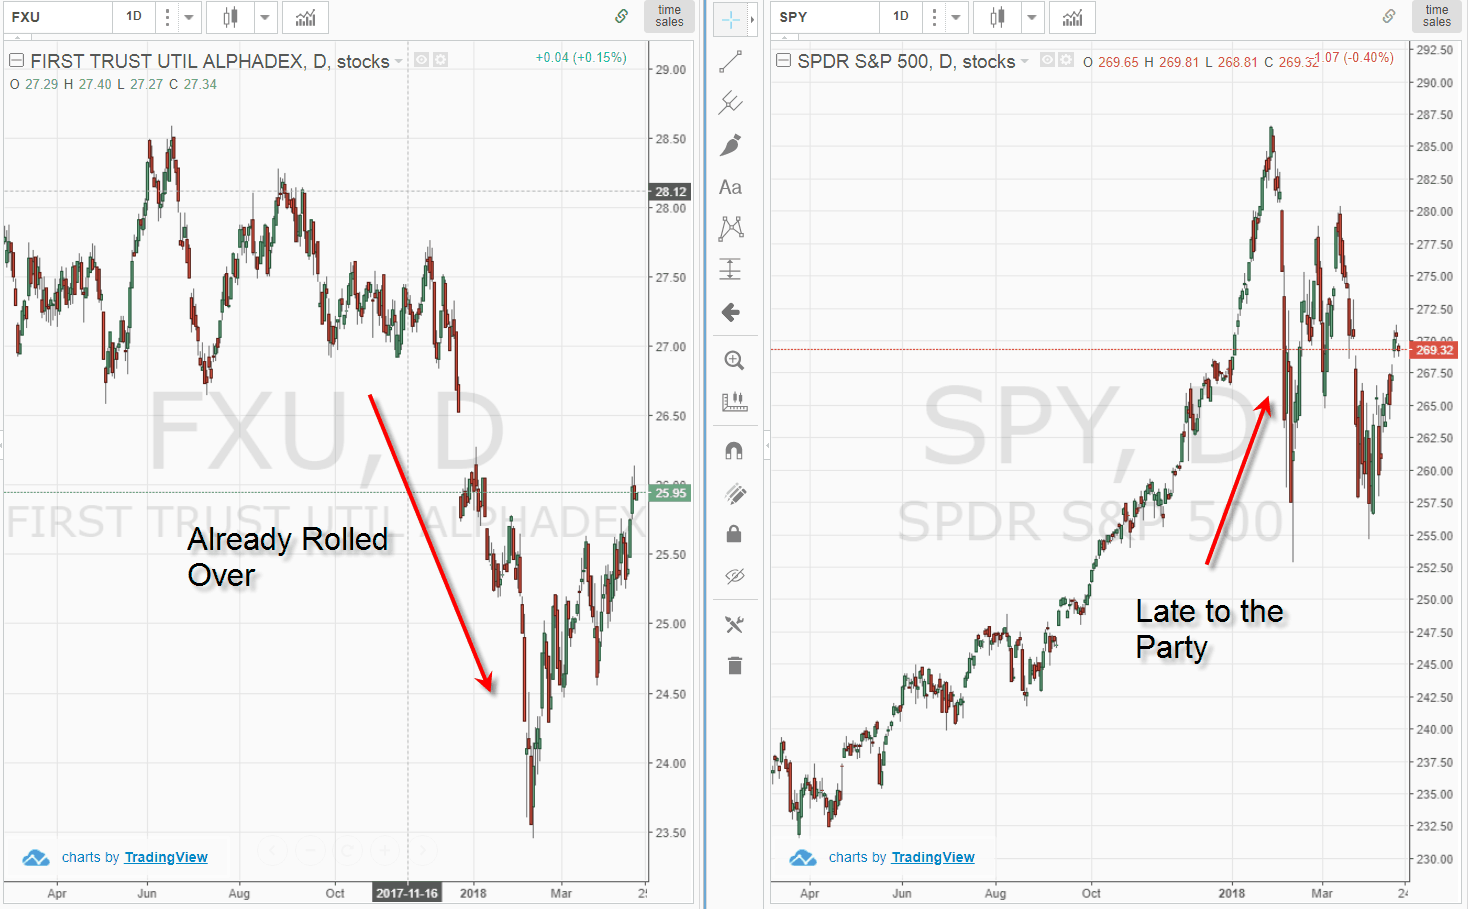
Divergence in Broad Markets
One thing constant in the market is the utilities lead major market shifts. I have seen this in many of the bull and bear markets over the last decade or more.
The recent snap back price action in early 2018 is no different.
If you had been watching any of the Utilities ETFs, you would have noticed these securities were sluggish in November of 2017 and through the early part of 2018.
On the other hand, the S&P and Dow just continued higher as if the party would never end. This difference in price action was an early indication that market internals were weak and likely headed for a turn.
Which Market Breadth Indicator is Best for Day Trading?
We have listed 7 stock market breadth indicators in this article, but they are not created equal.
I wrote an entire article about why I no longer obsess over the broad market. The general theme of that article is that if you are trading the real movers of the day, their news worthy price action will likely supersede anything going on with the market.
Now to talk out of both sides of my mouth, if you are trading volatile stocks, but not the highest flyers of the day, the broad market can and will have an impact on your trading.
But, should you worry about the 7 market breadth indicators here and the other 20+ broad market indicators not detailed in this article? Of course not.
So, let me give you the few market breadth indicators that really matter.
The TICK, TRIN and your own market scanner are all you need.
Why these three?
These three market breadth indicators are great for intraday measurement of market sentiment. The TICK and TRIN track ticks in the market, which represent the panic or excitement in the market.
You want to know that the market is hitting an extreme level which will help you avoid buying in and tops and selling at bottoms.
Lastly, your market scanner. It’s great to have an understanding of the broad market, but there is nothing like knowing your own system.
I look for two types of setups in the market – pullbacks and breakouts.
I have my own scanning filters in place to capture these moves, therefore, when things are off in the market I see it right away.
If you haven’t done so already, observe what your scanner is telling you at certain points of the day.
In terms of the other market breadth indicators detailed in this article, they are great for swing traders and investors.
However, just because the market is turning on a given day, this may have little to know impact on your current trade. It would take a seismic event like the Brexit announcement made while the Nikkei was open for trading for a broad market move to impact your position in a meaningful way.
Remember, you are holding trades for minutes when day trading, not hours, days or weeks.


 Breadth Indicators
