Many of the technical indicators discussed on the TradingSim blog deal with assessing a particular stock or ETF. However, in this article we will cover the tick index, which is a broad market momentum indicator used to gauge the strength of the underlying securities of the NYSE.
The NYSE tick index is important, as it will better position us for when we should enter and exit the markets based on a macro view of price action.
On first glance, the NYSE tick index looks a bit chaotic, but as you learn to interpret the readings, the wealth of information it contains will prove very useful when day trading or swing trading.
What is the Tick Index?
The NYSE tick index measures the short term health of the markets by taking the difference between the number of stocks on an uptick and the number of stocks on a downtick. The tick index sums up this difference for all stocks in the New York Stock Exchange. For example, if there are 2700 stocks on the NYSE and 2000 of them printed an uptick while 700 printed a downtick, the tick index would read +1300.
Are you struggling to make consistent profits in short-term trading? The Tick Index might be your key to success. This powerful tool, used by professional traders on the New York Stock Exchange, provides valuable insights into market sentiment and price movements. In this article, we'll explore how to master Tick Index strategies for effective short-term trading. You'll learn to interpret Tick Index data, develop profitable trading strategies, and apply these techniques across various markets. By the end, you'll have the knowledge to enhance your trading decisions and potentially improve your returns in the stock market.
Key Takeaways
- The Tick Index measures market sentiment by comparing stocks trading on upticks versus downticks
- Combining the Tick Index with other indicators provides a comprehensive view of market conditions
- Real-time NYSE Tick Index data helps traders identify potential support and resistance levels
- Calculating MNQ price per tick is crucial for assessing risks and returns in futures trading
- Adapting Tick Index strategies to different market conditions enhances trading effectiveness across various instruments
How to Use Tick Trading Strategies When Day Trading
If you take a look at the below chart, it will look like a bunch of noise. However, this notice represents extreme extreme buying and selling activity. That extreme buying and selling displayed by the tick warrants caution or even a reversal in the opposite direction.
We want to pay close attention to tick readings of +/-600, +/-800, and +/-1000. We keep an eye on the 600 level as it will signal a possible move to 800 or even 1000.
When we are in a losing day trading long position and the tick reaches +800, think about selling out.
I use readings of +1000 and -1000 to scale out of all long and short positions and even think about going in the opposite direction.
Notice how +1000 and -1000 produced decent intra-day reversals in the S&P 500. The higher the tick readings, the more powerful the reversal signals.

Tick Index
Interpreting Market Sentiment Through Tick Movements
Interpreting market sentiment through tick movements provides valuable information about short-term market trends and volatility. Traders analyze tick data to gauge the overall direction of the market and potential reversals. By observing the number of stocks trading up versus down, traders can identify shifts in market sentiment and adjust their strategies accordingly.
The Tick Index offers insights into market dynamics that are particularly useful for futures contract traders. Extreme readings in the Tick Index can signal overbought or oversold conditions, potentially indicating a reversal in the market trend. Traders use this information to make informed decisions about entering or exiting positions, helping them navigate volatile market conditions:
| Tick Index Reading |
Market Sentiment |
Potential Action |
| Positive Extreme |
Overbought |
Consider Short Positions |
| Negative Extreme |
Oversold |
Consider Long Positions |
| Neutral |
Balanced |
Monitor for Breakouts |
Comparing NYSE Tick, Nasdaq Tick Index, and Dow Jones Tick Data
The NYSE Tick, Nasdaq Tick Index, and Dow Jones Tick Data provide valuable insights for investors trading on different stock exchanges. Each index offers unique perspectives on market sentiment, with the NYSE American and Nasdaq focusing on their respective exchanges, while the Dow Jones Tick Data covers a select group of blue-chip stocks. Traders use these tick indices to gauge overall market direction and make informed investment decisions based on tick size and ticker symbol movements.
Understanding the nuances between these tick indices is crucial for effective short-term trading strategies. The NYSE Tick, for instance, includes all NYSE-listed stocks, providing a broad view of market sentiment. In contrast, the Nasdaq Tick Index focuses on technology-heavy stocks, offering insights into a specific sector. Traders analyze these indices in conjunction with other market indicators to identify potential entry and exit points in their chosen stock exchange.
#1 – Confirming Moves with NYSE Tick Index Data
Since we have covered the power of the tick index to identify market reversals, I want to now focus on how the tick index can be used to confirm the strength of the market. To this point, we will identify tick readings of +1000/-1000 to confirm bullish or bearish sentiment respectively.
Have a look at the image below:
NYSE Tick Index Example
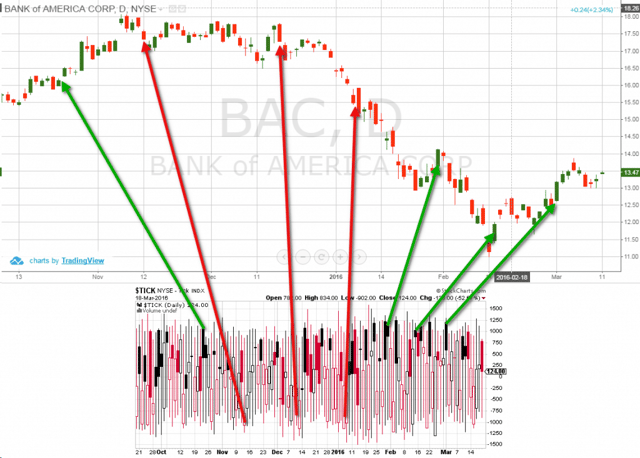
This is the daily chart of Bank of America (BAC), from the period of October 2015 to March 2016. Below the chart you see the NYSE tick index chart. The red arrows indicate tick index readings of -1000, which correlate to BAC price decreases. At the same time, green arrows indicate readings of +1000, which correlate to BAC price increases.
Let’s start with the first green arrow on the left from Oct 21, 2015. On this day, the NYSE tick index registered a reading of +1100. On the same day, BAC increased 1.00%, followed by another 1.00% increase the next day.
The next arrow is red and it indicates a low tick index reading of -1060. On this day, BAC dropped -1.3%.
On the third arrow, the tick index registered a reading of -1145. Meanwhile, Bank of America’s price tanked -2.87%. This decrease is followed by a further price drop of -2.56% the next day. Notice how the price decreases expanded as the NYSE tick index dipped below -1100.
The fourth red arrow registers a reading of -1133 on the NYSE tick index and BAC sees its price drop -4.83%.
In addition, as you can see on the chart, BAC is in a bearish trend at this point.
If you compare the BAC chart with other stocks during this time period, you will notice a bearish trend for the months of December through February.
Just as it appears the entire world is coming to an end, the NYSE tick index registers a solid bullish up day on the fifth arrow.
On this day, the NYSE tick index gives a reading of +1214 (fifth arrow), which is relatively high. At the same time, BAC stock price increases 3.59%.
Then after dropping to $11.00 per share, we see another high tick index reading of +1056 on the sixth arrow; meanwhile, BAC’s price increases 4.18%. This is a turning point for BAC, because it looks like the bearish trend is interrupted.
The seventh and last tick trading strategy example in the image above is a bullish reading on the tick index.
The index registers a reading of +1238. This high reading was also the day BAC’s price increased 4.36%.
To summarize:
We have seven cases on the BAC stock chart, which are confirmed by the NYSE tick index:
Oct 22, 2015: +1.00%, Tick Index Reading +1100
Nov 12, 2015: -1.30%, Tick Index Reading -1060
Dec 17, 2015: -2.87%, Tick Index Reading -1145
Jan 08, 2016: -4.83%, Tick Index Reading -1133
Jan 29, 2016: +3.59%, Tick Index Reading 1214
Feb 12, 2016: +4.18%. Tick Index Reading 1056
Mar 01, 2016: +4.36%, Tick Index Reading 1238
Let’s now take a look at another real-life example.
NYT – NYSE Tick Index Example
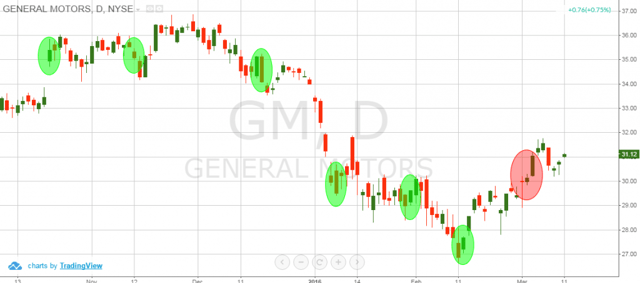
This is the daily chart of General Motors from October 2015 through March 2016. On the chart you see six green circles and one red circle. These are the exact moments and dates we discussed on Bank of America’s chart.
In the green circles, the price action of General Motors mirrors that of BAC. Only in one example, highlighted in red, did the price action not correlate between the two securities.
Are you starting to see how individual stocks move in unison with the broad market? If you understand what is going on at the macro level, you will naturally have greater odds of success with your individual trades.
#2 – Divergence Trading with the NYSE Tick Index Symbol
Bullish Divergence
We have a bullish divergence between the tick Index and a security when the NYSE Tick shows higher bottoms and the chart of the equity shows lower bottoms. After a bullish divergence between the ick indicator and the stock chart, the price of the security is likely to exhibit a bullish move. In many cases, the reversal is rapid.
Bearish Divergence
When an equity price closes with higher tops and the tick index has lower tops, this is a confirmed bearish divergence. The bearish divergence between the tick and the stock chart signals a potential downward price move.
Discovering divergence with the NYSE tick index is a leading indicator before the actual event occurs. Thus we can position ourselves in the market prior to the start of a potential price move.
Tick Index Divergence Example
Bullish Divergence – Tick Index
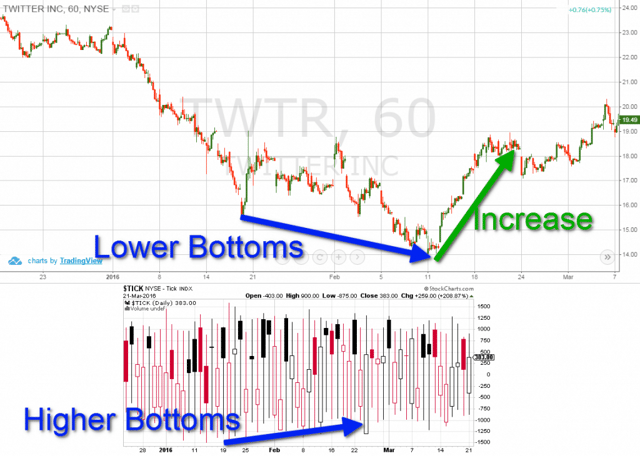
Above is the hourly chart of Twitter from December 2015 through March 2016. Below the chart, we have the NYSE tick index for the same period of time. The image illustrates a bullish divergence between the tick index and Twitter.
Notice that for the period January 19, 2016 through February 11, 2016, Twitter has lower bottoms. For the same time period, the tick index has higher bottoms. This confirms a bullish divergence between the price of Twitter and the tick index.
After the bullish divergence is confirmed, we see that Twitter experiences a rapid short squeeze. This squeeze lasts for 8 days and results in Twitter’s stock increasing a whopping 35.56%!
This type of move is rare, but it illustrates the power the broad market can have on a stock that is oversold relative to the entire market. Assuming a stock like Twitter is not headed for the woodshed, the price action of the stock will return to equilibrium with the overall market.
Let’s now review a bearish divergence example.
Bearish Divergence – Tick Index
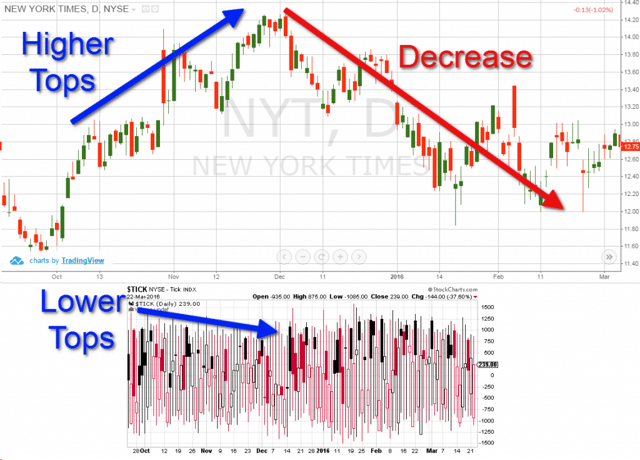
This is the daily chart of the New York Times (NYT) from October 2015 through March 2016. The chart is supported by the NYSE tick index in the bottom of the image over the same time period.
The New York Times stock chart shows higher tops form October 2015 through December 2015.
For the same time period, the NYSE tick index indicates lower tops. This confirms a bearish divergence between the tick indicator and the New York Times price chart.
As a result, in the beginning of December, the NYT price begins to decrease.
Over the next 45 days, the New York Times drops 17%. While this is smaller than the price run up of Twitter, it is still sizable.
Rules when Trading with the NYSE Tick Indicator
First, never to rely solely on the tick index. Make sure you always confirm your tick signals with an additional trading indicator.
Secondly, the more periods you take into consideration on the tick index, the more reliable the signals. Let’s take the tick divergence as an example.
If one day the tick index registers a high reading, while the price of a security is decreasing, we have a bullish divergence. However, daily discrepancies are likely occurrences and shouldn’t be given too much weight.
Now, imagine if the price of the security is decreasing for a longer period of time and at the same time the tick index is steadily increasing.
In this case, due to the longer periods of divergence, there is a greater likelihood the security will experience a short squeeze at some point.
If you are trading a security based on a tick index signal, make sure you confirm the price behavior with another stock in the market. This way you can validate the security is performing relative to its peers and not experiencing some sort of anomaly.
Essential Tools and Data for Tick Index Strategies

Effective Tick Index strategies rely on essential tools and data. Traders access real-time NYSE Tick Index live data, utilize DAX tick charts, and analyze Dow Jones tick-by-tick information to gauge market momentum. Calculating MNQ price per tick and Micro E-Mini Nasdaq tick value helps assess risk and potential returns. These tools provide valuable insights for navigating the stock market and managing currency positions.
Accessing Real-Time NYSE Tick Index Live Data
Accessing real-time NYSE Tick Index live data is crucial for traders utilizing this technical indicator in their short-term trading strategies. This live data provides up-to-the-minute information on market sentiment, allowing traders to make informed decisions based on current market conditions. Real-time NYSE Tick Index data serves as a valuable tool for identifying potential support and resistance levels in the broader market.
Traders can access this essential data through various platforms and tools designed for professional market analysis. These platforms offer features such as customizable charts, alerts, and historical data comparisons, enabling traders to develop sophisticated strategies based on tick index movements. When combined with other technical indicators, real-time NYSE Tick Index data enhances a trader's ability to navigate the complexities of short-term trading:
- Provides instant market sentiment insights
- Helps identify potential trend reversals
- Supports decision-making for entry and exit points
- Enables rapid response to changing market conditions
Utilizing DAX Tick Charts and Dow Jones Tick by Tick Information
DAX tick charts and Dow Jones tick-by-tick information provide valuable tools for swing trading strategies. Traders analyze these charts alongside the relative strength index and MACD indicators to identify potential entry and exit points. By focusing on tick-by-tick data, traders gain insights into market maker activities and short-term price movements, enabling them to make informed decisions based on real-time market dynamics.
Incorporating DAX tick charts and Dow Jones tick-by-tick information into trading strategies allows traders to assess market capitalization trends and overall market sentiment. This granular approach to market analysis helps traders identify subtle shifts in buying and selling pressure, potentially leading to more accurate trade executions. When combined with other technical indicators, these tools enhance a trader's ability to navigate short-term market fluctuations effectively:
| Tool |
Application |
Benefit |
| DAX Tick Charts |
Short-term price analysis |
Identify micro-trends |
| Dow Jones Tick-by-Tick |
Real-time market sentiment |
Gauge buying/selling pressure |
| RSI + MACD |
Momentum confirmation |
Improve entry/exit timing |
Calculating MNQ Price Per Tick and Micro E-Mini Nasdaq Tick Value
Calculating the MNQ price per tick and Micro E-Mini Nasdaq tick value is essential for traders engaged in scalping strategies within the financial market. The MNQ, or Micro E-Mini Nasdaq-100 futures contract, represents a fraction of the full-sized contract, making it accessible to a broader range of traders. By understanding the tick value, traders can accurately assess potential profits and risks associated with each price movement in this security.
Traders utilize heat maps and other analytical tools to visualize tick data and make informed decisions when trading Micro E-Mini Nasdaq futures. The tick value, which represents the minimum price fluctuation, plays a crucial role in determining position sizes and stop-loss levels. By mastering the calculation of tick values, traders can develop more precise risk management strategies and optimize their trading performance in the fast-paced world of securities trading.
Trading With DAX Tick and DAX Tick Charts
Traders utilize DAX tick charts to implement effective short-term trading strategies, combining fundamental analysis with technical indicators like Bollinger Bands. These charts provide a detailed view of price movements, allowing traders to identify key supply and demand zones and make informed decisions based on market dynamics. The length of the trading strategy often depends on the trader's analysis of DAX tick patterns and their interpretation of market conditions.
Successful DAX tick trading strategies incorporate multiple timeframes and indicators to confirm trends and potential reversal points. Traders analyze the relationship between tick data and price action, using this information to fine-tune their entry and exit points. By adapting their strategies to changing market conditions, traders can optimize their performance and manage risk effectively in the fast-paced DAX futures market.
Frequently Asked Questions
How does the tick index help in short-term trading decisions?
The tick index measures market sentiment by comparing advancing to declining stocks. Traders use it to identify potential short-term trend reversals, overbought or oversold conditions, and confirm price movements. A high tick index suggests bullish sentiment, while a low index indicates bearish sentiment.
What tools are essential for implementing tick index strategies effectively?
Essential tools for implementing tick index strategies include real-time market data feeds, advanced charting software, automated trading platforms, and backtesting tools. Traders also need reliable order execution systems, risk management software, and analytical tools to assess market liquidity and volatility.
Can tick index strategies be applied to different financial markets?
Tick index strategies can be applied to various financial markets, including stocks, futures, and forex. These techniques analyze price movements at specific intervals, helping traders identify trends and potential entry or exit points across different asset classes and timeframes.
What are some advanced techniques for mastering tick index strategies?
Advanced tick index strategies involve analyzing market depth, identifying trend reversals, and utilizing multiple timeframes. Traders can combine tick index readings with volume analysis, price action patterns, and other technical indicators to improve entry and exit timing. Backtesting and continuous refinement of strategies are crucial for mastering tick index techniques.
How can traders improve their short-term trading using tick index?
Traders can improve short-term trading using the tick index by monitoring market sentiment. This indicator tracks the number of stocks trading up versus down, helping identify overbought or oversold conditions. By analyzing tick index patterns, traders can make more informed decisions about potential market reversals and entry or exit points.
Conclusion
- The NYSE tick index is used to confirm potential price moves of the broad market.
- The tick index can also be used to confirm divergences in stocks.
- Values of +800 and above or -800 and below are considered strong and reliable.
- Before you start using the tick index to assist your trading system you should remember:
- The tick index is not a standalone indicator.
- The more periods you use as a signal on the tick chart, the more reliable the reading.
- If you want to take a trade based on a signal from the tick index, make sure you check the behavior of other stocks before placing any trades.


 Awesome Day Trading Strategies


