Breadth Thrust Indicator Overview
Dr. Marty Zweig, a Wallstreet legend is the creator of the indicator.
The Breadth Thrust indicator measures market breadth by dividing the advancing issues by the sum of the advancing and declining issues on the New York Stock Exchange. The output of this calculation is a ratio is then calculated over the last 10 periods to give you the value of the indicator.
Breadth Thrust Indicator Formula
#Advancing Securities/ (#Advancing Securities + #Declining Securities)
Primary Methods
The indicator can work as an intermediate timing tool and it can also identify long-term buying opportunities.
Why is the Indicator So Popular?
Dr. Zweig was known for combining both fundamentals and technical analysis when making market forecasts. Zweig used the Breadth Thrust indicator to pinpoint major shifts from a bear to a bull market.
The Trigger
The Breadth Thurst indicator is oversold below 40 and overbought above 61.5. When the indicator is able to move from 40 to 61.5 in less than 10 days, this is a sign of a major shift to the long side in the market.
This bullish signal is so popular, it is covered by major financial news outlets, in the same manner, these shows report when the market breaks the 200-day moving average.
How Does the Breadth Thrust Indicator work?
Unlike other oscillators, the indicator focuses on the rate of change from oversold to overbought.
Zweig theorized that a rapid rate of change of money from bear to bull increases the likelihood stocks will push higher over the long-term.
1984 to 2009
There were no signals for 25 years (1984 through 2009). This is undeniable proof this signal is for long-term moves.
Do you think you can wait that long for a trade signal? Make sure you set up an auto alert. Who can remember to look for a signal every day for 25 years!
The signal finally showed up after the 2008 global financial crisis and the market hasn’t looked back since.
The chart below shows this major market bottom that was called by the Breadth Thrust indicator.
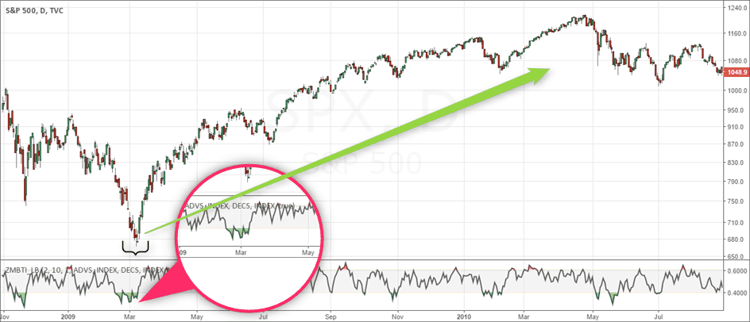
Zweig Breadth Thrust Indicator gives a major signal in March 2009
The indicator made the move in just eight trading days.
Another Major Buying Opportunity Example
In addition to identifying market bottoms, the indicator can also inform investors when they should stay long in the market.
During October 2015, the markets were in a state of uncertainty with the China slowdown and the possible tightening from the U.S. Federal Reserve. Some investors viewed this data as a reason for trimming their exposure to equity markets.
However, the Breadth Thrust indicator was giving a different trade signal.
The chart below shows the period between September and October 2015. As the market put in a double bottom, the indicator also gave a buy signal.
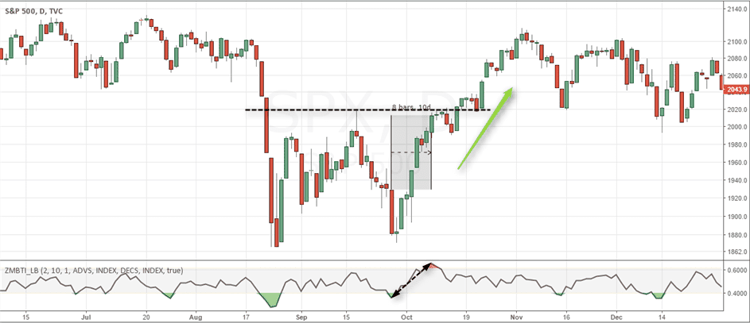
Zweig Breadth Thrust Indicator, September 2015
Within a span of 8 trading days, the indicator shot up from below 0.40 to above 0.615 – signaling a buy. The S&P500 rallied nearly 4% before stalling near the 2100 level.
How To Use the Market Breadth Indicator to Validate Trend Strength
The market breadth indicator can also help validate trends and turning points in the market.
To better understand how to use the market breadth indicator as a confirmation tool, let’s look at an example.
Below is the S&P500 with an overlay of the 50 and 200 period moving averages.
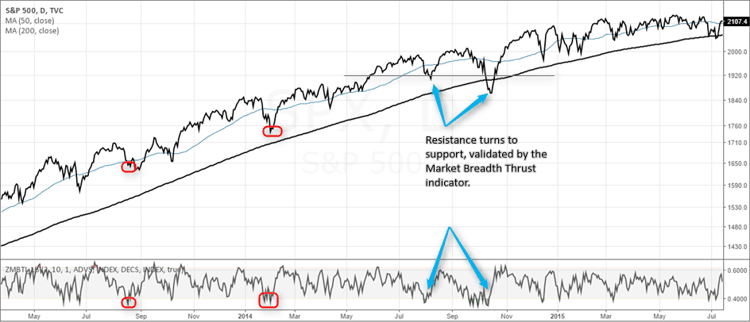
Zweig Breadth Thrust indicator as a market confirmation tool
Two Trade Signals
First, when the market slips below the 50-day moving average, you wait for the Breadth Thrust indicator to trend up again to validate the buy signal.
Next, you can identify support on the chart and then look to the indicator to validate if the support will hold. Please see in the above chart how previous resistance later turns to support.
The indicator then gives a major buy signal after briefly penetrating the level.
Should Day Traders Use the Signal
Since the indicator has such a long-term perspective, day traders should not obsess over watching the ratio.
However, once day traders see the sign of strength, they will want to utilize more of their long strategies as there are greater opportunities on the bull side.
In Summary
Between 1945 and 2000, the indicator signaled fourteen buy signals.
The average gain for each signal was 24%!
The question now is will the indicator continue to provide accurate forecasts for turning points in the market and will the average gain continue at these levels?
Key Takeaways [Updated June 2026]
- The Breadth Thrust Indicator was developed by Dr. Martin (Marty) Zweig to identify major market bottoms and the start of new bull moves.
- It is calculated as a 10-day moving average of advancing issues divided by the sum of advancing plus declining issues on the NYSE.
- A classic buy signal fires when the indicator moves from below 0.40 to above 0.615 within 10 trading days, a rare 'thrust' of broad buying.
- Historically these signals have been uncommon but powerful, with strong average gains documented in the period after they occur.
- Because the classic signal is rare, traders often use breadth thrust as a confirmation tool alongside other indicators rather than as a standalone system.
Frequently Asked Questions
What is the Breadth Thrust Indicator?
It is a market-breadth momentum indicator created by Marty Zweig that measures how quickly buying pressure broadens across the market, used primarily to spot major bottoms.
How is the Breadth Thrust Indicator calculated?
Divide NYSE advancing issues by the total of advancing plus declining issues, then take a 10-day simple moving average of that ratio.
What triggers a Zweig breadth thrust buy signal?
The signal occurs when the 10-day average rises from under 0.40 to above 0.615 within 10 trading days, reflecting a sudden, broad surge in buyers.
How reliable is the breadth thrust signal?
Historically it has been rare but highly accurate at marking turning points, with strong average forward returns. Like any indicator, it is not infallible and works best with confirmation.
Can I use breadth thrust for day trading?
It is primarily a market-timing tool for intermediate-term bottoms rather than intraday signals, but day traders use it to gauge whether the overall market provides a tailwind.
Related TradingSim Guides


 Day Trading Indicators


