Best Strategies for Trading with the Advance Decline Ratio
Jun 23, 2011
Written by: Al Hill
✓ Reviewed by Kunal Vakil, Co-Founder of TradingSim · Updated Mar 31, 2026
The advance/decline ratio (A/D ratio) shows the ratio of advancing issues to declining issues. The A/D ratio is similar to the advance/decline line, except instead of subtracting the advancing and declining issues, it divides these two inputs. The benefit of using the advance/decline ratio is that it is a constant number, versus the advance decline line, which will constantly trend higher as new stocks are added to the New York Stock Exchange. Below is the formula for calculating the advance decline ratio.
Advance Decline Ratio Formula
Advancing Declining Issues
Interpreting Advance Decline Ratio
Interpreting the advance-decline ratio indicator can prove to be a difficult task. The ratio will move erratically and on quick glance it is a bit challenging to make clear observations about the health of the market. A popular technique is to place a moving average of the A/D ratio to assess the direction of the technical indicator. The average of the indicator will begin to oscillate back and forth and will provide clues as to whether the market is oversold or overbought. The A/D ratio will never have a negative value. Traders can use the following values for estimating the trend of the market:
A/D ratio > 1.25 bullish
A/D ratio is between 0 and 1, bearish to choppy market
A/D ratio > 2 extremely bullish
Advance-Decline Ratio Charting Example
Advance-Decline Ratio
Above is the chart of the advance-decline ratio.
The line of the ratio fluctuates from an overbought to an oversold area. The arrow on the chart indicates how the price reacted to each overbought and oversold signal.
As you see, the advance-decline ratio indicator was able to predict short-term price moves of the S&P 500 pretty accurately.
Advance-Decline Ratio Indicator
The advance decline ratio line calculation attaches to the bottom (or the top) of the chart. Again, it consists of a single line.
The important level of the indicator is between 1-2.5 depending on the prior AD values. When the AD indicator starts trending above the average level, this indicates a bullish trend.
When the line stays below the average level, a bearish trend is present.
advance decline indicator
Above we have the 5-minute chart of Pandora Media from February 22-23, 2016. The average level here is the 2.5.
The image illustrates two tendencies. The first one is bullish and the second one is bearish. See the behavior of the AD Indicator during both trends. When the trend is bullish the AD line constantly breaks the 2.5 level. The line doesn’t stay above 2.5 for a long time, but it constantly creates impulses above and below the level. When the trend is bearish, the AD line simply stays below 2.5.
Trading with the A/D Line Indicator
Next we will go through a few basic entry and exit rules, which will assist your decision modeling process.
Tip#1 – Open Trades with the Advance-Decline Ratio Indicator
The rules for opening long and short trades with the AD indicator are different. The reason for this is the inconsistent behavior of the indicator during bullish and bearish trends.
Long Positions
You should open a long trade every time the advance-decline ratio indicator crosses the average level line upwards and stays above for at least 3 periods. When you see a bullish interaction with the average AD level, followed by 3 periods above, simply buy the stock.
Short Positions
You should open short trades, when the AD indicator line breaks the average level downwards and stays underneath for at least 10 periods. This way you will distinguish the bullish trends where the AD line fluctuates above and below the average level from the bearish trends when the AD line is flat below the average level area.
Tip #2 – Close Trades with the Advance-Decline Ratio Indicator
Closing Long Trades
Long trades should be closed when the AD Line goes below the average level and spends at least 10 periods underneath.
Closing Short Trades
You should close a short trade every time the AD line goes above the average level and stays there for at least 3 periods.
If you have noticed, the open and close position rules are mutually reinforcing. This means that each of these two rules triggers the other. In this manner, advance-decline indicator trading is constantly holding you in the market. Therefore, you should first consider if this trading style is suitable to your personality as a trader.
Tip #3 – Advance/Decline Indicator Trading Strategy
Now we will apply the rules we discussed above into a real trading example. Have a look at the image below:
advance-decline ratio and price decline
You are looking at the 5-minute chart of Apple from February 23, 2016. Below we have attached the AD Indicator. The image illustrates a short trade, which places us in the market during a whole trading session. The average level which the indicator gives us is 2.0
First we start with the market opening, which begins with a bearish gap at the opening bell. At the same time, the advance-decline ratio indicator switches below 2.0.
The Apple stock extends losses afterwards. Ten periods after the market opening we see the stock declining. Meanwhile, the AD indicator line is still below 2.0, which gives us a short signal. Fifty minutes after the market opening we are short on Apple.
The AD line decreases lower and holds its position below 2.0. In the middle of the trading session, the AD line starts increasing.
In the yellow circle, you will see the moment when the line breached the 2.0 level upwards. However, the AD line did not manage to stay above 2.0 for 3 periods or more. Therefore, we disregard the signal and we keep our trade open.
The AD line does not break the 2.0 level during the entire day. Therefore, we are forced to close our trade a few minutes before the market closes, because we are day trading.
Let’s now review a long trade with the advance/decline stock indicator.
long advance-decline ratio trade
Now we are looking at the 5-minute chart of Netflix from May 25.
The average level displayed on the advance-decline line chart is located at 2.0.
The image starts with the AD line switching above 2.0 for a few periods. However, after each of the interactions with the 2.0 level, the AD did not manage to stay above for 3 periods. Therefore, we disregard these signals.
The third time the AD line crosses above the 2.0 level, the indicator manages to stay above for 4 periods.
We open a long trade after the third period. As you see, the price starts increasing.
Meanwhile, the AD indicator starts fluctuating above and below the 2.0 level. Yet, the first 4 attempts the line doesn’t manage to stay below 2.0 for at least 10 periods. Therefore we disregard these as exit signals.
Our real exit signal comes when the AD line stays for more than 10 periods below the 2.0 level. This happens a couple hours after we bought NFLX. This is when we should close our trade and collect our profit.
Tip #4 – Advance/Decline Indicator + TRIX
Now, let’s discuss another indicator you can trade with the advance-decline ratio indicator – the TRIX (Triple Exponential Average) oscillator.
The TRIX indicator consists of a single line, which fluctuates below and above a zero level. We will use the TRIX to confirm entry signals which come from the advance-decline stock indicator.
When we get a long signal from the AD tool, we will first need to see the TRIX above the zero level in order to go long. Contrary to this, if we get a short signal from the AD, we will first need to see the TRIX line below the zero level in order to go short.
In this manner, the TRIX is used as a validation signal for entering trades. The exit signal stays the same. We will only use the AD tool to identify closing signals. Let me now show you how the advance decline trading strategy works.
advance-decline ratio and TRIX
Above is the 5-minute chart of Yahoo from November 18, 2015.
The average level of the advance-decline chart is located at 2.0, so this is what we will use as a trigger line.
The image starts with a price increase. Meanwhile, the AD tool has an impulse move above the average level at 2.0. However, the line only stays above for a few periods and as you know, we need at least 3 periods in order to consider this a valid long signal.
Furthermore, the TRIX line is below the zero level at this point.
Six periods later, the TRIX line crosses the zero level upwards.
One period later, the AD line crosses above the 2.0 level and we start to count the periods.
Fifteen minutes later (3 periods), the AD line is still above 2.0. The TRIX line holds its position above zero and is steadily increasing.
Therefore, we realize this is our long signal and we buy Yahoo as shown on the image.
YHOO then begins to increase. The TRIX line also increases following the price action.
However, the advance-decline line hops below the 2.0 level. According to our strategy, we need to see the AD line below the average level (2.0) for at least ten periods before we exit our trade. For this reason, we start to count every finished period starting from the moment the indicator flipped below 2.0. For 9 periods, the AD line stays below 0.0 and then it switches above. For this reason, we keep holding our trade.
Almost an hour later, we are forced to close our long position due to the end of the trading session.
After all, we are day trading and we need to close all trades during market hours.
Conclusion
The advance/decline ratio shows the ratio of advancing issues to declining issues.
The advantage of the AD ratio is that it is a constant number
The advance-decline ratio indicator formula is: advancing issues / declining issues
The following values could be used for calculating the market’s trend:
A/D ratio > 1.25 (bullish)
A/D ratio is between 0 and 1 (bearish choppy market)
A/D ratio > 2 (extremely bullish)
A good AD tool for trading single stocks is the advance/decline indicator. Its basic signals are:
Go long and close short positions when the AD line switches above the average value and stays for at least three periods there.
Go short and close long positions when the AD line switches below the average value and stays there for at least ten periods.
A good oscillator to combine the AD indicator with is the TRIX. It will assist the entry confirmation when trading with the Advance/Decline indicator:
Go long when you get the respective signals from the AD indicator, only if the TRIX is above zero.
Go short when you get the respective signals from the AD indicator, only if the TRIX is below zero.
Alton Hill is the Co-Founder of TradingSim with over 18 years of trading experience. He completed the Design Thinking Bootcamp at Stanford’s D.School and brings expertise in Product Development to create the best trading simulation experience. His strategy focuses on trend-following systems, targeting high-volatility stocks with strong primary trends using the 15-minute chart.
Bear Trap – Best Strategies to Profit from Short Squeezes
Have you ever felt the devastating market force of a bear trap? The all but certain bullish trend stops abruptly and a trend reversal begins. Then you say, “Hey, let’s catch that drop!” and you...
Andrews Pitchfork Indicator – 4 Top Trading Strategies
The Andrews pitchfork indicator, commonly referred to as ‘median lines,’ is one of the most versatile trading tools available. We will explore the basics of the indicator and strategies you can use...
Sharpe Ratio – 6 Things You Need to Know [Updated May 2026]
In this article, I will cover the Sharpe ratio indicator and if it’s something you can use to track your trading performance. While this ratio is often used for institutions, you can also use it to...


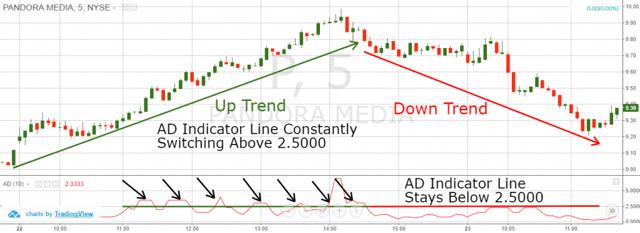
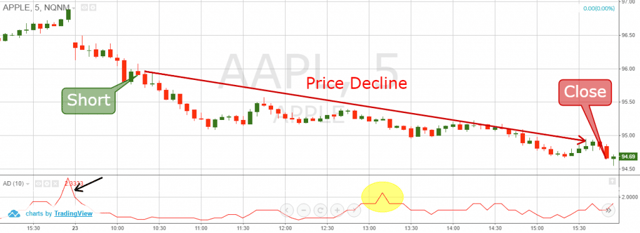
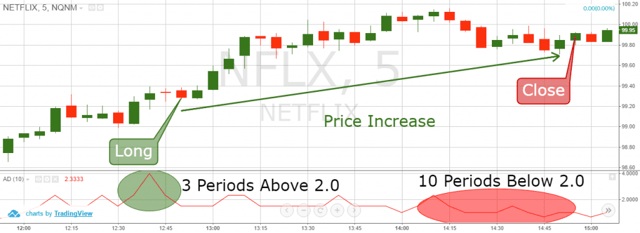
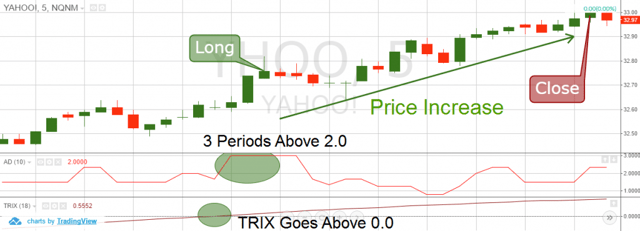


 Chart Patterns


