✓ Reviewed by Kunal Vakil, Co-Founder of TradingSim · Updated Mar 29, 2026
When you start out in the trading game, you often will hear a number of pearls of wisdom. Keep your losses small, let your winners run, no one ever went broke taking profits. These anecdotes make trading sound so easy. One of the biggest reasons for so many losing traders on Wall Street is the fact they take profits too early. If you continuously take profits before you let your harvest come in, you will go broke.
Example of taking profits
First off trading is a game of odds. Anyone that tells you otherwise is either delusional or not a seasoned veteran. Since it is a game of odds, much like a casino, the only way to win is to have your winners be bigger than your losers and to have more winners. This sounds simple enough, but remember when you are wrong, you are not only in a losing trade, but you also have to pay commission. For day traders, this fact is all to critical to your bottom-line as you are looking for relatively small price fluctuations to make a profit. So, how do people go broke taking profits? Let’s say Trader A purchases 200 shares of MSFT at $50 and pays 4 dollars in commission. The stock runs up to $50.25 and Trader A sells for a quick half of a percent gain. This sounds easy enough right? Well Trader A then puts on a short of 1000 ATVI at $10, but the stock quickly rallies and Trader A has to cover for a half of a percent loss. Trader A invests 10k on all of his transactions, but since the ATVI trade commissions are $16 dollars due to the 1,000 share lot. So, while the percentage gain/loss for the MSFT and ATVI trades are exact, Trader A will actually be down $12 bucks on these trades due to the commission costs.
Grinding Cycle
I know this all sounds really simplified, but what ends up happening over a 1-month period, is that you will end up grinding it out and not having any breakthroughs in your trading profits. This grinding cycle leads to stress and poor trading habits. You as a trader have to determine some method or means of allowing yourself to stay in winning trades, while limiting your risk. Trader A in the above example sold out the minute a half of a percent target was hit, but what if the stock was preparing for a move to $52, or $55? The answer to this question is that you don’t know. But what you do know is that trading is a numbers game much like the casino, so if you structure your strategy to allow you to eat the big winners (whatever a big winner means to you), you will be able to achieve much greater success than to constantly sell a stock for the simple fact you have made a profit. If you get one thing out of this article, you must remember that you only sell a stock when you have a predetermined reason for doing so. Never sell a stock just to take profits, remember your security could end up going much higher.
Take Profit Money Management
Before entering any trade, you should have your profit target in mind. You simply cannot stay in a trade forever, especially as a day trader.
In this portion of the article, we are going to explore a number of profit taking strategies based on market conditions.
Trend Lines – Profit Taking Strategy
A traders dream is to catch a stock as it is trending. Trending price movement allows you to effectively reap solid returns, without much headache of volatility.
For trending stocks, there are really two ways to trade the setup. The first is to open a position in the direction of the primary trend and sell when the price breaks the primary pattern.
The other option is to enter a trade when the price bounces back in the direction of the primary trend and exit once the stock begins a counter move. This buying and selling approach allows us to maximize the profit potential of a trending stock as you capture the minor moves within the larger trend.
So, how exactly do we place the trades?
Taking profit when the price breaks the trend:
Again, one strategy for when to take profits is to identify a trending stock and hold your position until the primary trend is broken.
Hold Strategy
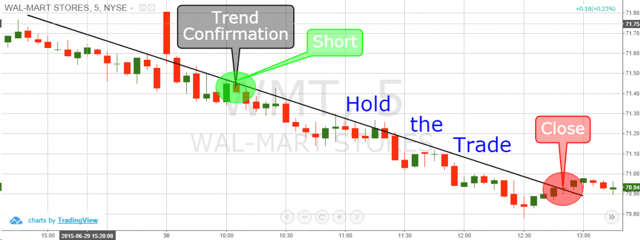
This is the 5-minute chart of Wal-Mart Stores for the period June 29-30, 2015. The black bearish line shows the resistance level of the downtrend. As you see, the trend starts on June 29; however, the market was closing in an hour, so we do not open the short position. The next day, Wal-Mart rolls over after a bullish gap up, thus reconfirming the strong downtrend.
At this point, we open a short position and hold Wal-Mart until the stock is able to close above the black line, which is almost three hours later with a profit of 48 cents per share.
Taking profit at the end of each move in the direction of the primary trend:
I know what you are thinking, “I can make more money because I am trading all of the minor moves within the larger trend.” Well, yes and no. The reality is that placing more trades does not always equal more profit. Remember, every time you place a trade, you are risking your capital.
Back to the trading strategy, you essentially allow the stock to hit the resistance or support of the primary trend and then open a position in that direction. So for example, in our previous Wal-Mart trade, you would short Wal-Mart every time the stock approaches the black line and then exit that short once the momentum in the stock began to taper off.
Trade Minor Moves
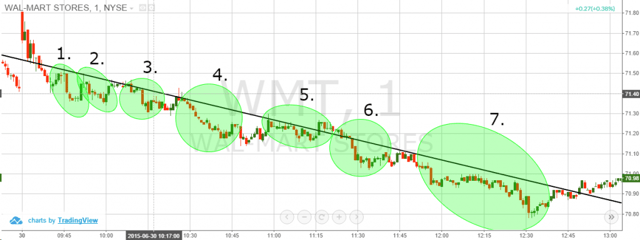
Above is the same Wal-Mart stock from the period June 29-30, 2015; the one difference is the chart time frame. For this example, we are illustrating the 1-minute chart in order to better identify price action as Wal-Mart interacts with the black line.
As you see, the downtrend is divided into 7 different trending moves, which all present trading opportunities. For this trading example, we will short Wal-Mart every time it fails at the black line and then exit our short once we see a counter trend candlestick pattern develop.
First 5 Trades
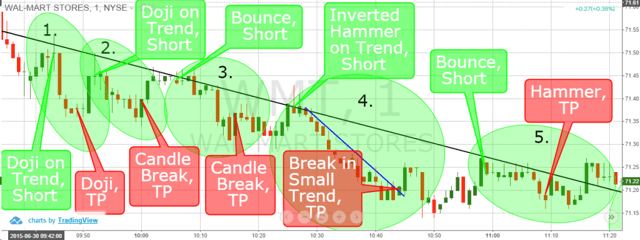
The above chart illustrates 5 trading opportunities for this one move in WMT. Below I have provided the rationale and details for each trade:
In the first circle, we receive our trend confirmation. The price touches the trend line and develops a doji candle. At this point, we short Wal-Mart and just 4 candles later two doji candlesticks print in a row. Since the doji candle has a strong reversal characteristic, we exit the trade.Profit: $0.12 per share
The price then has a counter move back to the black line and once again prints a doji candlestick at resistance. We know what to do here, right? We short WMT. The price starts another bearish trending move. We take profits the moment we see a candle closing above the previous one.Profit: $0.05 per share
Then we see a slight consolidation around the resistance line. We short WMT with the first bearish candle on the trend, because this is considered a bounce from the trend. Again, our signal to take profits occurs when the candlestick closes above the previous bar.Profit: $0.06 per share
For our next trade, the price suddenly displays an inverted hammer candlestick pattern at the trend line. The inverted hammer has a reversal characteristic, which means that it is the perfect short signal in our case and we open a position. We take profits when the price closes above the small bearish trend (blue line).Profit: $0.16 per share
Since we are out of the market now, we need another price interaction with the bearish trend in order to enter the market. This happens 15 minutes later when price touches the trend line and prints a bearish candle. This is a bounce from the trend line and we short WMT again. The price starts consolidating afterwards. Notice that there are more than two bullish candles in a row here. Nevertheless, we stay in the trade since these candles are on the trend line and there is no point in closing the trade early. Suddenly, WMT decreases sharply and after two red candle bars, we spot a Hammer candlestick and we exit the trade.
Profit: $0.05 per share
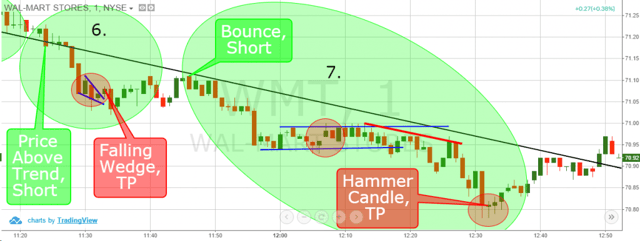
Let’s now switch to trades 6 and 7:
Trades 6 and 7
6. After a short hesitation below and above the bearish trend, price switches again below the trend. We short WMT with the first bearish candle, which closes below the trend line. A few candles after we enter the market, we spot a falling wedgechart pattern. The price closes a candle outside the wedge, which is our signal to take profits. Profit: $0.10 per share
7. The next interaction with the bearish trend comes 13 minutes later. We short WMT with the first bearish candle after the price touches the trend. A decrease appears afterwards. Notice the first red circle of trade 7 (second red circle on the chart); two bullish candlesticks develop in a row. Nevertheless, we stay with the trade since there is resistance at the blue line. Sure enough, this patience pays off and the stock breaks down. The last red circle in the chart displays when another cluster of consolidation candlesticks form and we exit the trade based on this development. Profit: $0.27 per share
The total outcome from this profit taking strategy is $0.81 (81 cents) per share.
Which Profit Taking Strategy is best for Active Trading?
The results are clear; trading the minor moves, we made a total of $0.81 per share, which is nearly 70% better than the holding, the stock until the equity breaks the primary trend.
Again, trading minor moves within a trend requires years of practice and with the increased number of trades, you only need one to go wrong to give back these additional profits.
Channels – Profit Taking Strategy
We will now shift gears to discuss a profit taking strategy using price channels.
Both strategies have the same entry point system – buy the equity when the price bounces from the lower level of the channel; however, the exit strategies are slightly different.
The first strategy suggests exiting a position once price touches the upper channel.
The second strategy calls for you to exit a position after price touches the upper channel and produces two bearish candlesticks. Why the two extra candles? There is a possibility that the stock could breakout above the channel and this would allow us the opportunity to capture additional gains from an impulsive move higher.
Let’s look at a real-world example to see which system fares better.
Take profits when the price hits the upper channel level
This is probably the most common and at the same time effective channel profit taking system. One should hold his trade in the channel until the price touches the upper level.
Trend Channels and Profit Targets
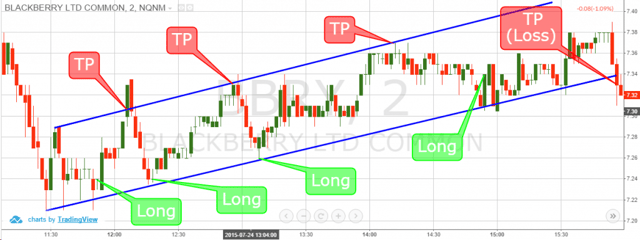
This is the 2-minute chart of Blackberry from July 24, 2015. As you see, the blue lines on the chart indicate a clear bullish channel with four long positions inside. Let’s measure the results of this profit taking strategy:
4 long positions
3 successful; 1 fail
Profits:
$0.06 per share
$0.09 per share
$0.11 per share
-$0.01 per share (loss)
Total Profit: $0.25 per share
Taking profits after touching the upper channel level + two bearish candles
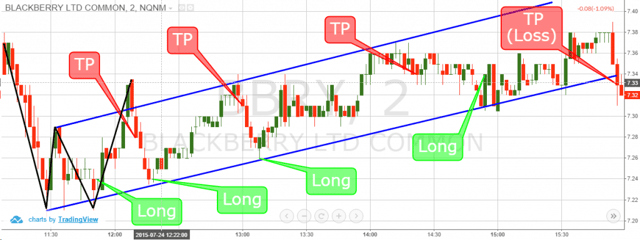
We applied this strategy on the same chart in order to see the difference. Notice that the exit signals are different from the previous image.
Trend Channels and Profit Targets – 2
The only time the price breaks the upper level of the channel is during the first trade. However, the bullish break is unsuccessful and the price quickly retreats into the channel. Let’s check out the results of this trading strategy:
4 long positions
3 successful; 1 fail
Profits:
$0.04 per share
$0.07 per share
$0.8 per share
-$0.01 per share (loss)
Total Profit: $0.18 per share
As you see, in this case we generated ~28% less profit than the previous trading system.
This is an off-beat trading strategy. It is very efficient for unpredictable and highly volatile stocks, which tend to increase or decrease exponentially. However, in our Blackberry example above, there was only one break above the upper channel, which lasted all of two minutes.
Automated Profit Taking
Most of the platforms for equity trading offer automatic profit taking capabilities.
The trailing stop loss order is another market execution feature. It performs the same function as a regular stop loss, because it closes the position when the price hits a certain level. However, the trailing stop is placed a fixed distance from the current price and trails the price action. Therefore, as the price moves in your favor, the trailing stop allows you to gain more profits.
Conclusion
No one ever went broke taking profits out of the market. As you learn more about yourself and what makes you tick, remember that profit targets are essential to becoming a successful trader. This fact becomes increasingly important when day trading, as the profit taking windows are often short-lived.
Alton Hill is the Co-Founder of TradingSim with over 18 years of trading experience. He completed the Design Thinking Bootcamp at Stanford’s D.School and brings expertise in Product Development to create the best trading simulation experience. His strategy focuses on trend-following systems, targeting high-volatility stocks with strong primary trends using the 15-minute chart.
In this article, we will do a deep dive into 3 types of thrusting line candlestick patterns. We will then explore a few trading examples, so you can apply these techniques in Tradingsim. What is a...
How to Day Trade the Concealing Baby Swallow Pattern
Concealing Baby Swallow Candlestick Definition The concealing baby swallow occurs at the end of downtrends and is a bullish reversal signal. The pattern consists of four candlesticks that are all...
[Updated May 2026 — refreshed for current market context and SEO best practices.] We have discussed a number of candlestick patterns on the Tradingsim blog. If you haven’t checked out our other...


 Candlesticks


