In this article, I will cover the TRIX indicator and the many trade signals provided by the indicator.
What is the TRIX indicator?
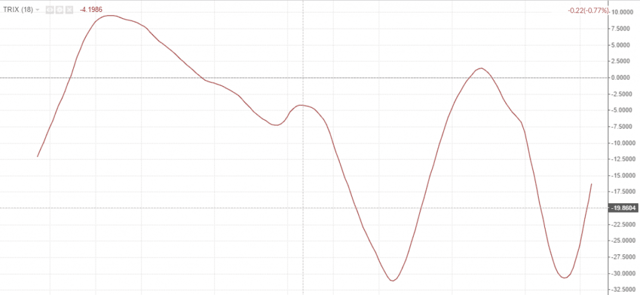
The TRIX is a momentum oscillator. [1] This means the indicator has no limits on the upside or downside.
The TRIX indicator consists of three major components:
- Zero line
- TRIX line
- Percentage Scale
TRIX
How is the TRIX calculated?
The curved line of the indicator shows the percentage change of a triple smoothed exponential moving average. This is just a fancy way of saying each average is an average of the prior average. You then smooth them out to create one line – the TRIX.
Formula
EMA 1 = 15-period closing price EMA
EMA 2 = 15-period EMA of Single-Smoothed EMA
EMA 3 = 15-period EMA of Double-Smoothed EMA
TRIX = 1-period percent change in Triple-Smoothed EMA
Where Does the Name Come From?

Trix Cereal
One, two, TRIX! Well, sort of.
It’s a play on words (Tri from triple and X from the exponential moving average). It’s not a tribute to TRIX cereal for all my 80s kids out there.
What signals does the TRIX indicator provide?
Cross of Zero Line
A cross of the zero line to the upside generates a buy signal. Conversely, a cross below the zero line generates a sell signal. [2] Now, this does not mean you should go out there and just start buying and selling every signal. This is a sure way to drain your account and make your broker rich.
Zero Line Cross-Buy Signal Chart Example
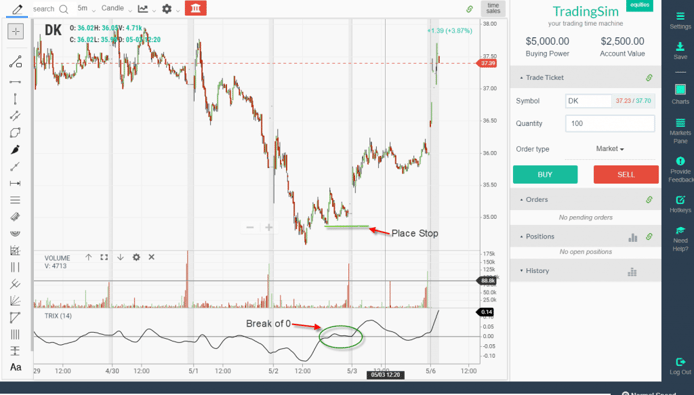
Cross of Zero Buy Signal
As I mentioned earlier in the article, buying every cross of the line is not a good idea.
In the above chart example, the stock DK crossed the zero line a number of times before the bottom was put in place. This is where you want to wait until the indicator makes a significant bottom relative to recent swings of the indicator.
You then enter a buy order after the breach of the zero line. Now, here is the tricky part, instead of selling on the break of the zero line place your stop below the recent low before the cross up through the zero line.
This way you are relying on the price action for when to exit the position and not solely the indicator. It’s a slight twist on how other sites are suggesting to stop out a TRIX long trade, but this approach will help reduce some of the noise.
Zero Line Cross Sell Signal Chart Example
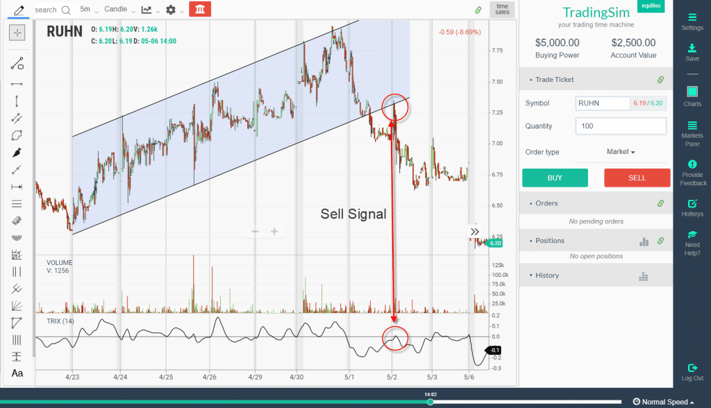
Sell Signal
The above chart example demonstrates the power of confluence between price and an indicator like the TRIX.
The indicator backtests the zero line.
Notice how the backtest occurs as the price action is backtesting a 7-day price channel.
After this backtest, notice how the price accelerates to the downside and ultimately gaps lower.
You can see how trading with the indicator goes much further than simply buying and selling crosses of the zero line.
Divergence Signals
This is always a favorite go-to for any indicator. This occurs when the price action and indicator are not aligned which is a precursor of a momentum shift.
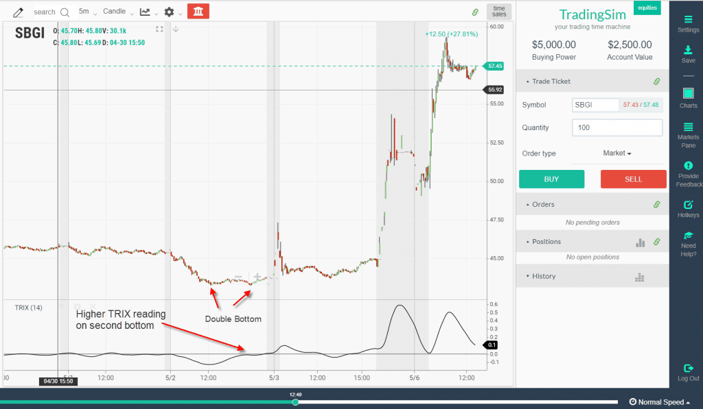
Higher TRIX Reading
Do you see how the indicator puts in a retest of its lows, but the indicator on the second test is above the zero line. This ultimately leads to a massive run higher, where the indicator makes fresh new intraday highs on each push higher.
The second high had a lower reading on the indicator, which is a precursor for a likely pullback.
Where the TRIX Fails
The TRIX indicator will have the same trouble as any other oscillator – range-bound trading.
Once price action begins to coil the three EMAs that make up the indicator begins to overlap. This creates a tight range in the indicator which will generate crosses above and below the zero line without a major price move.
This is where momentum indicators get in trouble. Therefore, if a stock or market is not in an impulse trend move, the indicator begins to pump out false signals.
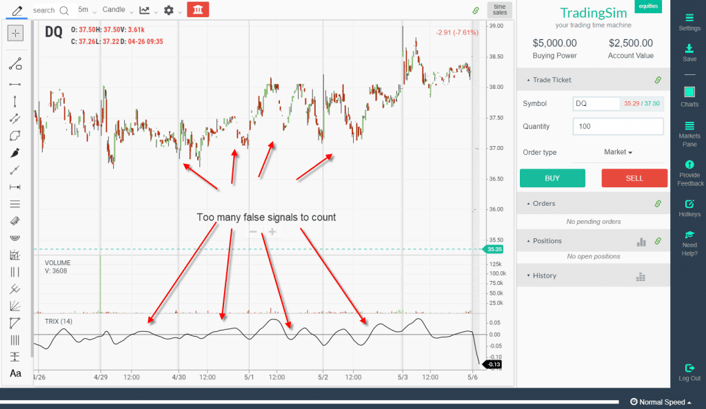
False Signals
TRIX versus Price Oscillator
In addition to making observations of the TRIX indicator, it’s always good to measure one oscillator against another. Therefore, I wanted to take some time to perform a comparison of the TRIX indicator with price oscillator. The price oscillator is made up of the 12 and 26 EMA lines, so like the TRIX, the price oscillator relies on the EMA.
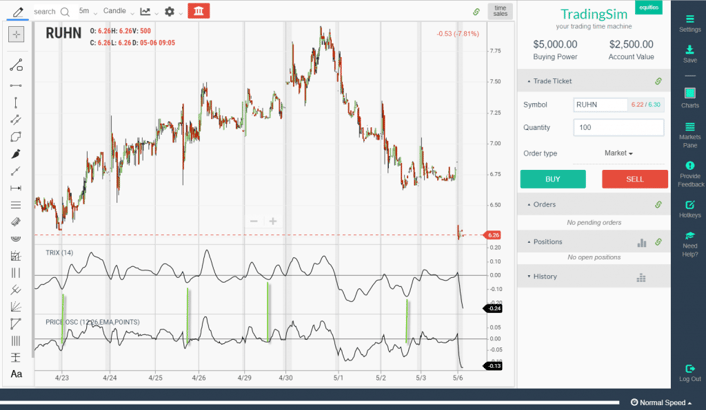
Price Oscillator Leads TRIX
As you can see in the above chart, the signals are very similar.
However, the price oscillator is slightly leading over the TRIX. So, if you want to lead price the PO will provide you the ability to jump the market over the TRIX.
In Summary
In short, the TRIX indicator is not the holy grail of oscillators. The indicator has its flaws but it also is able to provide extremes in price action. In addition, you can measure impulse moves relative to historical price activity.
How Can Tradingsim Help?
If you are interested in the indicator, you can use Tradingsim to practice trading with the indicator to determine if it is able to give you an edge.
External References
- Achelis, Steven. (1995). Technical Analysis from A to Z. Mc-Graw Hill. p. 207
- TRIX. Wikipedia


 Chart Patterns


