In this article, I am going to discuss the basics of the slow stochastics indicator and then dive into trading strategies you can test in the market.
Slow Stochastic Definition
The slow stochastic indicator is a price oscillator that compares a security’s closing price over “n” range. The most commonly used range for the slow stochastic indicator is 14.
How to Calculate the Slow Stochastic Formula
The slow stochastic indicator is comprised of three components. [1]
%K
Slow %K which is calculated as follows 100 x (Recent Close – Lowest Low (n))/(Highest High (n) – Lowest Low (n))
You then take the 3 period SMA of this value to get the %K for the slow stochastics.
%D
Slow %D is equal to the 3-period SMA of Slow %K
Number of Periods
To calculate the slow stochastic, replace “n” with the range you are monitoring. The slow stochastic can be calculated on any time frame. Again, the default value is 14.
I’m Not A Formula Guy, I Prefer to Trade
While I have provided the equation for calculating the slow stochastics so you can see “under the hood,” I strongly advise you to use the indicator as provided by your trading platform. Please do not pop out Excel and start cranking through slow stochastics calculations using raw market data and the slow stochastic formula.
Misconceptions of Slow Stochastics
Divergence in Slow Stochastics and Price Trend
Traders will often cite when a stock makes a higher high, but the stochastics does not exceed its previous swing high, that the trend is in jeopardy. [2]
This couldn’t be the furthest thing from the truth. The slow stochastics indicator ranges from 0 – 100. So, as a stock rallies, how can the stochastics continue to make higher highs if it hits 98.85?
Unlike price which has no boundaries, the slow stochastics is an oscillator, so it will never truly mimic a security’s price action. All that matters is that the stochastics continues in the direction of the primary trend.
Oversold and Overbought Levels
Traders will often exit long trades when the slow stochastics crosses over 80 or will buy when the slow stochastics crosses under 20. The problem with this trading methodology is that if a stock is over 80, it should not be looked upon as overbought, but rather as trending strongly. Also, if the slow stochastic is below 20, this is a sign of weakness, and without any other form of support present, the stock will likely continue lower.
How to Trade The Slow Stochastics Profitably
Below are four trading strategies you can use when trading the slow stochastics. The strategies increase in complexity as we progress through each example.
Please approach each strategy with an open mind as this will challenge the conventional thinking of how to use the slow stochastics indicator.
Strategy #1 – Identify stochastics with smooth slopes
Stochastics that have smooth slopes, which move from overbought to oversold implies that the move down was sharp and without much reaction, thus strengthening the odds of a counter move up.

Slow Stochastics Buy
While this is the simplest of slow stochastics strategies, it has its flaws. For starters, sharp moves up or down can start consolidation patterns before continuing the trend. If you were to simply place buy and sell signals because of the smooth slow stochastic slopes, you are headed down a rough road.
Still not a believer, let’s review a few charts.
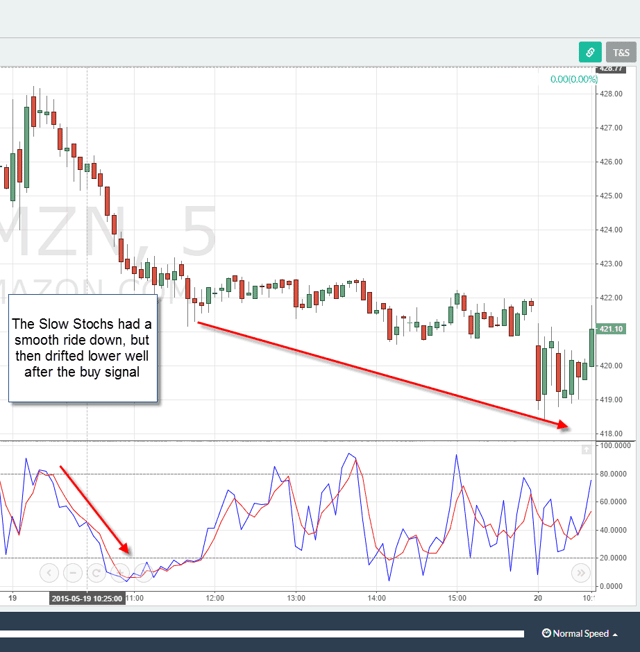
AMZN Drifting Lower
Weak Slow Stochastics Buy Signal
After you get a few of these under your belt, take my word, you will realize that you need more than a slow stochastics move where the fast line never crosses the slow line on the way down. While this strategy is the simplest, it doesn’t mean easy profits. You will need to step it up a little on the analysis side of the house if you want to make long sustainable profits.
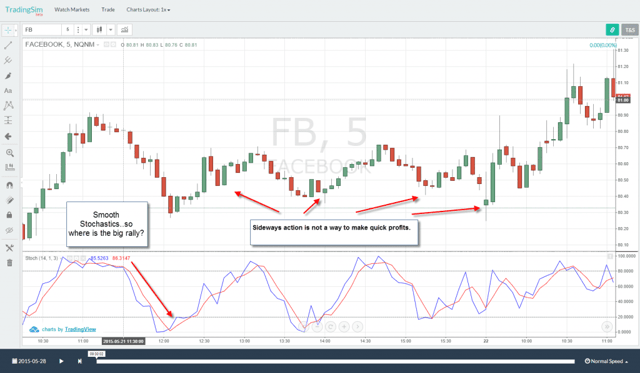
Strategy #2 – Follow the Sloppy Stochastics
New traders will buy oversold slow stochastic readings blindly when first starting out. Remember, the slow stochastic is an oscillator, and like any other oscillator, it can trend sideways for an extended period.
Slow Stochastics False Signal
You will see the slow stochastics just sitting beneath the 20 line, and you will say to yourself, this has been going on for too long. Trust me, you say you won’t, but you will.
This is the downside of indicators; it will give the impression that price action has to change course; however, all of us seasoned traders know the market will do whatever it wants.
Low Slow Stochastic Readings Precede Lower Prices
Let’s walk through a few working examples to get this point across.
Flat Slow Stochastics
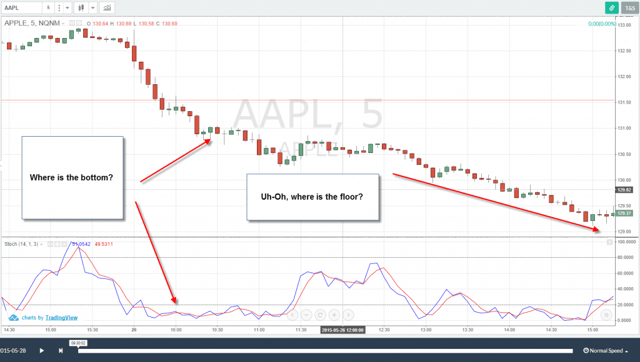
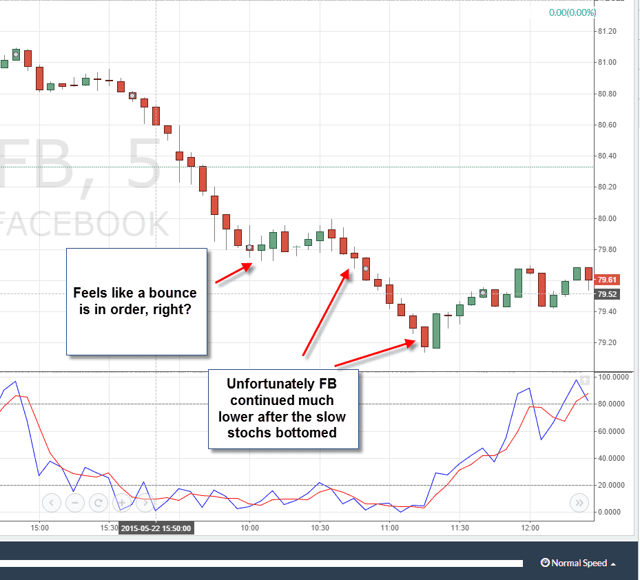
Choppy Slow Stochastics
In each of the above charts of Facebook and Apple, you can see how the slow stochastics just began to flat line. Mixed with emotions of needing to jump the market and the need to put on a trade, it’s very easy to see how a trader can end up making a poor trading decision.
In both instances, the rally never materialized, and in addition to losing money, you are also losing time sitting in the position.
So, where does this leave us? The simple answer is that you can take a position in the direction of the primary trend. For example, as you see the slow stochastics in Apple begin to stay under 20, use this as an opportunity to take a short position to ride Apple down.
Trade in the Direction of the Choppy Signals
Going in the direction of the sloppy, slow stochastics will feel very strange at first. This emotion will be the normal human reaction that states something has to give and things can’t keep going lower.
At this exact moment, you need to fight the need to go counter to the trend and realize that the money is in the least path of resistance.
Strategy #2 has a higher difficulty level then trading smooth slopes; however, it still lacks the context of the full technical picture of a security.
Strategy #3 – Combine the Slow Stochastics with Trendlines
As we mentioned earlier, slow stochastics can provide false signals. The best way I have determined to overcome this flaw is to combine the slow stochastics with trendlines to identify proper entry and exit points.
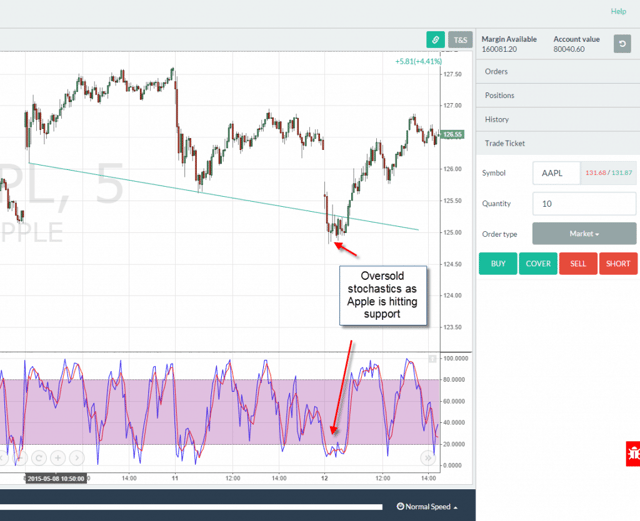
Slow Stochastics Buy Signal
The above image is a 5-minute chart of Apple. You can see how as Apple goes through its corrective move lower, it hits a support trendline twice and bounces higher. You will also notice the slow stochastics had several moves below 20 that either resulted in lower prices or sideways action. This is why as a trader you cannot blindly buy a stock just because the slow stochastics is under pressure.
Look for Confluence
If you use the confluence of the stock hitting support in conjunction with a bottoming slow stochastic, then you are likely entering the trade at the right point. It may look like magic, but it’s not that complicated.
The mechanics of the situation are such that the trend traders are buying as Apple hits support; at the same time the stochastics traders are buying the oversold reading. The key to this game is buying and selling right before everyone else does.
If you have a way of identifying when multiple players will be taking the same action for various reasons, you my friend are ahead of the curve.,
This same approach for identifying buying opportunities works the same on the sell-side.
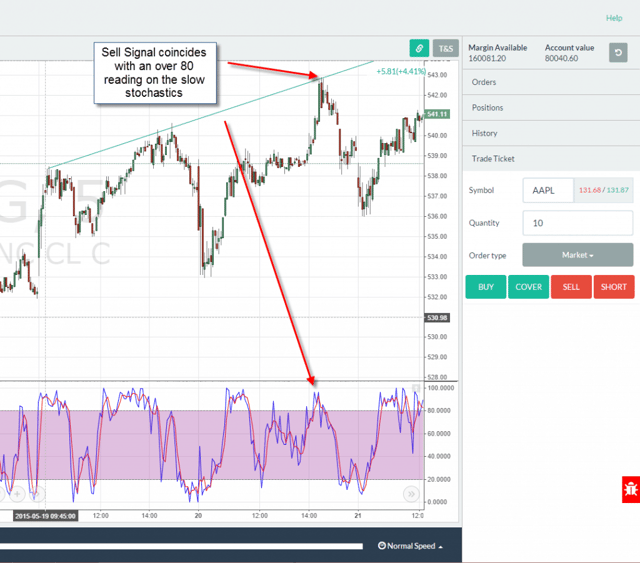
Slow Stochastics Sell Signal
The next chart is of Google and as you can see the stock was trending higher nicely. As the stock hit resistance for the third time, Google also had a slow stochastics reading of over 80. Just as I mentioned earlier about the false buy signals, look at the number of false sell signals.
Beyond missing out on trading profits, allowing the indicator to whipsaw you as this would also rack up pretty hefty trading commissions.
It’s Not This Easy, Sorry
Now, I do not want to leave you with the impression that you can simply buy or sell a stock when (1) it is hitting a trendline and (2) going over 20 or above 80. Trading is not that simple. You can, however, utilize the slow stochastics to validate the health of a trend relative to previous peaks by seeing if the stock was able to make a higher or lower slow stochastics reading. This way you can size up a recent high relative to its predecessor to determine if its really time to sell or if the stock still has room to go, regardless if a trendline is staring you in the face.
Strategy #4 – Pull the Trigger After the Slow Stochastics Crosses a Certain Threshold
Anyone on the web can figure out after reading the first 3 Google results that traders should be when the slow stochastics crosses above 20 and sell when the slow stochastics crosses below 80.
So, if everyone can read this on the web, why do you think this approach will make you money?
Another approach is to allow the slow stochastics to cross above a certain threshold to confirm that the counter move has begun. This level could be 50, 61.8, 78.6, etc. The downside to this approach, of course, is that the move is likely to have a few points behind it before you enter the trade. On the flip side, this will prevent you from getting caught in a stock that is flatlining.
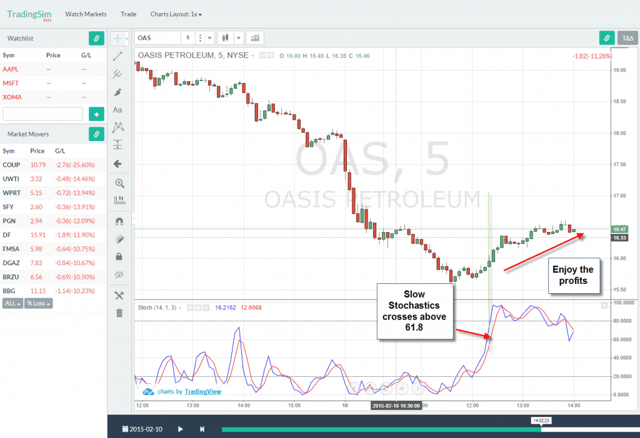
OAS Slow Stochastics
To illustrate this example, I will be using 61.8 as the trigger for entering any new long positions. This is, of course, a play on the 61.8% Fibonacci level found throughout the market.
In the above chart, we see that the stock OAS crosses above 61.8 on the slow stochastics which confirms the move up. From this point, OAS has an ~4 percent up move before finally topping out.
Things to Consider When Using a Higher Slow Stochastics Reading
The key with using a higher slow stochastic reading before entering a buy signal is to use this method for fading morning gaps down. The reason this approach works well is it allows for you to validate the initial gap down is weakening and you can take a long position. If you were to go in the direction of a strong uptrend and wait until 61.8 was crossed, you would likely be buying at the peak.
Trading in the Late Afternoon
This approach also works well in the late afternoon trading session. Those that follow the Tradingsim blog know that I do not trade in the afternoon; however, strategy #4 was built for late-day setups.
Later in the day, the market has less volume and will experience several false breakouts relative to the first hour of trading. To this point, as a day trader, you will need a method for assessing which breakouts or moves are valid.
As always, a real-life example is worth a thousand words.
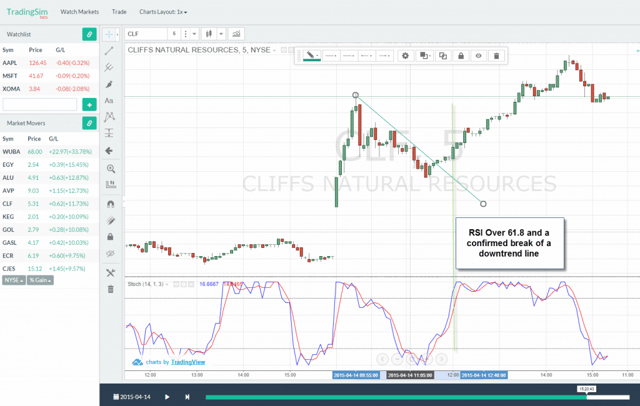
Slow Stochastics Late Day Breakout
Notice how in the CLF example the stock had an expected retracement after the morning pop. Once CLF cleared 61.8 the stock went on a nice run up until 2:30 pm. By waiting on the slow stochastics to confirm the breakout in conjunction with the trendline break, you are allowing both the price action and technicals to confirm the start of a new uptrend.
Now, that I have answered the mail regarding the four strategies, let’s dive into some of the most common questions and areas where the indicator can fail you as a trader.
What’s the Difference Between the Slow Stochastics and the RSI?
Now, that I have answered the mail regarding the four strategies, let’s dive into some of the most common questions and areas where the indicator can fail you as a trader.
They both are oscillators, so on the surface, they do resemble each other quite a bit. Let’s take it to the charts for more clarity.
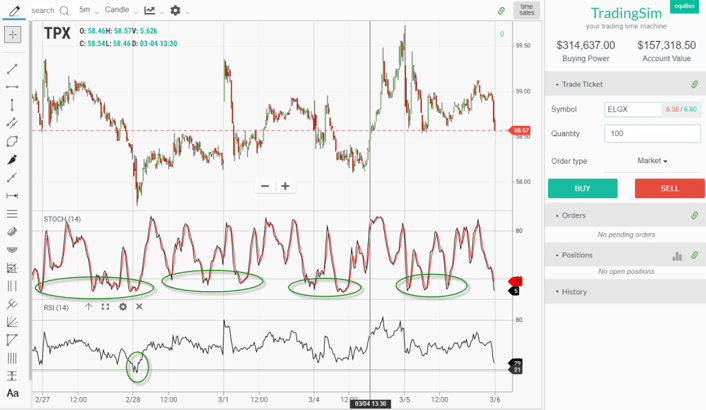
Slow Stochastics versus RSI
As you can see in the above chart, the stochastics provided a number of oversold readings, while the RSI only had one.
So, what’s the difference.
While the RSI is also looking back 14 periods, the calculation is centered on the highest percentage gain and lowest percentage loss over n periods.
However, the slow stochastics cares little for closing prices and focuses more on the highs and lows over the period.
This is why on average the stochastics will have a smoother appearance and fluctuates more frequently between overbought and oversold.
Why I Stopped Using the Slow Stochastics
The indicator does an amazing job of visually depicting when extreme levels have been reached. For me, I ultimately stopped using the indicator altogether.
This is because I use a method similar to Darvas and scale up as positions go in my favor. Well, these constant overbought readings would shake my nerve at times and I would begin to see the pending sell-off, which never materialized.
I opted for removing the indicator from the chart in order to quiet some of the noise in order to better manage my positions.
Please don’t read this and think I’m saying the indicator is flawed. Like everything in trading, it has to do with the individual trader and by no means indicates one tool or method is any less useful than the next.
In Summary
The slow stochastics is a great indicator for identifying the primary trend. If you take it a step further and combine some basic technical analysis methods such as trendlines, you will be able to uncover some hidden trading opportunities in the market.
Let’s Improve Your Trading Performance
TradingSim accelerates the steep learning curve of becoming a consistently profitable trader. The platform does this by allowing you to replay the market as if you were trading live.
To see how TradingSim can help improve your bottom-line numbers, please visit our homepage.
External References
- Murphy, John J. (1986). ‘Technical Analysis of the Financial Markets‘. New York Institute of Finance. p. 246
- Forex Forecasting. Wharton – The University of Pennsylvania. p. 2


 Momentum Indicators


