Indicators are at the heart of trading if you prefer technical analysis as your method of choice.
These indicators are relevant whether you day trade or swing trade. If you think of it, the entire industry of algorithmic trading would expire overnight without technical indicators and chart patterns.
Technical analysis at its core is about attempting to predict price movements in the market.
To take it one step further, technical indicators can be broken into two classes: leading and lagging indicators.
In this article, we are going to dive into both types to identify which one best fits your trading style.
What is a Leading Technical Indicator?
Leading Indicator Overview
A leading technical indicator is designed to anticipate future price moves in order to give you the trader an edge.
As magical as this sounds, a leading indicator relies upon the most common variable – price.
Other examples of leading indicators of future market sentiment are candlestick patterns.
The chart below shows a number of candlestick pattern signals for the S&P 500 that signal a shift in market sentiment.
Despite the simplicity of this example, it is always best for a trader to confirm signals with other indicators.
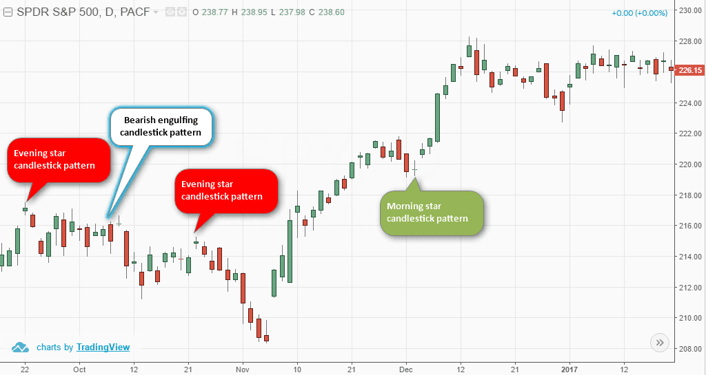
Japanese Candlestick patterns signal market changes
An important aspect to bear in mind with leading technical indicators is that they are not always right.
Look at the above chart and you will find examples where despite a bullish signal, the security’s price dropped.
Remember, technical analysis is not a holy grail. Your goal is just to find a system or chart pattern that works out more than not.
Other Leading Indicators
Other examples of leading indicators include momentum or volume oscillators. These indicators focus on the principle that momentum or volume changes ahead of price itself.
Some additional leading technical indicators include the relative strength index (RSI) or volume, which is more easily recognizable. Volume tends to show changes even before price as it truly represents the ever-changing buying and selling pressures in the market.
Below is a classic example.
This is a 10-minute chart of Microsoft (MSFT) with the volume indicator.
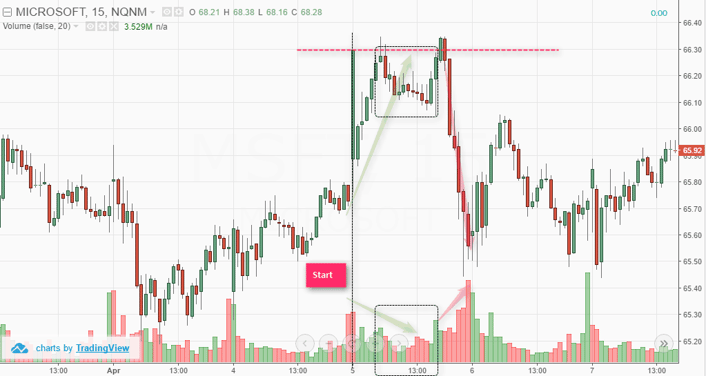
Volume as a leading indicator
If you closely analyze price and volume, you can see that from the area marked ‘start’ and the subsequent rally in price, volume starts to fall. For someone who viewed the chart without volume would easily make the mistake of assuming the price trend was really strong.
As price peaked near $66.30 posting a high, you can see that volume is not confirming the bullish momentum-led rally, signaling that prices could fall.
Eventually, price makes another attempt at $66.30 and crashes strongly and this time the decline in price is confirmed by strong selling pressure as indicated by the strong volume bars.
What is a Lagging Technical Indicator?
A lagging indicator often makes use of price as an input variable and in most cases, requires a longer look back period in order to ascertain trends.
Even with the delayed feedback loop, many traders prefer to use lagging technical indicators as it helps them to trade with more confidence by validating their trade decisions. Usually traders make use of two or more lagging indicators to confirm price trends before entering the trade.
This can be viewed as a conservative way to trade, but do not let this draw you into a false sense of security that you can make money consistently.
Lagging Indicator Trading Example
Let’s look at a classic example of a lagging indicator set up which is a 50-period and a 200-period moving average. We know the golden and a death crosses, which are bullish and bearish crossovers of the 50 and 200 SMA’s.
Generally, the security is said to be bearish when the 50 SMA crosses below the 200 SMA and the security is said to be bullish when the 50 SMA crosses above the 200 SMA.
The following example shows the 50 and 200 SMA applied to the daily chart for QQQ ETF chart.
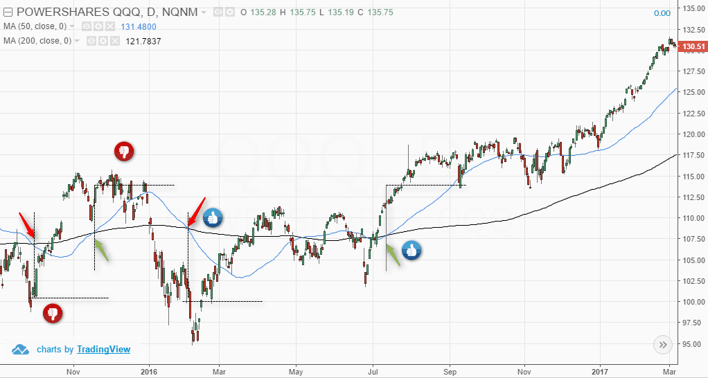
Moving averages as a lagging indicator
In the above chart notice the four signals generated by the bullish and the bearish crossovers of the 200 and 50 period moving averages. In the first signal , if one went short after the bearish signal, it would have been a losing trade.
This is because by the time price moved lower and the SMA’s reacted to this, price already fell significantly and started to pull back higher.
Likewise, in the next example we get a bullish crossover. If a trader were long on this signal, it would once again trigger a loss because we see that price pretty much stalls near the previous highs before falling lower.
The third bearish signal worked somewhat in our favor; however, price only fell a few points lower before starting to reverse.
Among the four signals, it was only one that worked as the bullish crossover signal saw a meaningful rally in prices thereafter.
What the above example tells us is that despite lagging, the lagging indicators are by no means fool proof.
What are the Key Differences Between Leading and Lagging Indicators?
Ride the Trend
The most noticeable difference is lagging indicators keep you in the trade by riding the wave of momentum.
In order for this to work properly you need to make sure you are configuring your favorite indicator with the right number of periods. Meaning you do not want to use a 5-period moving average on a 1-minute chart of a biotech company.
If none of that made sense, it’s okay. Basically, your lagging indicator will trigger you to close your trade too early if you use a tight lagging indicator on a volatile stock.
Exiting at Tops or Bottoms
Let me first say this is impossible, so do not waste your time trying to figure this one out.
However, once you are up sizably on a position, you do not want to give money back on the trade. Therefore, if you are trying to maximize your profits – leading indicators are the way to go.
For example, if a stock is spiking higher, you will want to look at the volume and maybe an oscillator to determine when to exit the trade. If you were to wait for a cross of a long-term moving average, you will likely have given back most of your gains.
Best Time Periods
This is something I want to demystify when it comes to leading and lagging indicators.
Just because you are on a shorter time frame does not mean you only care about leading indicators.
Regardless of the time frame, traders will want to use both leading and lagging indicators when trading.
Drawbacks of Leading and Lagging Indicators
Both leading and lagging indicators come with their own set of drawbacks. For starters, leading indicators tend to be choppy and react to prices quickly. This means that leading indicators are prone to false signals .
Conversely, lagging indicators are slow to react and again run the risk of eroding paper profits.
Combining Leading and Lagging Technical Indicators
Let’s see how a trader can use leading and lagging indicators to gain a better view of the markets.
The following chart shows a 15-minute time frame with the relative strength index (leading) and two exponential moving averages (lagging).
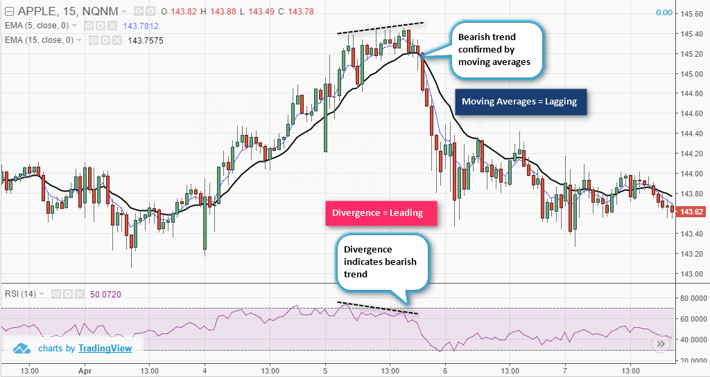
Example of using leading and lagging indicators
Here, we first notice a bearish divergence on the chart, identified by price making a higher high while the 14-period RSI makes a lower high. This bearish divergence is a leading indicator and informs the trader of a potential bearish trend.
Note that with leading indicators, there is a possibility for the signal to be invalidated. Thus, traders who typically would act on the signal from the leading indicator will be at a loss.
Getting back to the above example, you can see that after the leading indicator (divergence) signaled a bearish trend, this is confirmed by the moving averages bearish cross over.
The moving averages are lagging indicators and when viewed in the context of the bearish trend that was initially pointed out by divergence, the trader has better odds of trading this short signal.
You can see how powerful, yet simplistic it is to combine both leading and lagging indicators.
Leading vs. Lagging Indicator – Which is Better?
For traders, it is often the dilemma of finding a balance between using leading and lagging indicators. Rely solely upon leading indicators and chances are you will see a lot of false signals.
Rely solely on lagging indicators and you will likely hold on too long and give back most of the profits.
With these obvious drawbacks, it is best to develop a trading strategy that combines both leading and lagging indicators.
At the end of the day, it is up to each trader to decide how they want to trade.
Thus, there is no clear winner when it comes to choosing between leading or lagging indicators – consider it a tie!


 Day Trading Indicators


