An inside day is when a security trades within the high and low range of the previous day. An inside day can occur on any chart style that shows that high and low data, but it is easiest to identify with candlesticks. An inside day is a sign to a trader that the security is taking a breather from the primary trend, or is in the early stages of a counter trend move.
Inside days do not provide high probability odds of determining where a security is headed over the short term. So, if an investor is thinking about creating a trading system solely based on inside days, it will ultimately lead to losses. This is because an inside day candlestick is a neutral sign, where neither bulls nor bears are in control. Traders must look to the current market environment and technical indicators in order to determine whether to go with the primary trend or to anticipate a counter move.
Inside days have the greatest odds of success when in the context of a strong trend. A trader should look for the inside day to be relatively small and not retrace more than 50% of the body of the previous days candlestick. This implies a pause in trend and odds are the security will continue in the direction of the primary trend.
Trading counter moves using inside days can be challenging. A trader can increase their odds by determining if there was a volume spike on the previous day. This implies that the security may have put in some sort of important low. Next the inside day should retrace more than 50% of the previous days candlestick body. This is a potential sign that the bulls are gaining steam.
Inside days should not be traded during choppy markets. This is because the larger trend is one of indecision, so inside days only add to the confusion.
Below is an inside day chart example of the Dow Jones. These inside days showed up before the worst one week sell off in the history of the Dow Jones. Notice how there was a massive 777 point down day followed by three inside days. Some traders assumed this to be a potential change in trend, while others saw it as a breather in the larget down trend. Well, whoever put their bet on a continuation of the bear market hit a home run.

Inside Day
Now that you know about the details regarding the inside bar pattern, I need to share with you some inside day trading strategies.
Inside Day Trading Strategy
Since the inside day (ID) candle signals a potential market move, we need to anticipate which way price will break. Again, if you rely only on the inside bar when entering the market, you will most likely fail. Thus, we need help from an additional trading tools, to validate our trading decision.

#1 – ID + Chaikin + Stochastic RSI
In this inside day trading strategy, I will combine the ID candle pattern with two oscillators – chaikin and SRSI. I use the Stochastic to identify overbought and oversold signals. At the same time, I use the chaikin to identify bullish and bearish divergence and to close my position when the chaikin line breaks zero.
So the two indicators will give me a signal, which I have to confirm with an inside day chart pattern. I will close positions when the chaikin breaks the zero line in the opposite direction.
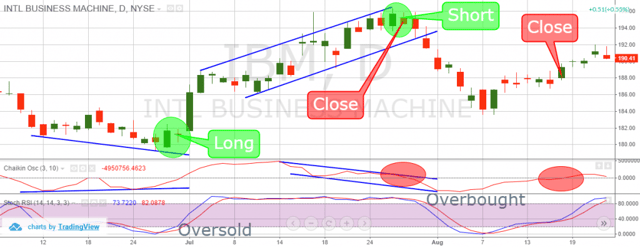
Inside Day + Chaikin + SRSI
As we said, in order to identify inside day chart pattern, we need to use a daily chart. So, this is the daily chart of IBM for the period Jun 9 – Aug 22, 2014. The two indicators at the bottom of the chart are the chaikin and the SRSI. The blue lines on the chart indicate two divergences between the price action and the chaikin. The green circles point out the inside day patterns, which we use as a position trigger. The red circles show the moments when the chaikin breaks its zero line and we close our positions.
In June, 2014 we spot that the price has closed two bottoms, where the second is lower than the first. This creates a bearish price inclination. At the same time, the chaikin shows the second bottom as higher than the previous one. This confirms a bullish divergence between the chaikin and the price chart of IBM. At the same time, the stochastic switches in the oversold area, giving us the second long signal we need. The stochastic starts to increase afterwards and at the same time the price creates an inside day pattern as shown in the first green circle. This is all we need to go long using this strategy.
We go long and we carefully watch the chaikin for eventual interactions with the zero line.
During its way up, the stochastic is constantly in the overbought area. That doesn’t bother us, because our exit signal is a bearish break of the chaikin line through the zero level. As the price begins to increase, an upward channel is formed, which I have noted with the blue lines.
At the same time, the chaikin starts drawing a bearish channel, which is an obvious bearish divergence between the price and the chaikin indicator. This is when you might start getting worried about your long position. Yet, we wait for the chaikin to break the zero downwards. Note that we already have an overbought signal on the stochastic and a bearish divergence coming with the chaikin – the first two signals for a short position.
On its way down, the chaikin breaks its zero line downwards, which triggers our exit from the market. At the same moment, the chart gave us another inside pattern. As we already have the two signals for a short position, we directly go short with the closing of the previous long position. Therefore, we are bearish now and we follow the behavior of the chaikin. The price creates a solid bottom on August 7, 2014, which indicates that the trending downward move might be finished and the price is either correcting, or reversing. Yet, the chaikin is still below the zero line, forcing us to hold our trade. On August 18, 2014, the chaikin goes above the zero level, which closes our short position with IBM.
The first trade in this example brought us a profit of $12.86 per share for 29 days. The next trade made a profit of $5.10 for 20 days. This means that for 49 days, we collected $17.96 per share from trading IBM with our inside day, chaikin and SRSI strategy.
#2 – ID + SMI Ergodic
If you are a fan of the MACD, then you might also like this strategy. Now, we are going to combine the inside day pattern with the SMI Ergodic. Although it is being calculated differently than the MACD, the ergodic gives pretty much the same signals as the MACD – crossovers. Yet, the ergodic is a bit quicker and more volatile than the MACD. In this strategy, I will match inside day patterns with bullish and bearish ergodic signals in order to find out the direction of the inside day potential move. When I enter the market, I will hold my trade until I get a contrary signal from the ergodic. The image below will explain to you how this inside bar technique works:
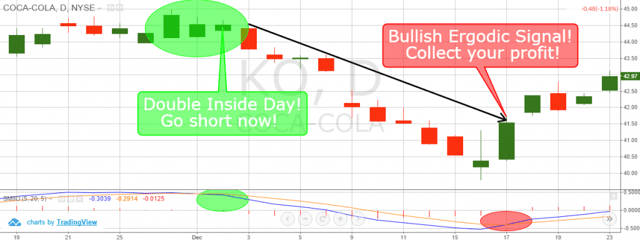
Inside Day + Ergodic
Again, we use a daily chart because we are trading the inside day candle pattern. This is the daily chart of Coca-Cola from Nov 19 – Dec 23, 2014. The indicator at the bottom is the SMI Ergodic. As you see, the trade here is bearish. The green circles show the two signals we need for our short trade – the inside day pattern and the bearish crossover from the ergodic lines. Notice this time there are two inside days. Thus, we consider it as more reliable.
At the same time, the ergodic’s lines are in the upper part of the indicator, implying that a bearish crossover might occur. This happens and we go short! We follow the price decrease with our short trade until the ergodic has a bullish crossover. This happens on Dec 17, 2014 and we close our short position. This trade brought us a profit of $3.00 per share over an 11 period.
#3 – ID + Parabolic SAR + Relative Vigor Index
In this strategy I use the inside day candle figure combined with RVI and PSAR. We use the inside day and the crossovers of the RVI in order to open a trade in the respective direction. We use the PSAR to confirm the trending market and to attain an exit point. We close our trade when we get three PSAR dots in the opposite direction of our trade. Note that the PSAR could also give you an entry confirmation, but it is not necessary.
Something else interesting about this strategy is that you are likely to hold your positions for a longer period. The reason for this is that the PSAR is resistant to volatility and is able to isolate small price moves.
Thus, it does not give an exit point (three opposite dots) if there isn’t a certain price move against you.
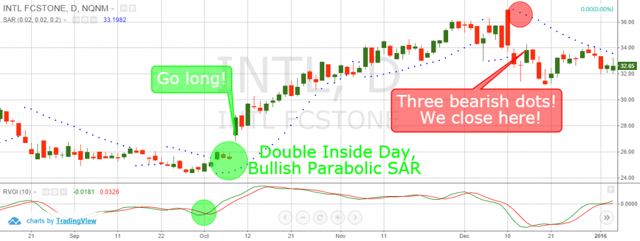
Inside Day + RVGI
This is the daily chart of Intel for the period Aug 12 – Dec 30, 2015. The indicator in the bottom is the Relative Vigor Index. The green circle on the RVI shows the bullish crossover of our long position. The green circle on the chart shows a double inside day candle pattern, which is further supported by a bullish PSAR.
Thus, we go long with Intel and we observe the PSAR’s behavior for eventual contrary signals. Although in the middle of the trade there is a bearish attempt from the PSAR (two bearish dots), the signal is not strong enough and we keep our trade. Fortunately, price keeps increasing while we are long with our trade. We close our trade when the PSAR closes a third bearish dot as shown in the red circle on the chart.
This trade on the Intel Stock brought us a price increase of $6.52 for 48 trading days.
Which Inside Day Trading Technique?
I personally prefer the second trading technique – combining the inside day chart figures with the ergodic. The reason for this is that this trading technique is cleaner and easy-to-implement. There is only one indicator and the only thing you have to do is match the ergodic crossovers with inside day candles – nothing special.
I really believe that in trading we should keep it simple as much as possible. After all, the trigger is the inside day chart pattern. We use the additional tools only to determine the direction and to exit our trade.

Conclusion
- An inside day occurs when the size of a daily candle fits the size of the previous one.
- Inside day candle pattern says the market is about to move.
- Inside day does not provide an indication of which direction the market will move.
- We should use additional tools when trading inside days, because:
– We need to find out the direction of the potential move.
– We need an exit point.
- Three inside day trading strategies are:
- ID + Chaikin Oscillator + SRSI
- ID + SMI Ergodic
- ID + PSAR + RVI
- The simplest out of these is the inside day + SMI Ergodic, because:
- We use only one ergodic signal – bullish/bearish crossover
- Ergodic is explicit on pointing directions.
- It looks clean on the chart.
- It is very simple and easy to implement.


 Day Trading Indicators


