There are a number of day trading styles that make money in the market. This article provides an overview of multiple day trading strategies that professionals use to make money on a consistent basis. This article will contain the pros and cons of the following day trading styles: (1) breakouts, (2) scalp trading, (3) counters, and (4) trend following.
Day Trading Breakouts Overview
Breakouts is the most common form of day trading styles. It involves identifying the pivot points for a stock and then buying or selling short those pivots in hopes of reaping quick rewards as the stock exceeds a new price level. Breakouts is generally the starting place for newbie traders as it provides a clear entry level and it is a trend following system.
Pros of Breakout Trading
Breakout trading has the potential for quick gains. When key price levels are exceeded it will trigger stop order which gives that initial burst. The key component of a valid breakout is that volume and price accompany the move. This will increase the odds of the trade continuing in the desired direction. Breakouts are also easy to identify. Most trading platforms provide methods for tracking volatile stocks and how close they are to their daily highs or lows.
Cons of Breakout Trading
Breakout trading is by far the most challenging form of day trading. For starters, the levels where trades are placed are the most obvious to everyone regardless of their trading style. Think about it, no matter what system you use on a daily basis, every day trading system factors in the highs and lows of the day. Secondly, the vast majority of intraday breakouts fail. This doesn’t mean they don’t head higher a day or two later, but if your day trading and there is no instant follow through, odds are you are in a losing trade. Day trading breakouts requires the most discipline as you have very little time to make the call as to whether you are wrong or right. The inability to pull the trigger fast and consistently will mount in to huge losses.
Breakout Trading Strategy
Breakout Trading Strategy
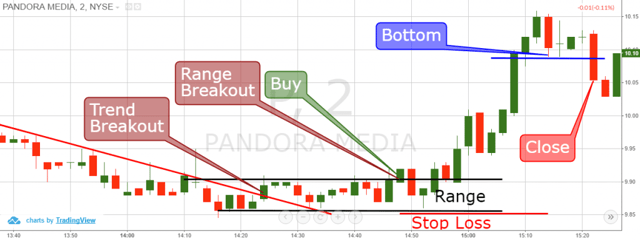
Above is a 2-minute chart of Pandora Media from Apr 29, 2016, which illustrates a breakout trade.
The action begins with P in a steady downtrend (red bearish line).
Pandora then goes into a range between $9.90 and $9.85.
This range is illustrated on the chart with black parallel lines, which show the upper and lower levels of the range.
Suddenly, Pandora starts closing higher bottoms and the price action switches above the upper level of the range. The first candle, which closes above the upper level of the range, is our buy signal. If you go long on this signal, you should place a stop loss order right below the lower level of the range as shown on the image.
Notice that after buying Pandora, the price action creates a long lower candlewick, which does not breach our stop loss order.
Once the stock breaks out, you can use a simple technique of raising your stop to each new successive swing low.
As you see on the image above, once Pandora broke the blue line (representing the second swing low), we exit the trade.
This trade example generated profit equal to 1.31% for about 35 minutes. Isn’t that impressive?
What’s even better than the profit is that we were able to make 1.31% on the trade while only risking .70%.
1.31 : 0.70 = 1.31/0.70 : 0.70/0.70 = 1.87 : 1
Note that in some cases the price moves will be bigger than the one in the example above. In many cases you will be able to get 2:1 or 3:1 win-loss ratios when trading breakouts.
Another approach that I have been recently testing out in the Nikkei is to wait for the high or low of the breakout candle to be breached before opening a trade.
I am using this validation technique for trades placed after the first 30 to 45 minutes of trading, because stocks will often fade the breakout.
However, if you are able to handle the craziness of the morning, odds are the momentum is so great on the breakout you are able to achieve some pretty decent gains before a trend reversal kicks in.
Scalp Trading Overview
Scalp trading is a day trading style where a trader looks to make small gains throughout the trading day. This day trading style suits people who love “action” in the market.
Pros of Scalp Trading
The obvious benefit of scalp trading is the fact you are looking for very little from the market. Another plus is that stop losses are very tight. This will allow the day trader to avoid the monthly “blunder” trade that we all have put on one time or another.
Cons of Scalp Trading
Scalp trading like any other form of trading requires discipline, but due to the large number of trades one will put on during the day, it requires an enormous amount of focus. This “all-day focus” can make the trading day a tense situation and can lead to high anxiety for the trader. Also, people go into the business of trading for unlimited earning potential and the idea that you do not have to slave away at a desk all day. Well if you plan on scalp trading, keep a bottle next to your desk, because bathroom breaks are considered a luxury.
Scalp Trading Strategy
We will use the scalp technique to catch minimal price moves in our favor, doing a hit-and-run on the market.
As an assistance tool we are going to use the stochastic RSI indicator on a 2-minute chart to identify overbought/oversold signals.
We will enter trades exactly when the two stochastic RSI lines break out of the respective zone. At the same time, we will hold the trades until the stochastic RSI lines cross in the opposite direction of the trade.
A stop loss should be used for each scalping position. I recommend you to use a 0.3% stop loss on a 2-minute chart. This risk size should be able to give you optimal results when implementing the scalp intraday trading style. Let’s now do a review of a real-life trading example.
Scalp Trading Strategy
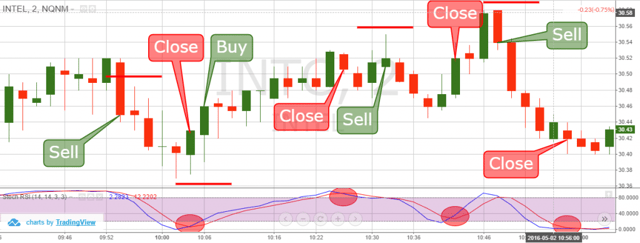
Above is a 2-minute chart of Intel from May 2, 2016. The image shows four trading positions based on the scalp trading style. The red horizontal lines on the image are where we placed our stop loss orders.
The red circles on the stochastic RSI show the close signals we get from the indicator. The moments when the stochastic lines get out of a zone are taken for entry signals.
We start with the first trade on the image, when Intel closes a bigger bearish candle after an uptrend. At this exact moment the stochastic RSI lines cross downwards and exits the overbought area.
This is the short signal we need and we sell Intel short. We place a stop loss 0.3% above the entry point as shown on the image with the red horizontal line. 5 periods later (10 minutes) the stochastic lines enter the oversold area and cross upwards. This is an exit signal and we close the trade. We generated a profit equal to 0.4% while risking 0.3% of the funds invested in the trade.
The second entry comes one period after the exit signal.
We go long on the signal of the stochastic RSI crossing out of the oversold area.
10 periods later (20 minutes), the stochastic lines enter the overbought area and cross downwards. We exit the trade based on this signal. The long position made a profit of 0.9% with a risk of 0.3%.
The lines then exit the overbought area creating a new short signal on the Intel stock. We sell the stock and we hold it until the two stochastic RSI lines cross in a bullish direction. This happens only 5 periods later and we close the trade with a small loss of 0.05%.
The Intel price does an increase for a relatively short period of time afterwards. Meanwhile, the stochastic RSI lines enter the overbought area and cross downwards with exiting this area. We get a short signal and we sell Intel stock. 5 periods later the lines of the indicator cross upwards, creating a close signal. In this trade we made profit of 0.95% while risking only 0.3%.
The total outcome from these four scalp trades equals to profit of 2.20%. Three of these trades were winning and only one was losing (-0.05%). These four trades took us only 50 minutes trading time.
This makes it seem super simple right?
Well, trading off one indicator is a simple way to lose money if you do it blindly.
You will need to understand how the broad market and the specific stock you are trading relate to the stochastic RSI or any other indicator for that matter.
I can’t tell you how many times I have gone on a run, only to have broad market conditions shift and then take me on a 2 to 6-week binder of losing trades.
The key point I want you to get, is that you have to do more homework before committing yourself to any scalp trading strategy.
Lastly, remember commissions are a big factor in scalp trades since your profit targets are likely really small. So, make sure you are able to generate a high winning percentage of trades.
Counter Trading Overview
Counter trading is when a trader looks for a pivot point, waits for that pivot point to be tested and trades in the opposite direction. This type of trader has a personality where he or she enjoys going against the grain.
Pros of Counter Trading
Counter trading has a high success rate for day trading. Ask any seasoned trader and they will tell you that intraday trading is nothing more than constant zig zags and head fakes. So, the counter trader is already up in the odds department, because they are going against what the market is telling them. Another plus for counter trading is that when the market fails it often fails hard. Day traders who are able to play morning reversals can make a great living only trading the first hour of the day.
Cons of Counter Trading
While counter trading has a high win percentage, the losers can bring destruction to an account. Even if you win on 4 counter trades, if you do not cut the loser fast, a breakout could run away from you in a hurry. Another downside to trading counter is the next pivot level is too far from your entry, so you will have to set some arbitrary stop limit. Since your stop is not based on an actual price point on the stock, it could get hit quite often. Lastly, setting your price target is also a challenge. Stocks will often appear to make a double top, only to change course just as fast and reclaim the recent highs.
Counter Trading Strategy
One method to identify the setup is to first locate a stock that has been range bound for some period of time.
you see such case on the chart wait for the stock to reach the same level again. If this happens, enter a trade if the stock bounces from this level again. Stay in the trade until you see three candles in the opposite direction to your trade, or when the price closes a candle beyond your pivot point.
Counter Trend Trading Strategy
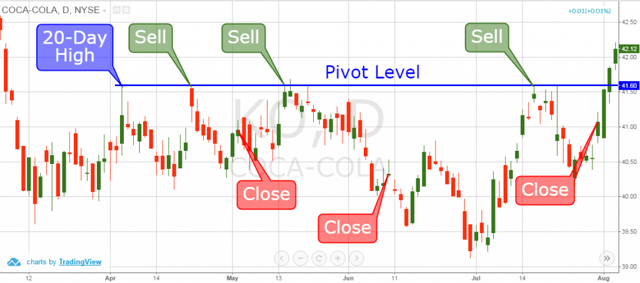
Above you see the daily chart of Coca-Cola from April 2015 to August 2015. The image shows a crucial pivot level and three trades made based on our counter trading strategy.
After a sharp price drop of Coca-Cola, the stock has a 10-day consolidation and then increases to 20-day high. Notice that we have marked this level because the price switches directions after creating this top.
The next time when the price increases to the same level, we sell KO. The price starts decreasing afterwards. We hold the trade until we see three opposite (bullish) candles, or until the KO stock closes a candle above our pivot level.
6 periods later, the price starts creating bullish candles – three in a row and we close the trade.
After the next increase to our pivot level, we short Coca-Cola again. However, this time the trade lasts for more time and we manage to catch a bigger price increase.
The next increase to our pivot level leads to another price drop which we trade. The gains are not as big as from the second trade, though. All in all, we generate a profit of 5.87% from three trades – not bad don’t you think?
When day trading, the best time to enter counter trend trades is after the first hour of trading.
This is because traders that bought retracements in the early part of the morning, will use the high of the day to exit their trade.
So, you will notice stocks will poke their head above the high of the day, only to sharply reverse lower. Therefore, if you are looking to go counter to the trend, wait to see a stock make a new daily high after a retracement and then show a sign of weakness.
I will caution you though, that if you try this strategy in the first 20 minutes of the day, things are so wild, you could get caught in a vicious short squeeze.
Just make sure you use your stops and pay close attention to the time of day you are trading.
Trend Following Overview
When most people think of trend following, the first thing that comes to mind is a long-term hold buy and hold strategy like the Turtle System. Believe it or not, there are day traders who utilize trend trading systems. The basic method is to look for stocks that are up big in the news and then buy the pullback on these stocks after the first reaction in the morning. Lastly, the trader will place a longer moving average (i.e. 20) and sell the stock if it breaks the line.
Pros of Trend Trading
Trend trading allows the trader to ride a stock for big gains. The day trader will have a limited number of stocks to trade per day, so the commissions are low for this kind of day trading style.
Cons of Trend Trading
If every trader was able to determine which stocks are going to trend all day, there would be a new millionaire created every 30 minutes. No one knows at 10 am, which stocks are going to trend all day long. This means that at best, a trend following day trader can hope to be right 20% of the time. While this trader could still make a killing with such a low win rate there are very few traders that can stick to their trading planwith such a low win rate.
Trend Following Trading Strategy
Trend Following Trading Stategy
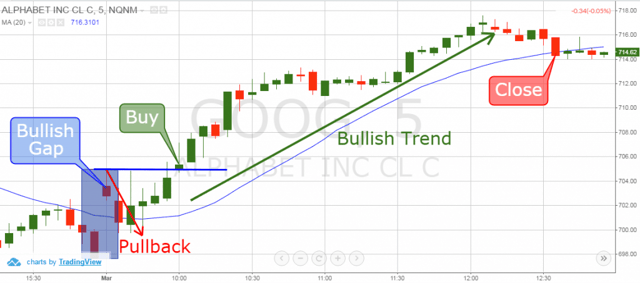
This is the 5-minute chart of Google (Alphabet Inc.) from March 1, 2016. The image depicts how to catch a strong bullish trend intraday.
On March 1st, Google starts with a bullish gap.
During the next 10 minutes after the market opening, the stock had a minor retracement to close the gap.
On the surface this may appear to be negative, but in reality this is a great sign. Often times gaps get filled, so it’s better to get it out of the way, so you don’t have any hiccups in the future.
Once Google closed the gap, the stock began to run.
We use the upper level of the gap (blue rectangle) as a signal line. We buy the stock the moment Google closes a candle above the gap range. The stock then continues with the price expansion.
The position stays open for a little less than three hours before the price breaks the blue 20-period simple moving average.
Once the price breaks the 20-SMA, we close the trade.
For intraday traders, catching a stock that trends all day is literally one of the hardest things to do since the market only trends hard in one direction 20 percent of the time.
This is where you will need to use broad market indicators like the VIX and TICK index to determine when it’s time to let your positions run.
Otherwise, you are going to constantly give back big portions of your gains, waiting for the stock to trend 3 hours.
Conclusion
- Professional traders use different stock trading styles in order to make money on a consistent basis.
- Few of the most popular trading styles strategies are breakout trading, scalp trading, counter trading, and trend following.
- Breakout Trading: You identify a break through a crucial level on the chart and you trade in the direction of the break.
- Pros: breakouts are easy to identify; they lead to quick gains; there are many assistant tools for breakouts trading;
- Cons: breakouts fail often; discipline is required; you have little time to make decisions.
- Scalp Trading: You strike for minimal profits from many trades.
- Pros: little price moves are required; short trades in terms of time; tight stop losses;
- Cons: high level of discipline is required; large number of trades; anxiety during trading; you will be nailed to your desk, commissions.
- Counter Trading: When the price approaches a critical level on the chart, you trade the bounce from this level.
- Pros: high success rate; often the counter price moves are relatively big;
- Cons: loser trades can lead to bankroll destruction; requires enormous patience.
- Trend Following: You identify a stock gainer and you buy at the pullback after the start of the new trading day.
- Pros: hitting for big gains; limited amount of trades per day; low commissions;
- Cons: very low success rate; hard to implement strict trading plan, because of the many fails; the broad market needs to be trending hard.


 Awesome Day Trading Strategies


