Belt Hold Line Definition
The belt hold line candlestick is basically the white marubozu and black marubozu within the context of a trend. The bullish belt hold candle opens on the low of the day and closes near the high. This candle presents itself in a downtrend and is an early sign that there is a potential bullish reversal. Conversely, the bearish belt candle opens at the high of the day and closes near the low. This candle presents itself in an uptrend and is an early sign that there is a potential bearish reversal. These candles are reliable reversal bars, but lose their importance if there are a number of belt hold lines in close proximity.
Not to complicate the matter further, but the pattern can also act as a continuation pattern, which we will cover later in this post.
Bullish Belt Hold Line
The bullish belt hold line gaps down on the open of the bar, which represents the low of the bar, and then rallies higher. Shorts who entered positions on the open of the bar are now underwater, which adds to the buying frenzy.

Bullish Belt Hold Line
You are now looking at a chart which shows the bullish belt hold line candlestick pattern. As you see, the trading day starts with a big bearish gap, which is the beginning of the pattern.
The price action then continues with a big bullish candle.
The candle has no lower candle wick and closes at its high.
This price action confirms both a bullish marubozu and bullish belt hold line pattern.
Bearish Belt Hold Line
The bearish belt hold line gaps up on the open of the bar, which represents the high of the bar, and then sells off. Longs who entered positions on the open of the bar are now in losing positions, which adds to the selling frenzy.
Bearish Belt Hold
As you see, the pattern here has the same characteristics as the bullish belt hold line but in the opposite direction. The trading day starts with a bullish gap.
A couple of periods later, the stock prints a strong bearish candle. The stock has no upper candlewick and closes at its lowest point, which again confirms both a bearish marubozu and bearish belt hold line pattern.
Trading the Belt Hold Line Pattern
Now that you’re familiar with the bullish and bearish variation of the belt hold line pattern, let’s dive into how to trade the pattern.
The good thing about the belt hold line trading pattern is that the rules are easy to implement.
Of course, you have to be careful to not lose your self-control, but that’s always the case when day trading.
Entry on Belt Hold Line Candle
When you spot a belt hold line candlestick, you want to open a position in the direction of the candle.
It’s literally that simple!
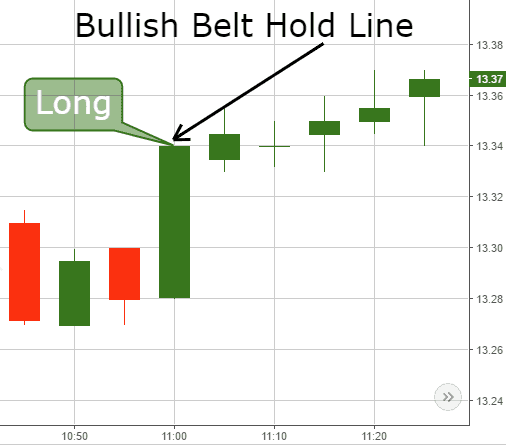
Bullish Belt Hold Line Pattern
Above you see an example of a bullish belt hold line. This is a big bullish candle and a day trader should go long right after the candle closes as shown on the image.
Stop Loss on Belt Hold Line Candle
Like in every other trade, you should always protect your belt hold trades with a stop loss. Your stop loss should be placed directly beneath the low of the entry candle.
However, since the marubozu candle appears during higher volatility, the price action will often touch the stop if placed right on the other side of the candle.
Therefore, I recommend you place the stop one candle away from the marubozu.
Hence, if you are buying a stock on a belt hold signal, you should place your stop loss below the low of the candle that precedes the closing marubozu candle.
Conversely, if you are selling a security on a belt hold signal, your stop loss order should be located above the candle that precedes the marubozu.
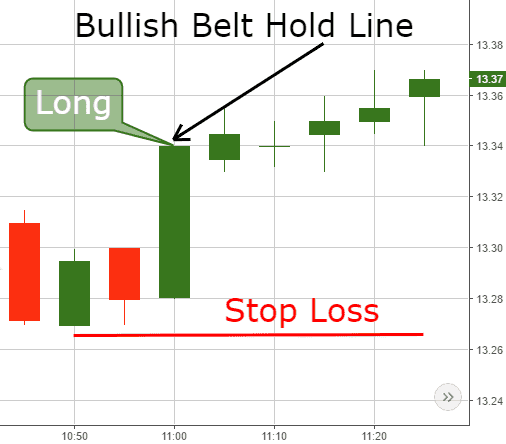
Bullish Belt Hold Line – Stop Loss
You are now looking at the same Bullish Belt Hold example. However, this time we added a stop loss order below the lower candlewick of the previous candle.
Again, the bullish or bearish belt hold line candlestick is often large in size relative to the preceding candlesticks. So, you have to be prepared for the volatility as the stock retraces its move from scalpers taking profits.
So, picking the previous candles extreme point as a stop loss level, helps prevent you from getting stopped out before the run.
Profit Targets with the Belt Hold Line Candlestick Pattern
When you implement a belt hold line trade you should set a preliminary target.
The first option is to close your position once the stock runs at least twice or three times the size of the marubozu candlestick pattern.
The other profit-taking approach is to use price action rules to determine when to exit your trades.
This of course will require more skill and most importantly discipline to allow this level of subjectivity into your trading system.
Belt Hold Line Trading Strategy
Now that you are familiar with the belt hold line candlestick pattern and the associated trading rules, I will now show you a few real-life examples.
We will enter our trades right after the closing of the marubozu candle of the belt hold pattern. Our stop loss will be located on the opposite side of the candle that precedes the marubozu candle.
We will stay in our trades until the price action completes twice the size of the closing marubozu.
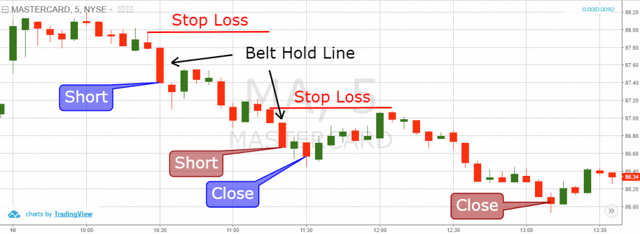
Belt Hold Line Trading Strategy
Above is the 5-minute chart of Master Card. The image illustrates a couple of belt hold line trades.
The image starts with a slight price decrease. Suddenly, the price action closes a relatively big bearish marubozu candle. This confirms the presence of a bearish belt hold candlestick pattern.
Therefore, we short MA (blue) as prescribed in the trading strategy.
Notice that our stop loss is located above the candle, which comes before the marubozu.
After we enter the trade, the price creates a slight correction and then resumes the bearish trend. However, right before the price action completes twice the size of the candle pattern, we get another bearish marubozu on the chart.
Therefore, we confirm a second belt hold line and we short Master Card again (red signal). Again, we place our stop loss above the high of the candle that precedes the bearish marubozu.
A couple of candles after we enter the second trade, the price action completes twice the size of the first marubozu.
However, are you sure you are not forgetting something? Exactly! We have a second trade open! Now we pursue twice the size of the marubozu we used to open that position.
The interesting here is that the price action enters a strong correction of the bearish trend. The Master Card stock starts increasing slightly and goes above the marubozu candle. This is why I told you always to use the candle above when setting your stop loss. This way our stop contains the price action in a very good way and the MA stock doesn’t touch our stop. We are still in the game!
The price action then resumes the bearish trend. The price decreases with twice the amount of the opening marubozu and our target is completed and we close the trade.
Let’s now go through another belt hold trading example.
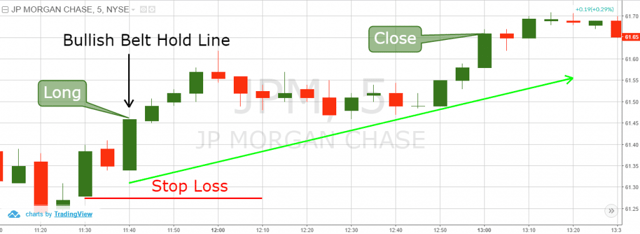
Bullish Belt Hold Line – Trading Strategy
You are now looking at the 5-minute chart of JP Morgan Chase & Co. The image illustrates a bullish trade based on a bullish belt hold candle.
The chart starts with a price reversal in the first four candles. A couple of candles later, the price action closes a bullish marubozu, a.k.a. a bullish belt hold line. Therefore, we open a long trade as stated in our strategy.
Notice that the previous candle is located above the bullish marubozu. For this reason, in order to set up our stop loss, we use the last candle, which has its body below the opening price of the marubozu. The point is to have the stop a bit below the belt hold line.
After we enter the trade, JPM begins to increase.
When the first impulse is completed, the price enters a correction phase, followed by a new trend impulse. The second trend impulse pushes the price action to reach twice the size of the body of the bullish marubozu, which is our exit signal.
The profit taking strategies of these two trades were based on twice the size of the belt hold pattern. Let’s now review a strategy, where the profit taking strategy relies solely on price action.
Bullish Belt Hold Line – Stop Loss based on Price Action
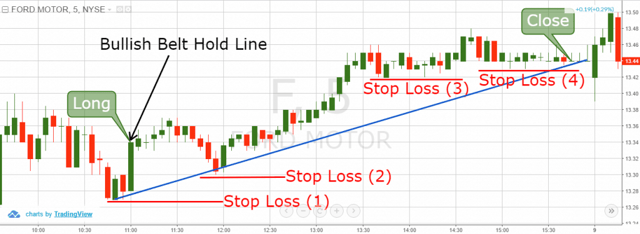
This is the 5-minute chart of Ford Motor Company.
The trading action begins with a price decrease. Suddenly, a bullish marubozu prints on the chart.
Since we get the bullish belt hold on the chart, we buy Ford. The stop loss (1) should be placed at the low of the previous candle as shown on the image.
Ford begins to rally after and slight correction.
Since we follow the price action, we adjust the stop to the bottom of the correction. We now have two bottoms on the chart and we use them to build a bullish trend (blue). This trend could be used to close the trade in case of a breakout. The next trend impulse is stronger. The price increases further and creates another bottom, where we place our third stop-loss order. Now we have a locked-in profit, which is guaranteed by the stop. The next price increase is slight and the price enters a consolidation phase afterwards. We use the lower level of the consolidation for our fourth stop loss.
The consolidation then brings the price to the blue trend. At the same time comes the end of the trading session, therefore we close the trade.
You of course can use more complicated price action rules to exit the trade, but you will find often than not, trend lines and candlesticks will do the trick.
Conclusion
- The belt hold line is a marubozu candle.
- The belt hold is a trend continuation pattern.
- There are two types of belt hold line candles:
- Bullish belt hold line (bullish marubozu)
- Bearish belt hold line (bearish marubozu)
- When you see a belt hold candle pattern, you should enter the market in the direction of the formation.
- You should place a stop loss on your belt hold trades beyond the high or low of the preceding candle (depending on the trend).
- You have two options to take profits when trading the belt hold line chart figure:
- You can use the size of the pattern to set a fixed target in advance two or three times the body of the pattern.
- You can use price action rules to determine when to exit the trade.
- If you would like to take a more conservative approach to your trade entry, you could wait for the stock to retrace 50% or more of the marubozu candle. Again, this candle is often huge, so you could limit your risk by waiting for the pullback. Of course, you might miss the trade if it takes off, but I would prefer to protect my account instead of focusing on potential big gains.


 Basics of Stock Trading


