Have you just heard about the volume at price and are wondering what’s the big deal? Well, you have landed at the right place.
In this post, I will discuss how to interpret signals from the indicator when trading. I will take the lens as a day trader, but the same rules apply to other forms of trading, it’s just on a higher time frame.
If you are familiar with volume you will remember the indicator always below the price chart by default in most charting applications.
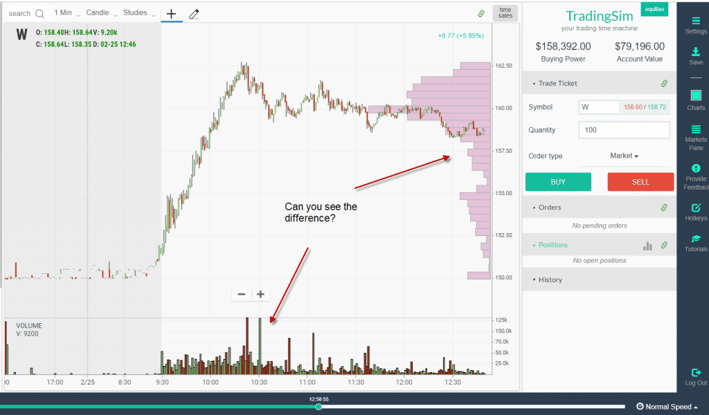
Well, volume at price is slightly different; you will notice the volume is on the y-axis where the price resides and is often an add-on for most charting services. Let’s take a look at a chart example so you can see the contras between volume and volume at price.

Difference Between Volume Indicators
Can you see the difference between the indicators?’
Differences Between Standard Volume and Volume at Price
These are both volume indicators, yet they tell two very different stories.
Standard Volume
The volume on the x-axis which you are likely most accustomed to viewing shows the volume of shares traded as the stock moves forward in time.
Therefore, you will see volume spikes at key price levels where bulls and bears duke it out to see who will win.
You will also see volume dry up as the stock moves from morning to midday trading and then another increase by the end of the day.
This gives the volume on the chart a sort of crescendo or “U” shape.
Volume at Price
Volume at price is void of the concept of time. The indicator is more focused on informing you what shares were traded at a specific price level.
Why is this important?
Well, it can show you where the majority of investors are placing their bets. This insight will let you see how much support or resistance is present at a certain price level.
How Analysis Techniques Will Differ
Now that we have covered the basics let’s dive into how analysis using each indicator will yield different results.
Large Volume Zones
As you review a chart, you will notice large volume zones. Think of these as areas of major activity on a chart. This activity can take place over a few hours or a few days if you are active trading.
The one thing these areas will have in common is that they are consolidation areas.
As a trader, you will want to observe these areas and look for breakout or breakdown opportunities.
The key is to observe if a level is broken, how many traders are looking to fight you on the other side of the trade.

Volume at Price Breakout
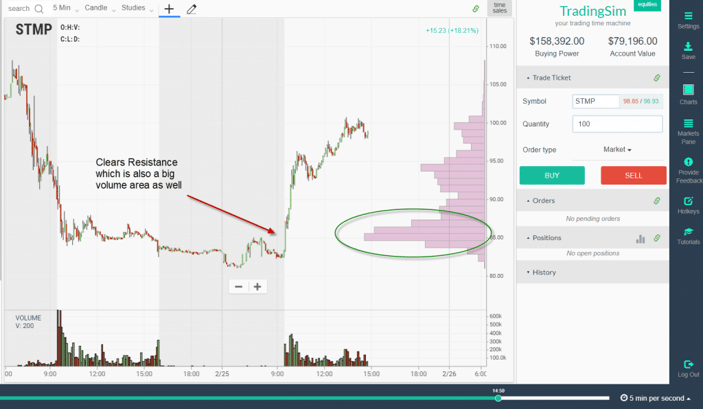
In the above chart of STMP, notice how the consolidation zone had significant volume and was then broken in the morning with strength.
Next, notice how above the resistance level of $87 the volume at price is non-existent. This is a clue that there weren’t as many sellers bringing the price down to its low area prior to the consolidation,
These are the breakouts you want to target as you have both little price or volume resistance fighting you on the way to profits.
The key difference in the analysis with volume at price as you can see is that I was not overly concerned about the volume of one individual candlestick. My focus was on the bigger picture of both the consolidation range and the overhead resistance.
How Volume at Price Can Identify False Breakouts

Valid Price Breakout
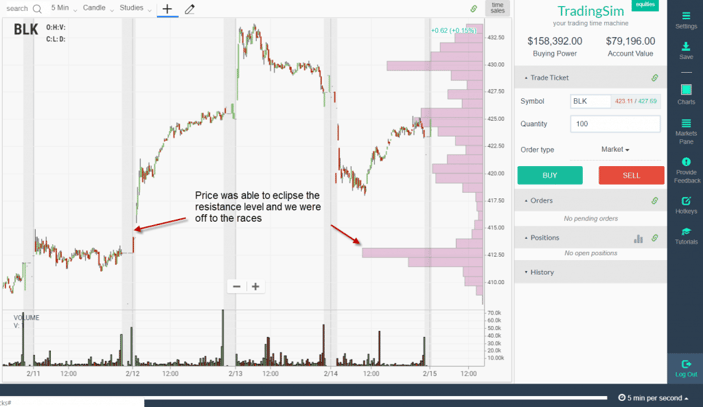
You can see how volume in this next example of the stock BLK was able to clear resistance with heavy volume. The stock then went on a parabolic run.
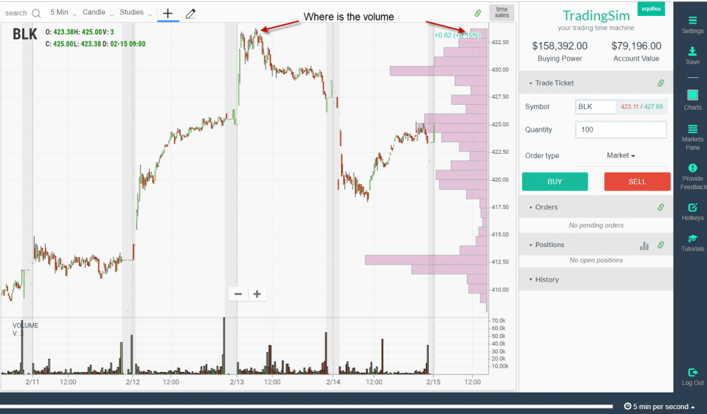
However, notice how as the stock approached the next breakout level the day after, the volume never materialized.

Where is the volume?
With this overwhelming lack of volume, what do you think happened next? That’s right, BLK rolled over.
The stock then developed a tight range with a considerable amount of volume throughout the remainder of the day. Once this level was breached the next morning, the stock plunged lower.
How Can Volume at Price Mislead You?
When you are looking at static charts at the end of the day, the volume at price will appear so obvious. You will see every opportunity as clear as day.
However, remember in real-time, the volume levels are printing as the stock is moving. So, there will be head fakes which occur that you have to be aware of.
To protect yourself from these fake signals, focus on the big areas of consolidation. You can wait for the breakout and then look at the standard volume on the x-axis to see if the volume is high.
This will let you know that there is a higher probability the stock will continue in the direction of the breakout.
Also, do your homework in the pre-market. If you are looking to day trade morning breakouts, keep an eye on what levels the stock is setting up to clear if the pre-market momentum continues.
Looking at pre-market data will also allow you to look at the volume of price from the prior day, which gives you a “fixed” chart to review. It just makes for easier analysis as you can focus on the setup without having to worry about the distraction of scanners and charts printing.
How Can Tradingsim Help?
We have volume at price as a part of our standard indicator set within Tradingsim. You can practice trading the setups identified in this article to see if the indicator is a good fit for your trading style.
Also, check out this awesome white paper by MIT which goes into painful detail of how volume impacts price. You can also use the methods from this write-up to help develop your trading strategy.
The key thing to remember if you decide to test out the indicator is that volume during the day moves in a standard fashion. There are peaks of volume in the morning. Then things get quiet from around 11 thru 2 to 2:30. Then the end of day trading picks up and volume makes its final push for the day.
Good Luck!


 Awesome Day Trading Strategies
