How to Use the Treynor Ratio to Invest in Mutual Funds [Updated June 2026]
Jun 9, 2026
Written by: Ella Vincent
✓ Reviewed by Al Hill, Co-Founder of TradingSim · Updated Jun 10, 2026
There are many ratios to measure a stock’s performance. That is especially true with mutual funds. During bear markets, like the 2020 covid crash, or the 2022 bear market, investing can become uncertain. With that uncertainty, traders want to use the most precise formulas to determine the best mutual funds for investment. The Treynor Ratio is one formula that can measure a mutual fund’s performance.
This TradingSim article will provide an overview of the Treynor Ratio and explain how investors can use the ratio to measure the top 10 mutual funds.
What is the Treynor Ratio?
The Treynor Ratio is a reward-to-volatility formula. The ratio measures an investment’s performance per unit of risk.
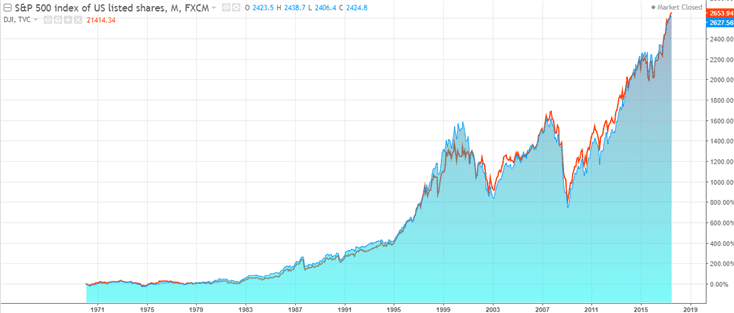
In the Treynor formula, beta is measured in risk. Beta is the measure of a stock’s volatility in relation to a benchmark like the S&P 500. The ratio calculates beta and the returns on risk-free returns.
With the Treynor formula, The S&P 500 usually has a beta of one. Stable stocks have a beta below one. Volatile stocks have a beta over one.
In the Treynor Ratio, the formula is: (Ri-Rf)/B, where:
Ri = return of investment
Rf = risk-free rate (That’s typically the yield on short-term Treasury bills.)
B- = the beta of the portfolio.
Beta is considered to be measured against a key benchmark. It’s measured with the return that could be earned on a risk-free asset like the Treasury bill in the reward-to-volatility ratio. The risk-free rate is subtracted from the portfolio’s return of investment. The result of that equation is divided by the portfolio’s beta. A higher Treynor ratio means that there is a better return.
The S&P 500 and the Dow Jones 30, since 1970s
What do the numbers in a Treynor ratio mean?
A high Treynor Ratio means an investment has added value related to its risk. In contrast, a negative Treynor Ratio means the mutual fund performed worse than a risk-free asset.
Who created the Treynor Ratio?
Jack Treynor was the economist who created the method. He was one of the first economists to discover the capital asset pricing model (CAPM). That CAPM model codified investment return risks that became the basis for the Treynor Ratio.
How can investors use the Treynor formula?
One way for investors to use the Treynor formula is to compare one fund to another. Matt Ahren is a financial advisor with Integrity Advisory in Overland Park, Kansas. He notes how the Treynor Ratio is used to justify risks in investments.
“I manage the portfolios for our firm, so if I am reviewing an individual fund then I first look at the fund’s beta to see how much market risk that manager is taking,” said Ahrens.
Aherns inspects a mutual fund’s Treynor formula to see if a portfolio’s performance justifies its risk.
“Then I look at the Treynor ratio to see how much return am I getting per unit of risk. Basically, am I getting bang for my buck?” said Aherns.
What is the Treynor Ratio’s legacy?
Robert Merton actually knew Jack Treynor well. He is a Nobel Prize-winning economist at the Massachusetts Institute of Technology. Merton credits Treynor with bringing more mathematical analysis to finance.
“It wasn’t that he just did a particular theory,” he said. “He was very creative and also was a leader in bringing the quantitative finance science to finance practice. That was his bridge.”
Bruce I. Jacobs is a principal of Jacob Levy Equity Management. He also credits Treynor for bringing mathematical formulas to better analyze stocks and mutual funds.
“Jack had incredible insights about the markets and models and helped bring quantitative finance into practical application,” said Jacobs.
How Treynor Ratio is vital to analyzing risk
MIT finance professor Andrew Lo also praised the Treynor Ratio and CAPM. He also credits the Treynor Ratio with acknowledging the importance of beta when analyzing a stock.
“In part, it acknowledges that there’s a trade-off between risk and return and CAPM quantified what the trade-off is. That relationship is what gave rise to the notion of beta,” said Lo in a Washington Post article.
In addition, Lo also noted that the beta of a mutual fund can be crucial to measuring a mutual fund’s risk.
“So, when we talk about the beta of a stock, that comes out of that framework. When we do discounted cash flow analysis, we’re using some kind of cost of capital. CAPM is the tool we use to calculate that cost of capital,” added Lo.
Treynor Ratio builds on work of Sharpe Ratio
The Treynor formula builds on the work of fellow economist William Sharpe. Lo noted that the capital asset pricing model championed by economists is vital to the mutual fund industry.
“CAPM is also the basis of the mutual-fund industry, particularly for passive investing. You ought to just buy and hold the market, and you’ll do just fine,” continued Lo from the Wa-Po article.
“Vanguard[ a large mutual fund corporation] and all of the index funds out there came about because of the contributions of Sharpe, Treynor, and others made in finding the capital asset price model. The multi-trillion-dollar passive-index business — we can thank Sharpe and Treynor for that wonderful gift,” added Lo.
Michael B. Miller, CEO of Northstar Risk, also noted the importance of the Treynor Ratio in evaluating the performance of mutual fund portfolios. While he’s critical of the method, he still praises the Treynor ratio as effective.
“The ratio is motivated by two important concepts First, you should care about risk-adjusted returns, not absolute returns,” said Miller.
“Second, in a well-diversified portfolio, you should worry more about the macroeconomic factors that could impact your portfolio and less about the risk from individual securities,” added Miller.
What is the difference between the Sharpe ratio and Treynor Ratio?
The Treynor formula builds on a previous measurement of the Sharpe Ratio. Both formulas can be beneficial to an investor to assess mutual fund investments. William Sharpe created the formula to help investors understand the risk of an investment in relation to its return.
The Sharpe Ratio is similar to the Traynor Ratio because they both assess risks of portfolios. While both formulas have similarities, there are differences between the two ratios.
The Treynor Ratio assesses a systemic risk of a portfolio against a benchmark like the S&P 500. However, the Sharpe Ratio measures the performance of a portfolio based on the overall total risk of a portfolio.
William Sharpe creator of Sharpe ratio, a counter to Treynor Ratio
What is the Sharpe Ratio formula?
The Sharpe Ratio equation is:
(Rp – Rf)/σ , where:
Rp = return on portfolio
Rf = risk-free rate
σ = standard deviation on the return of the portfolio
The Sharpe Ratio subtracts the risk-free rate of return from a portfolio’s return. The result is divided by the investment’s return’s standard deviation. A standard deviation measures the investment risk in a mutual fund. It’s applied to an investment’s annual rate of return to calculate risk.
The higher the Sharpe ratio, the better for a mutual fund. A Sharpe Ratio of 1 and over is considered good for a mutual fund. A negative Sharpe Ratio means the expected return may be negative. The negative quotient could also mean that the portfolio’s return is worse than the risk-free rate.
Which is better to measure mutual funds, the Sharpe Ratio or Treynor Ratio?
Both formulas can effectively measure the performance of a mutual fund. However, there are two differences between the measurements. The Sharpe Ratio can be applied to all portfolios that are in specific sectors.
In specific sectors, specific mutual funds may have unsystematic risk as to the best measure of risk. In that case, the Sharpe Ratio may be the better formula because it measures overall risk.
However, with the Treynor Ratio, there is a difference. The Treynor Ratio measures systematic risk. Unsystematic risk is not a factor with diversified mutual funds.
Because of that, the Treynor Ratio can measure systematic risk. The Treynor Ratio can be a better metric to evaluate the performance of a well-diversified mutual fund portfolio.
What are the downsides to the Treynor ratio?
While the Treynor Ratio can be an effective measure of a portfolio’s performance, it’s not perfect. Some financial experts say that the metric has a downside.
S. Michael Sury is a lecturer in finance at the University of Texas at Austin and studies the Treynor index. He noted that the Treynor formula isn’t perfect because it only looks at past performance.
“Treynor ratio does have some drawbacks. Importantly, by definition, it is a backward-looking ratio. Thus, it tends to be more useful for its evaluative – rather than its predictive – power,” said Sury.
Some financial experts like Aherns believe that a mathematical analysis may not be the best way to analyze stocks for beginning traders.
“The trap do-it-yourselfers fall into is being unable to decipher where outperformance is coming from,” said Ahrens.
In addition, Aherns also noted that taking on more risk may benefit them more than using the Treynor formula to calculate risk.
“A manager may be performing well versus their peers just because they are taking on more market risk,” said Ahern.
Is the Treynor Ratio helpful to investors?
While many financial advisors use the Treynor Ratio, there are financial managers that aren’t fans of the formula.
“At the end of the day, over 90 percent of an investor’s lifetime return is a result of two things. The first is their allocation to equities versus fixed-income,” said Ruedi.
“And second to that, but probably just as important – or maybe even more important – how they behave when the portion of their portfolio that is invested in the great companies of the U.S. and the world is temporarily down 30 percent or 50 percent,” added Ruedi.
In addition to that, Ruedi also believes that the Treynor ratio return is not an accurate measurement of a mutual fund’s return.
“Nobody goes into the grocery store with their Treynor ratio return, they go into the grocery store with their actual return,” said Ruedi.
While the Treynor Ratio may not be for every investor, the Treynor formula could be a good option for measuring risk. In the rest of the article, I will analyze comparisons of 10 mutual funds. I will look at their financial statistics to compare the Treynor Ratios of the assets.
Comparison: Fidelity Advisor Series Growth Opportunities Fund vs. Morgan Stanley Insight Fund Class A
Fidelity Advisor Series Growth Opportunities Fund ( FAOFX) is a mutual fund that tracks growth stocks. As an example, in 2020 the mutual fund had tech holdings like Tesla (NASDAQ:TSLA) and Uber (NASDAQ:UBER). Because of those stocks, Fidelity Advisor Series Growth Opportunity Fund had a high 1-year annual return of 12.55%.
Tesla stock rises after reopening factory
Tesla stock helped Fidelity Advisor Series Growth Opportunities Fund increase its annual return. The corporation’s controversial founder, Elon Musk is famous for his comments. Musk gets as much attention for his tweets as much as his company’s electric cars.
Musk defied California’s shelter-in-place orders to increase production at Uber’s Fremont factory. He tweeted about resisting the order on Twitter.
“Tesla is restarting production today against Alameda County rules. I will be on the line with everyone else. If anyone is arrested, I ask that it only be me,” tweeted Musk.
Tesla stock jumped 4% after the factory recently reopened after gaining county approval.
“We have local support to get back to full production at the factory starting this upcoming week. We’re excited to continue to get back to work,” said Shelby.
The growth of Tesla stock helped Fidelity Growth Opportunities Fund have a strong annual return.
What’s the Treynor Ratio of Fidelity Growth Opportunities Fund?
I will explain the Treynor Ratio of the fund with a risk-free rate of 0.16%. This risk-free rate I chose is based on the yield of the one-year Treasury rate as of May 6, 2020.
The average annual return on the Fidelity Growth Opportunities Fund is 12.55%. Once that is calculated, the risk-free rate of 0.16% is subtracted from the return. After that, the result is divided by the beta. The beta, in this case, will be 1.1, the current benchmark of the S&P 500.
With those statistics, the Treynor formula would be:
12.55%-0.16%/1.1=0.01.
With that equation, The Treynor index would be 0.01. The quotient is below 1, which could potentially be a low number for potential investors. However, in comparison to other similar figures in the 0-1 range, the Treynor formula can vary in its risk-to-reward quotient.
As a result, the risk is increased with this portfolio if compared with other mutual funds. However, I will now examine the Treynor Ratio comparison to the Morgan Stanley Insight Fund Class A.
Morgan Stanley Insight Fund Class A
As a potential investment, Morgan Stanley Insight Fund Class A(NYSE: CPOAX) is a mutual fund that has a high annual return of 19.37%. Along with the high annual return, the risk-free rate is 0.16%. The beta will be 1 in this example.
With that risk-free rate, the Treynor formula would be:
Ri-Rf/B
19.37%-0.16%/1=0.19.
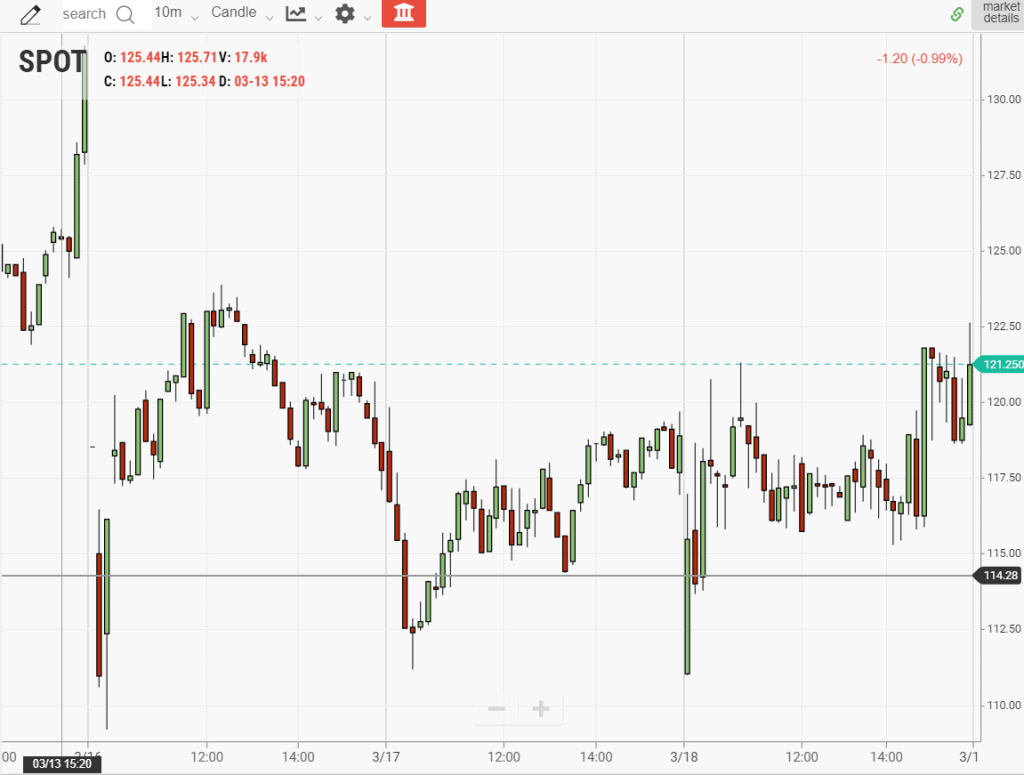
Spotify stock helps Morgan Stanley fund
With well-performing holdings, the Morgan Stanley fund has less risk. Spotify(NASDAQ: SPOT) is a holding that has helped Morgan Stanley’s Insight Fund Class A grow. The streaming company’s Q1 revenue in 2020 increased to $1.90 billion because of many people being quarantined.
Spotify stock
With many people sheltering in place during Covid, Spotify noted that the number of paid subscribers climbed to 130 million.
Because many people were at home, Spotify was like a background soundtrack.
In the quarantine era, Spotify listeners are more devoted to the service. “Listening time around activities like cooking, doing chores, family time, and relaxing at home have each been up double digits over the past few weeks,” noted Spotify in a statement.
Joe Rogan signing sends Spotify stock soaring
In addition to a positive earnings report, Spotify’s stock surged by 8% . That jump came after popular and controversial podcaster Joe Rogan moved his program to the streaming service.
“The Joe Rogan Experience, one of the most popular podcasts in the world, is coming to Spotify via a multi-year exclusive licensing deal. The talk series has long been the most searched-for podcast on Spotify and is the leading show on practically every other podcasting platform,” said Spotify.
With this new addition to its podcast stable, Spotify has become a holding that helped lessen the risk of the Morgan Stanley Insight Fund Class A.
Which Treynor Ratio is higher: Fidelity or Morgan Stanley?
In comparison between the Fidelity mutual fund’s 0.01 and Morgan Stanley’s 0.19, the Morgan Stanley Insight Fund Class A has a higher Treynor Ratio.
In that equation, the Treynor Index would be 0.19. Even though they’re both below one, the Morgan Stanley Ratio has a higher Treynor index than the Fidelity mutual fund. Because Morgan Stanley Insight Class Fund A has a higher Treynor ratio, it has less risk than the Fidelity Growth Opportunities Fund.
T. Rowe Price Global Technology Fund vs. Janus Henderson Global Technology
With tech stocks, the T. Rowe Price Global Technolgy Fund ( NASDAQ:PRGTX) and the Janus Henderson Global Technology mutual funds have performed well this year. Though they’re in the same sector, the T. Rowe Price fund has been singularly praised as of the best mutual funds of the decade.
T. Rowe mutual fund a top investment
The T. Rowe Price Global Technology Fund “invests primarily in companies we expect to generate a majority of revenue from development, advancement, and user of technology.” With that mission statement, the fund had an annual return of 12% as of 2020 with its tech holdings like Facebook and Netflix.
Facebook stock part of successful T. Rowe mutual fund
Facebook was a holding that helped the T. Rowe Price fund become a top mutual fund. As part of the fund, Facebook earned $17. 74 billion in its Q1 2020 earnings.
Despite economic volatility, Zuckerberg wants to expand into online shopping to reach more customers.
“I’ve always believed that in times of economic downturn the right thing to do is to keep investing and building the future,” said Zuckerberg.
With Facebook’s Q1 2020 success, “This is really the first very major push that we’re going to be making into that next step around commerce,” said Zuckerberg.
“All these tools are open for business even when your physical storefront can’t be,” added Zuckerberg.
Netflix part of T. Rowe mutual fund growth
In addition to Facebook, Netflix is a strong tech holding in the T. Rowe Price Global Technology Fund. The streaming service saw a whopping 35% growth in its stock in 2020.
With that success, Netfiix has been a stock that’s helped the T. Rowe mutual fund. Michael Bapis is the managing director of Vios Advisors at Rockefeller Capital Management. He spoke about Netflix’s subscriber growth.
“Demand is off the charts right now, and it’s the integral driver for Netflix. You’re going to have subscriber growth continue to grow. It’s a massive market and people aren’t going to go to the movies. I think they are starting to capitalize on a massive market,” said Bapis.
As Netflix grows, “They’re[ Netflix] going to keep market share at this point because they offer the best product,” added Bapis.
What is the Treynor ratio of T. Rowe Price Global Technology Fund?
With that success, the Treynor ratio of the fund can be calculated, where:
Ri-Rf/B: 12%-0.16%/1=0.12.
In that equation, the Treynor Ratio will be 0.12.
Janus Henderson Global Technology Fund
In contrast to the T. Rowe fund, the Janus Henderson Global Technology Fund(NYSE:JANIX) had a lower annual return. As of May, 2022, the Janus mutual fund’s annual year-to-date return is 6.23%. Despite the lower return, the fund has many strong holdings in its portfolio.
Microsoft a strong buy in Janus Henderson Global Technology Fund
Microsoft
As Goldman Sachs analyzes stocks, Microsoft is a strong holding in the Janus mutual fund. Goldman Sachs rated the software giant’s stock as a buy.
“Our partner checks continue to reflect the relative strength in the AWS platform, as incremental demand from customers to accelerate their migration into the cloud,” said Goldman Sachs in a statement.
In its analysis, Goldman Sachs noted that Microsoft can ”provide full virtual-desktop coverage (AWS WorkSpaces), and other work-from-home and business continuity needs.
In its earnings report, Microsoft noted that “cloud usage increased, particularly in Microsoft 365, including Teams, Azure, Windows Virtual Desktop, advanced security solutions, and Power Platform, as customers shifted to work and learn from home.”
What is the Treynor Ratio of the Janus Technology Mutual Fund?
As a result of Microsoft’s strong performance, the Janus mutual fund has performed relatively well. With the current statistics, the Treynor formula for the Janus Technology Mutual Fund would be:
Ri-Rf/B, where: 6.23%-0.16%/1.1=0.06.
Which Treynor Ratio is higher: T. Rowe or Janus?
With the comparison between the two tech mutual funds, 0.12 is greater than 0.06. The T. Rowe Technology Fund has a higher Treynor Ratio than the Janus Technology Mutual Fund.
Vanguard Healthcare Fund
In this COVID-19 era, the Vanguard Healthcare Fund(NYSE:VGHCX)has outperformed other mutual funds. The mutual fund’s annual return was an impressive 17.35% by May of 2020. Vanguard Healthcare Fund’s returns are doing well because of its healthcare holdings. One holding that is helping the Vanguard Healthcare Fund is Pfizer.
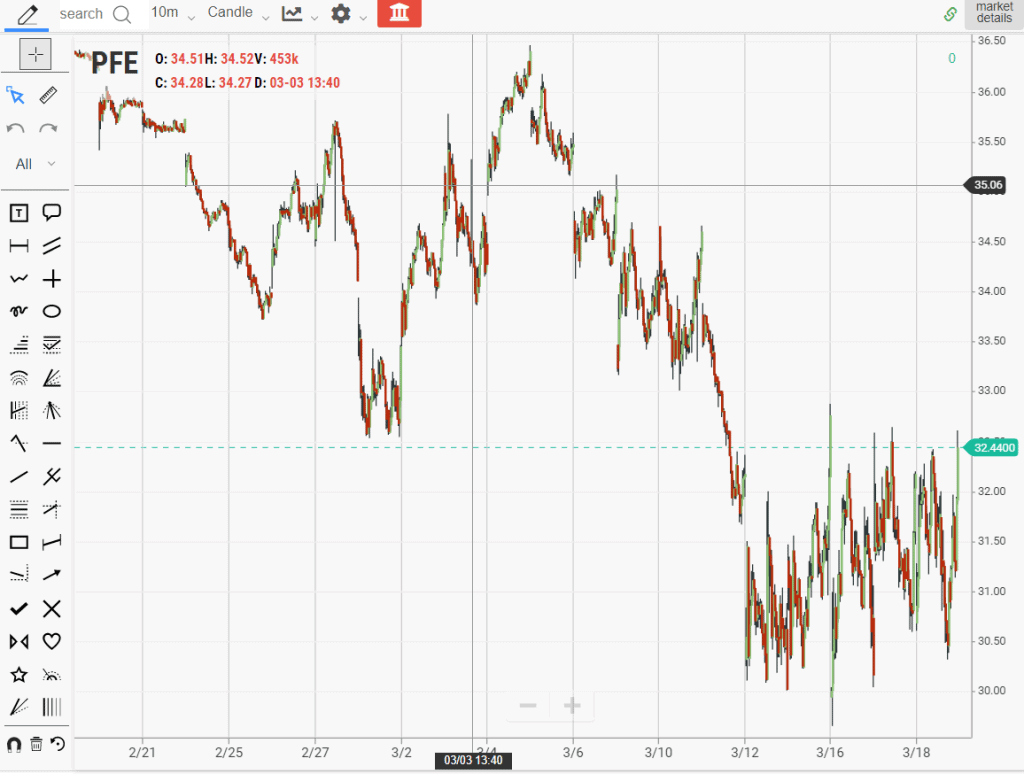
Pfizer COVID-19 vaccine trial gives stock a boost
Pfizer(NYSE:PFE) stock grew 35% despite a declining stock market in 2020. The pharmaceutical company was working on a promising vaccine for COVID-19. As Pfizer CEO Albert Boula noted, the company is gathering information for its trials.
“We are collecting data as we speak in real time so we know, we are monitoring the safety of the doses,” said Bourla.
BNT162 is the potential vaccine that is being tested later this year. The corporation hopes to have 360 people in a clinical trial. If this vaccine is successful, Bourla hopes that the treatment will be available by the end of the year.
Pfizer stock
“If things go well, and we feel that the product is safe and efficacious, and the FDA [Food and Drug Administration] and EMA [European Medicines Agency] and other regulatory agencies feel the same, we will be able to deliver millions of doses in the October time frame,” said Bourla.
Pfizer plans to produce hundreds of millions of the potential COVID-19 vaccine by next year. With Pfizer’s promising vaccine, the Vanguard Healthcare Fund has been a reliable mutual fund for investors.
What is the Treynor Ratio of the Vanguard Health Care Fund?
With a high annual return of 17.35%, the equation would be:
Ri-rf/B, where: 17.35-0.16%/1.1=0.16
In that equation, the Treynor ratio of the Vanguard Health Care Fund is 0.16.
Invesco Health Care Fund Class A
The Invesco Health Care Fund Class A (NYSE:GGHCX) had a well-performing one-year return of 15.61%. The portfolio has outperformed because of Abbott Labs, one of its successful holdings.
Abbott Lab stock rises on COVID-19 antibody tests
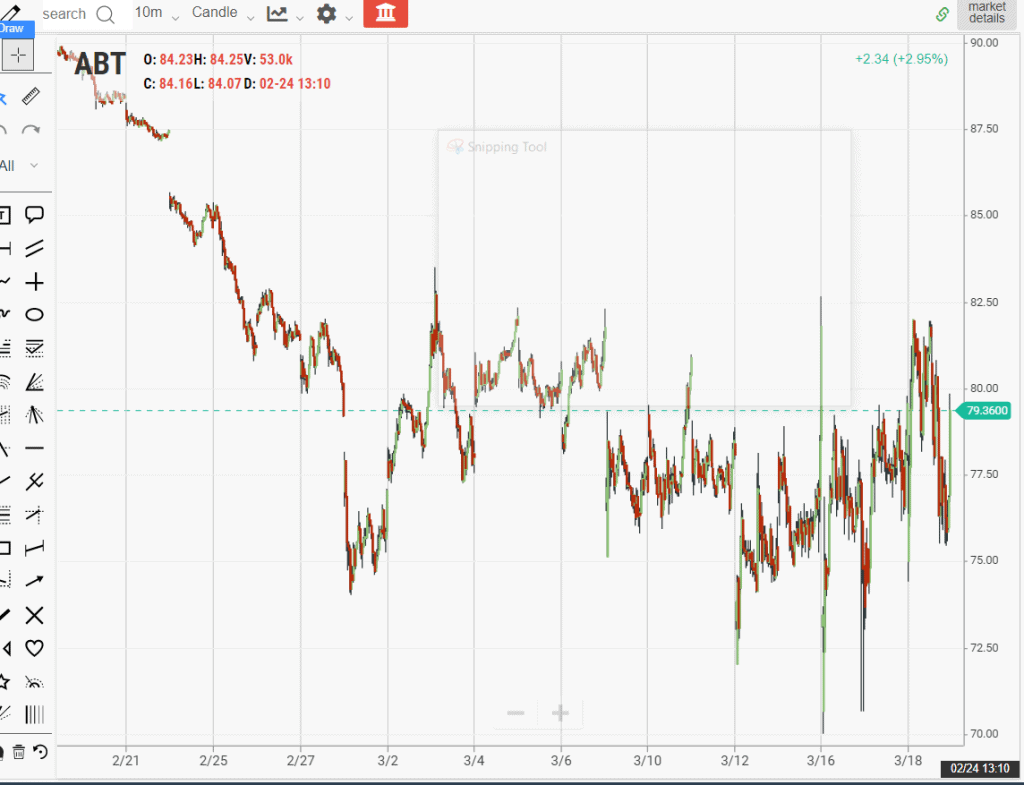
Abbott Laboratories (NYSE:ABT) is an Invesco Health Care Fund holding that’s rising in the COVID-19 era. The stock rose 8.6% year-to-date with its antibody tests to detect the virus.
As the coronavirus crisis continues, Abbott is developing antibody tests for the virus. The corporation received Food and Drug Administration approval for more antibody tests for COVID-19.
Abbott stock
With this second authorization, Abbott hopes to ship 30 million antibody tests to hospitals and potential patients.
“We wanted to provide hospitals and labs with as many broad and reliable testing options as possible during this pandemic,” said an Abbott spokesperson.
What is the Treynor Ratio of Invesco Health Care Fund Class A?
As Abbott Labs raises the Invesco Health Care Fund’s annual return, the Treynor ratio can be calculated. The formula is:
Ri-rf/B, where:
15.61-0.16/1.1=0.14
In this quotient, the Treynor Ratio is 0.14.
Which Treynor ratio is higher: Vanguard or Invesco?
In this comparison of the healthcare mutual funds, Vanguard’s 0.16 is greater than Invesco’s 0.14. The Vanguard Health Care Fund has a higher Treynor Ratio than Invesco’s Health Care Fund Class A.
JP Morgan Large Cap Growth Fund
The JP Morgan Large Cap Growth Fund( NYSE:OLGAX) is a large-cap mutual fund with a healthy 12% annual yield. The mutual fund has some of the fastest-growing companies in its portfolio.
AMD recession-proof stock in JP Morgan portfolio
AMD(American Micro Devices)(NYSE:AMD) was a holding in the JP Morgan Large Cap Growth Fund in 2020 that was performing well during the recession. The semiconductor company was performing well as its computing revenue grew.
“While we expect some uncertainty in the near-term demand environment, our financial foundation is solid and our strong product portfolio positions us well across a diverse set of resilient end markets,” said SU in a statement.
“We remain focused on strong business execution while ensuring the safety of our employees and supporting our customers, partners and communities. Our strategy and long-term growth plans are unchanged,” added Su.
What is the Treynor Ratio of the JP Morgan Large Cap Growth Fund?
When finding the Treynor index of the JP Morgan Large Cap Growth Fund, this is the equation:
Ri-Rf/B, where:
12-0.16%/1.1=0.11
In this case, the Treynor Ratio is 0.11.
Glenmede Quantitative U.S. Large Cap Growth Equity Portfolio
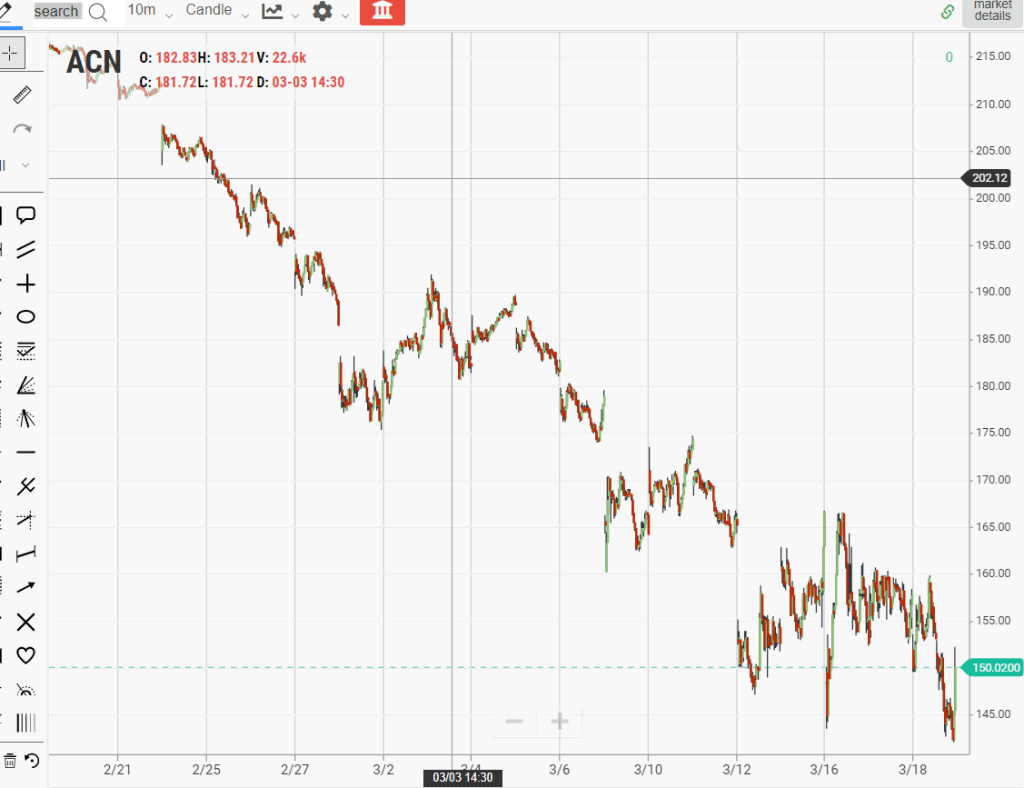
Fidelity’s Glenmede Quantitative U.S. Large Cap Growth Equity Portfolio(NYSE:GTLLX) is another large-cap mutual fund. The fund has large-cap holdings, but has a small one-year return of 1.86% for 2020.
“Accenture remains ‘best in class’ and the recent weakness is an opportunity to gain a position in this IT Services global leader delivering 40% returns on capital,” stated Castillo-Bernaus.
“Accenture has been a pioneer in developing ‘the New’ with 65% of revenues now coming from high growth Digital, Cloud and Security services,” added Castillo-Bernaus.
What is the Treynor Ratio of the Glenmede mutual fund?
In the equation Ri-Rf/B, where:
1.86%-0.16%/1.1=0.02.
The Treynor formula shows the Glenmede mutual fund’s ratio is 0.02.
Which Treynor Ratio is higher: JP Morgan Chase or Glenmede?
When contrasting the JP Morgan Chase and Glenmede’s Treynor indexes, the JP Morgan Chase Large Cap Growth Fund has a higher Treynor Ratio. The Glenmede Quantitative U.S. Large Cap Growth Equity Portfolio has a lower Treynor Ratio, so it may have a lower reward.
State Street Institutional Premier Growth Equity Fund Service Class
The State Street Institutional Premier Growth Equity Fund Service Class mutual fund (NYSE:SSPSX) that features small and medium cap companies. Its annual rate of return is high at 12.80%. United Health is a holding in the portfolio.
United Health a strong holding for State Street
Since healthcare stocks are outperforming, United Health(NYSE:UNH) is a robust part of State Street’s portfolio.
“Overall, UNH produced strong results and seems well-positioned to navigate the COVID pandemic due to a relatively stable top-line, a diversified business mix and a dominant position across its businesses, ” wrote Widerhorn.
What is the Treynor Ratio of the State Street Institutional Premier Growth Equity Fund Service Class?
In the State Street mutual fund equation, where:
Ri-rf/B: 12.80%-0.16/1.1=0.11.
Baron Fifth Avenue Growth Retail Fund
The Baron Fifth Avenue Growth Retail Fund (NYSE:BFTHX) is a mutual fund that invests in large-cap companies. The mutual fund has a hefty 12.70% annual return. One of the Baron Fifth Avenue holdings is the legendary credit card corporation Visa (NYSE:V).
Visa a reliable Baron Fifth Avenue holding as it expands into data
“With insights from data, we can help sellers, financial institutions and Visa’s extended global business network better understand and meet consumer needs, especially when those needs are changing fast,” said Melissa McSherry, head of Visa’s Data, Security, and Identity products.
“While the depth/duration of COVID-19 headwinds are hard to handicap we remain confident in V’s intermediate/long-term potential, wrote Greene.
What is the Traynor formula for Baron Fifth Avenue Growth Retail Fund?
In this equation, where Ri-Rf/B, where:
12.70%-0.16%/1.1= 0.11.
Which Treynor Ratio is higher: State Street or Baron Fifth Avenue?
Since both funds have very similar annual returns, the Treynor Ratios of both funds are the same at 0.11. The State Street Institutional Premier Growth Equity Fund Service Class and Baron Fifth Avenue Growth Retail Fund have equal risk-to-reward ratios.
Treynor formulas can be determined by small differences
The Treynor Ratios of mutual funds can be determined by small factors like decimal points. However, the decimal points in a Treynor formula make a big difference in figuring out a mutual fund’s risk-to-reward ratio. TradingSim charts and analyses can help investors find the best mutual funds with the least risk.
Key Takeaways [Updated June 2026]
The Treynor ratio measures a portfolio's excess return per unit of systematic (market) risk, using beta in the denominator.
The formula is (Portfolio return minus the Risk-free rate) divided by Beta. A higher Treynor ratio means more reward for the market risk taken.
It differs from the Sharpe ratio, which uses total volatility (standard deviation); the Treynor ratio isolates only market risk.
It is most useful for comparing well-diversified portfolios or mutual funds, where company-specific (unsystematic) risk is already minimized.
A negative Treynor ratio is hard to interpret and can be misleading, especially when beta itself is negative.
Frequently Asked Questions
What is the Treynor ratio?
The Treynor ratio is a risk-adjusted performance measure that shows how much excess return a portfolio earned for each unit of market risk (beta). It is sometimes called the reward-to-volatility ratio.
What is the Treynor ratio formula?
Treynor ratio = (Portfolio return - Risk-free rate) / Portfolio beta. The numerator is the return above a risk-free benchmark such as Treasury bills, and the denominator is beta, a measure of sensitivity to the overall market.
What is a good Treynor ratio?
There is no universal threshold; higher is better. The number is only meaningful in comparison, so judge a fund's Treynor ratio against a benchmark index or against peer funds measured over the same period.
What is the difference between the Treynor ratio and the Sharpe ratio?
Both measure risk-adjusted return, but the Sharpe ratio divides excess return by total volatility (standard deviation) while the Treynor ratio divides by beta (market risk only). Treynor suits diversified portfolios; Sharpe suits less diversified ones.
Can the Treynor ratio be negative?
Yes. It turns negative when the portfolio return falls below the risk-free rate, or when beta is negative. Negative values are notoriously hard to interpret and usually should not be compared directly.
Quick Ratio A quick ratio of a company can determine a lot of assets about a corporation. Similar to the Treynor Ratio, a quick ratio formula can help determine a corporation’s financial strength- or...
Sharpe Ratio – 6 Things You Need to Know [Updated May 2026]
In this article, I will cover the Sharpe ratio indicator and if it’s something you can use to track your trading performance. While this ratio is often used for institutions, you can also use it to...
Bull Bear Ratio: A Contrarian Sentiment Indicator [Updated May 2026]
Bull Bear Ratio: A Contrarian Sentiment Indicator [Updated May 2026] By Al Hill · Updated May 23, 2026 The bull bear ratio is a sentiment indicator built from a weekly Investor Intelligence survey of...


 amazon stock


