6 min read
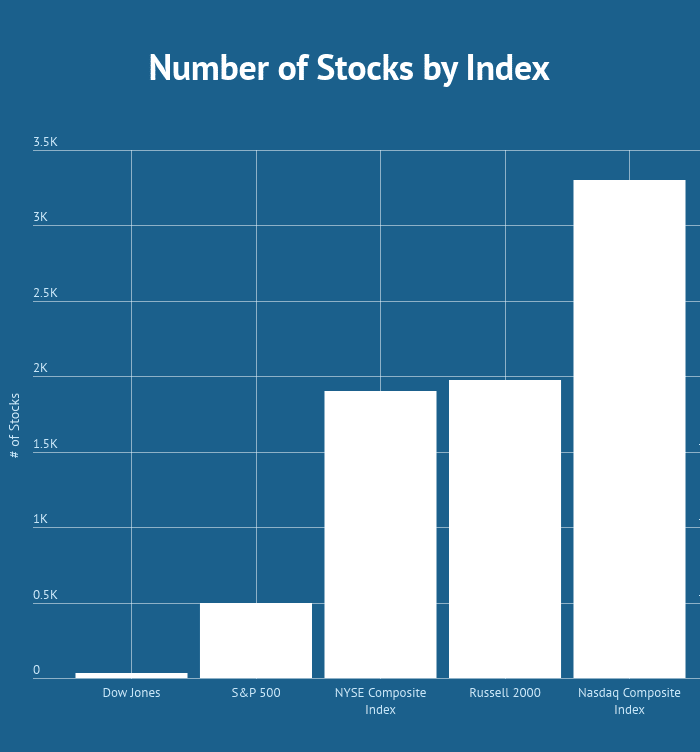
How to Forecast Market Direction Using the Russell 2000 Index [Updated June 2026]
In this article we are going to cover methods you can use today to begin forecasting market direction with the Russell 2000 Index.
Before we dive...


6 min read
In this article we are going to cover methods you can use today to begin forecasting market direction with the Russell 2000 Index.
Before we dive...
8 min read
11 min read
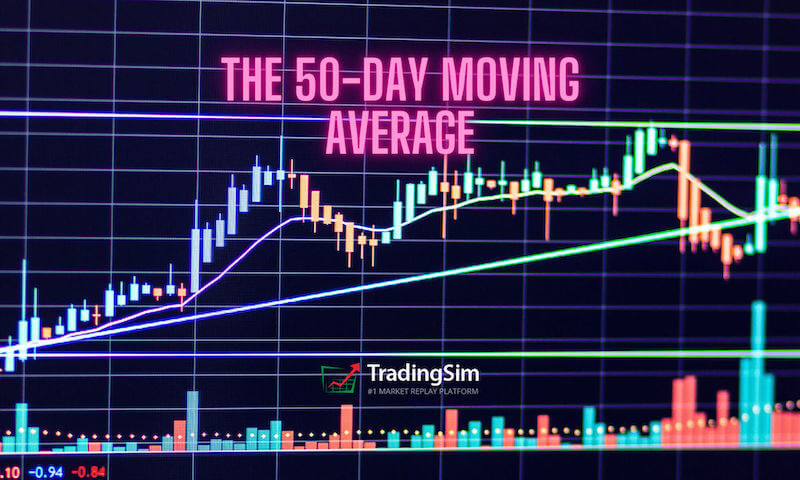
The 50-day moving average indicator is one of the most important and commonly used tools in stock trading. Considered an “intermediate-term”...
13 min read
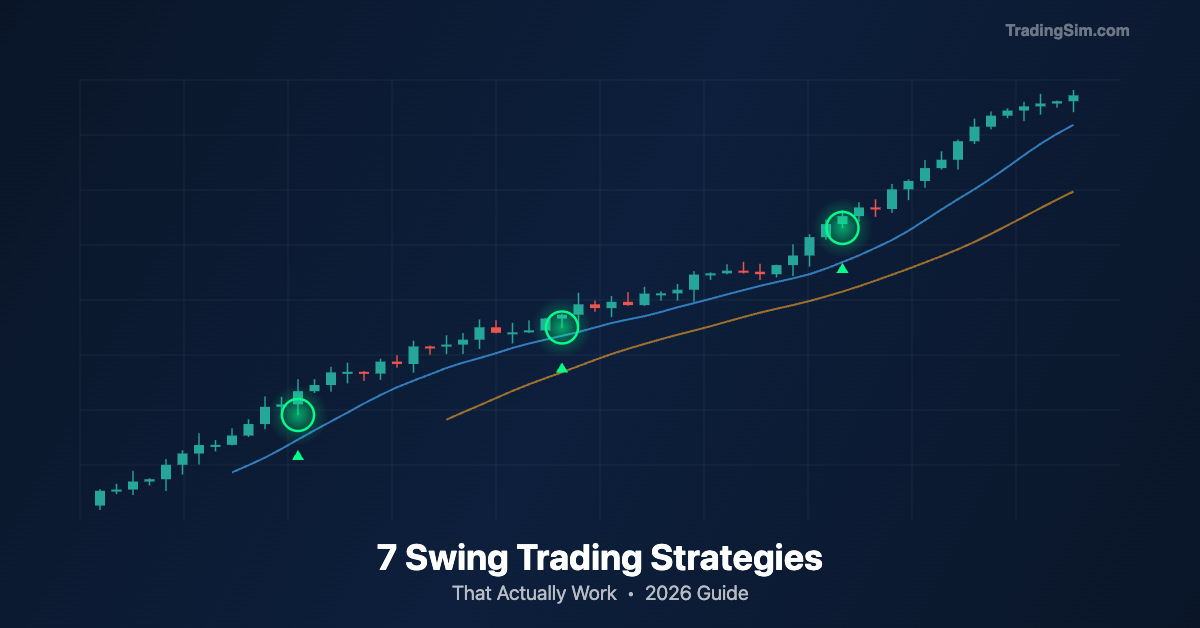
Swing trades held for 2-10 days captured 68% of the S&P 500's total return over the last decade, according to analysis from J.P. Morgan's equity...

8 min read
Traders know these events by a few different names. Perhaps you’ve heard of Stockbee and Qullamaggie’s Episodic Pivot? Or you’ve seen @traderstewie

5 min read
In the sordid world of low float, lower-priced stocks, a lot of what goes on often defies typical volume and price logic. Often, you’ll see...
7 min read
The moving average is one of the most widely used indicators in all of trading. There are different types of moving averages based on the calculation...