Positive Volume Index Definition
The positive volume index (PVI) is an indicator which tracks volume as it increases from the previous day. It was first introduced by Norman Fosback in the book Stock Market Logic. [1] The belief behind the indicator is that as volume increases, the investment community is unified with the current direction of the market.
As this indicator shows the actions of the majority, it is often used as a contrarian indicator. Many professional traders utilize the PVI to assess what the smart money is doing in the market. The assumption is that on quiet days, large institutions are active in the market.
PVI Trading Signals
The most popular signal for the positive volume index is when the index drops below its 1-year moving average. Fosback believes that when this occurs, there is a 67% probability that a bear market is fast approaching.
Positive Volume Index Formula
If the current volume is greater than the previous day, then the PVI formula is as follows [2]:
PVI = Previous PVI + ((Close – Previous Close)/Previous Close) * Previous PVI))
Conversely, if the current day’s volume is less than the previous day’s volume, then the formula for Positive Volume Index is as:
PVI = Previous PVI
Positive Volume Index Chart Example
The indicator is easy to assess on the chart. It almost makes you wonder if it’s really necessary or if you can continue to use a simple 200-period SMA on the chart and call it a day.
Within TradingSim you need to apply a daily day trading chart timeframe in order to display the indicator as it is a long-term trading indicator.

PVI Chart Example
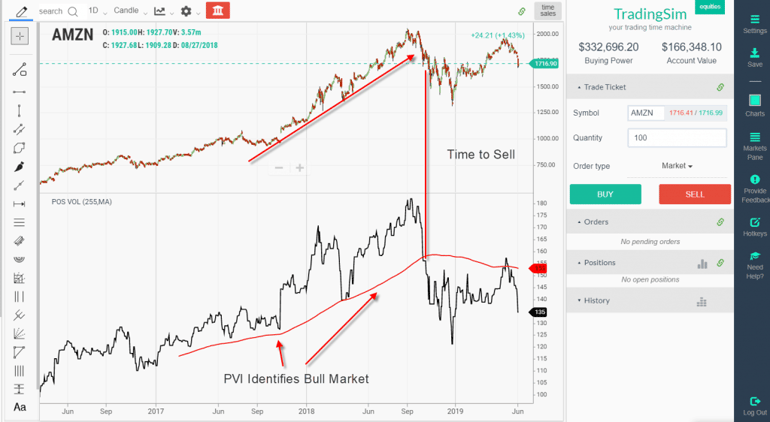
Above is a chart of Amazon. Notice hos the PVI is able to track the bull market of AMZN as the stock screams higher. There are a couple of key items I want to highlight on this chart.
First, on the runup, there was a nasty rundown of the PVI to the 255 MA. This was one of the first signs that the bull market run was possibly in danger.
Next, after the break of the SMA on the PVI it was the sign to either close the long position or to lighten up the position.
The most recent price action while positive appears to be testing the Amazon’s swing high while the positive volume index is backtesting its 255-SMA.
Extreme PVI Readings
In the next chart example, I will cover is when there are extreme readings on the positive volume indicator.

PVI Extreme Reading
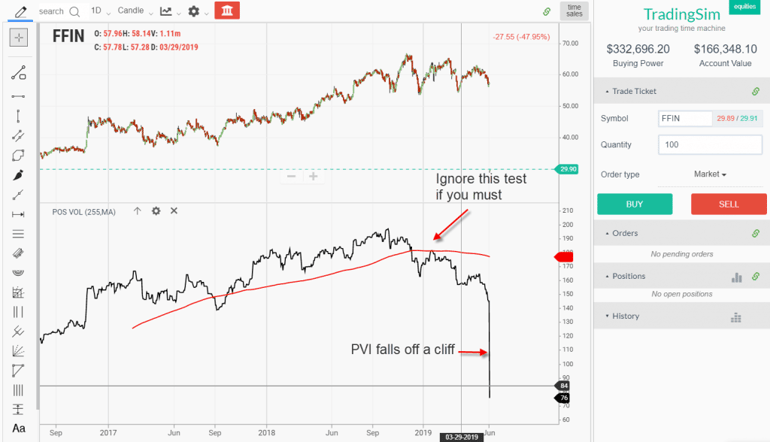
Notice how PVI backtests the SMA 255 a few weeks before the breakdown.
FFIN then had a massive 40% drop a few weeks later. This rapid selloff resulted in FFIN falling into the seventies. Now, this doesn’t mean that FFIN couldn’t have a rally after such a steep selloff, but what it does mean is the stock’s primary trend is bearish.
Higher Readings Does Not Equal Higher Prices

PVI Readings
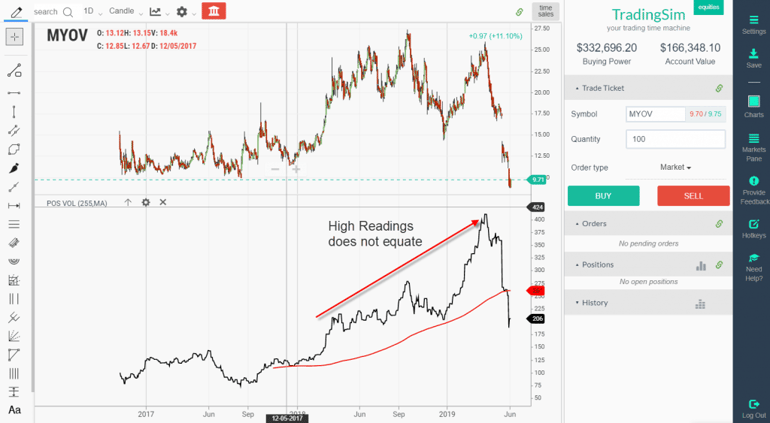
In the above chart example of MYOV, you can see the PVI made a strong push higher throughout 2018 and the first half of 2019. However, the price was stuck in a trading range for this time period. To make matters worse, the price ultimately broke down in the summer of 2019, leading to the PVI breaking its yearly average.
So, what does this tell us about the indicator?
Not a Timing Tool
You should not use the indicator to time market action on a daily or intraday level. The indicator is great for giving you a view into the strength of a stock, but it’s not a measure of how high price will perform.
PVI and Volatile Penny Stocks
PVI is a lagging indicator as trade signals since it factors in 255 trading days. This presents real trouble when trading volatile penny stocks as the moves are swift and unpredictable.

PVI and Penny Stocks
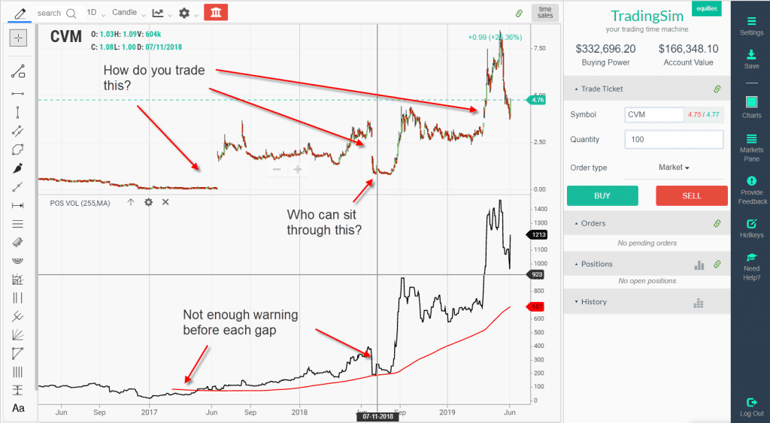
The positive volume indicator does not give any real indication of the massive gap down that took the stock back down to the strong move that began in 2017.
The PVI never broke the 255 moving average, but you would have given back all of the gains made on the first run-up. The stock ultimately moved higher over 2018 and into 2019; however, with such volatile price swings, the indicator provides little forecasting ability.
Summary
In summary, the PVI is a great tool for staying on the right side of the market when trading low volatility stocks. However, if you are planning on trading penny stocks or fast movers, you will want to use indicators that are more reactive and are leading.
How Can TradingSim Help?
You can practice using the PVI indicator in Tradingsim to see if it’s a good fit for your trading style. You can practice with stocks and futures until you find a strategy that works.
External References
- Fosback, Norman. (1991). Stock Market Logic: A Sophisticated Approach to Profits on Wall Street
- Kim, Han. (2000). Positive Volume Index Or Negative Volume Index?. technical.traders.com


 Oscillator Indicators
