

11 min read
Master Chart Patterns: Key Basics Explained
Chart patterns are repeatable price formations on candlestick or bar charts that reveal how groups of traders react and help you estimate what may ...

11 min read
Chart patterns are repeatable price formations on candlestick or bar charts that reveal how groups of traders react and help you estimate what may ...
11 min read
Chart patterns are repeatable price formations traders use to anticipate likely moves. They’re teachable and measurable tools that sharpen timing and ...
13 min read
Chart patterns and market trends are recurring price formations and directional behaviors traders use to read supply and demand, improving the odds ...
10 min read
Day trading is the practice of buying and selling financial instruments within the same market day to capture short-term price moves. This guide lays ...
16 min read
Stock trading fundamentals are the core concepts that explain how markets function, how securities are valued, and how individual traders execute and ...
18 min read
Day trading involves buying and selling financial instruments within the same trading day to capitalize on short-term price swings. For newcomers, a ...
8 min read
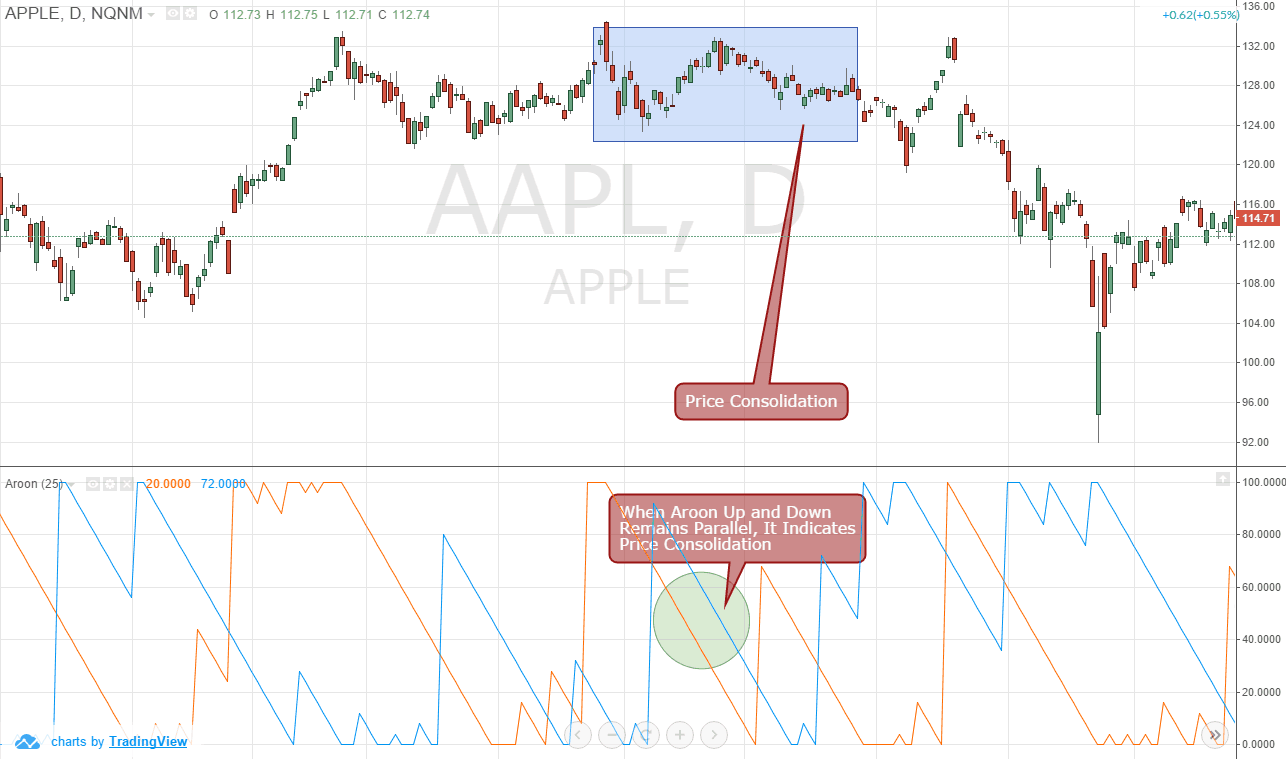
The Aroon indicator was developed by Tushar Chande, who also created the Chande Momentum Oscillator indicator and the Qstick. When it comes to day ...