net volume indicator
I quite frequently perform research on technical indicators and to be honest, net volume never peaked my interest. Therefore, I have decided to explore in this article why I am not enamored with the indicator.
Unlike other indicators discussed on Tradingsim, net volume is easy to calculate. If the stock finishes up for the period, then the net volume is positive. If the stock is down from the previous close, then the net volume is negative.
In this article I will cover the 5 reasons I think net volume is my least favorite of volume indicators.
#1 – Too Simple
I am all for simplifying my life, starting with my trading indicators. However, there needs to be a little more to the net volume indicator. For starters, the indicator does not factor in a look back period like the volume weighted moving average or cumulative figures like the on balance volume (OBV) indicator.
The net volume simply looks at the current volume statistics for one candlestick. Now you could be thinking, well it is the trader’s responsibility to determine the look back period and this is a true statement.
But, what about the crazy idea that your indicator should provide a consistent way of analyzing the market and not totally leaving it up to you to interpret.

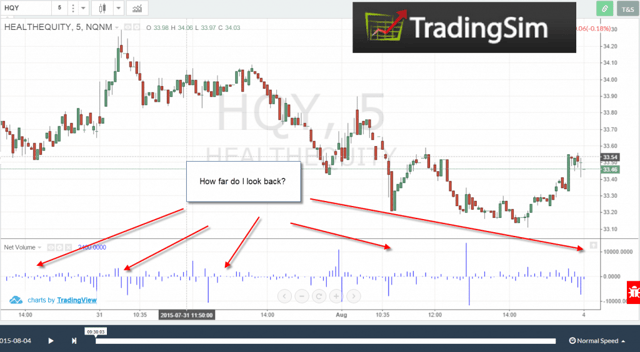
net volume indicator look back period
As you can see in the above chart, what is the net volume telling us? You can see the spikes higher on the lows set, but the stock is clearly in a downtrend, so no surprises there.
Again, how far do you look back? This performance period will ultimately determine how you should interpret the data and without that my friend, the indicator is way too subjective.
#2 – Positive versus Negative Readings
When you read articles and books on the net volume, there is a lot of mention about gauging if there is more positive or negative readings, which could implicate the strength of the trend.
This is a faulty assumption, as you could have a stock float lower or higher with low volume. Therefore, the net volume could continuously print a positive value on the indicator as a stock is rising, but this is no indication of the strength of the trend.
The positive reading could represent the fact the strong hands are letting the small fish drive up the stock, only to enter a significant sell order at a loftier price.
To further illustrate this point, let’s take a look at the charts.

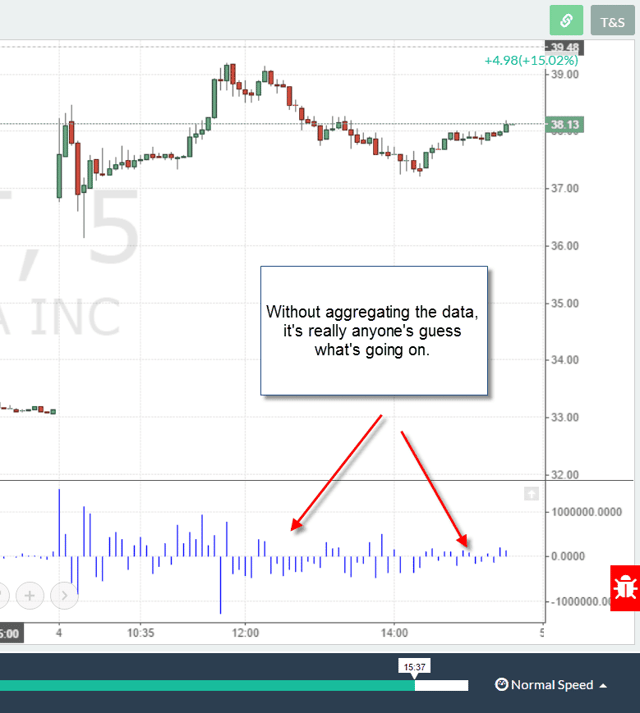
net volume bigger view
Notice how after the push higher into the noon or lunch time reversal zone, the stock then begins to trade lower. Next, notice how the volume on the downside is much lighter, yet the stock continued lower for over 2 hours.
So, the net volume indicator showed a ton of low volume negative readings, but did it mean anything? Did price all of a sudden stop because the volume was no? No, it was a slow bleed down if you bought in right around noon.
#3 – Lacks Predictive Capabilities
The net volume is a snap shot view indicator, candlestick by candlestick. Now you can make general assumptions that the stock will continue higher if the trend is up, but isn’t that something you can assess with the price chart?
Meaning, how does the net volume further help you to identify the true nature of a stock’s trend or pending breakout?
If anything, the net volume can be used as a lagging indicator to validate price action. Therefore, if you see a breakout and the net volume is high on the upside, then this may lead you to believe the trend will continue.
However, the net volume indicator in no way will tell you that a stock is somehow overbought or oversold. If you are looking for this level of forecasting capabilities within the net volume, you will be sadly disappointed.
#4 – Visually Hard to Interpret
When you look out into the world, everything is in 3 dimensions. You are also looking at the world right side up.
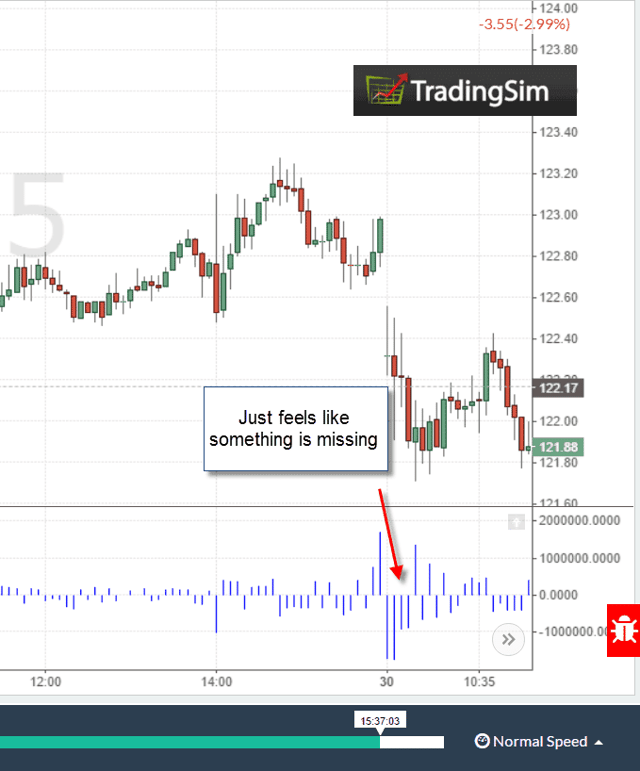
What throws me off about the net volume indicator is the fact the histogram or columns (depending on your settings) will print above and below the 0 line. I find it extremely difficult to then assess the trend as the spikes of the net volume indicator could be on opposite sides of the plane.
To see the indicator print side-by-side, makes it easier to assess the strength of the volume relative to each bar. This becomes increasingly challenging to assess when there are volume spikes.

net volume indicator missing bars
I totally get the fact the bars are there, but it just feels like something is missing when the bars don’t print next to each other. Having this visual break in data, is almost like trying to pick a book back up again after you haven’t read a page in weeks. You know you are picking up where you left off; the story just feels fresh because you didn’t read it every day.
#5 – Plain Volume is Just Better
In life, some things are better just left alone. The volume indicator by itself provides more than enough information to traders. I get all of the information provided by the net volume and I also can see the indicator more clearly on the chart.

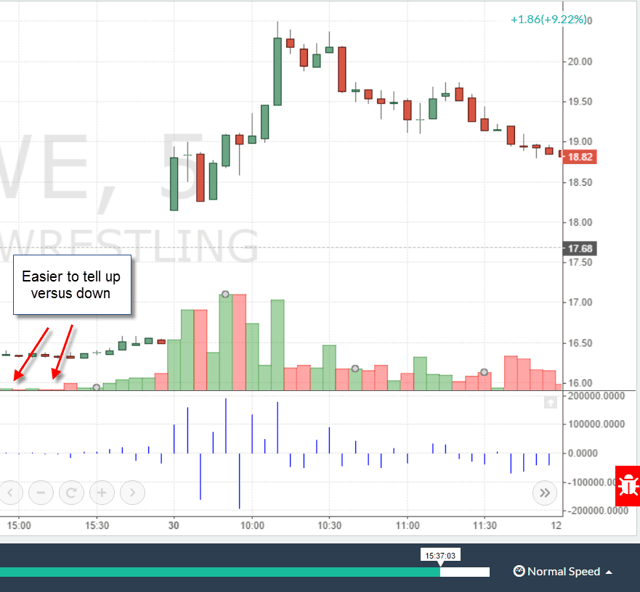
net volume versus volume
When I look at the above example, it’s practically impossible to see the net volume indicator readings. Not that the volume indicator is a cake walk either, but I can at least make out the color of the volume bars and the wider width makes it easier to see as well.
In Summary
I know this article was pretty tough on the net volume indicator, but we as traders need to be more critical of our tools. You need to constantly review and challenge the need for every item on your chart.
If I am still unable to sway you away from the net volume indicator, feel free to visit our homepage to see how you can practice using the indicator on real market data.
Good Luck Trading,
Al


 Awesome Day Trading Strategies
