Dive into the heart of Quantitative Trading and unveil how leveraging algorithms, statistical analysis, and automated trading systems can dramatically refine your trading blueprint. Traverse through diverse quantitative trading strategies to enhance your market proficiency and asset management.
What is Quantitative Trading?
Quantitative trading, also known as “quant trading,” is an ever-growing subset of trading strategies in the world of investing that relies heavily upon mathematical formulas, statistics, data, and algorithms to exploit inefficiencies in the market as a means to profit. Sophisticated hedge fund computer models do most quantitative trading, but its prevalence is expanding into the world of individual investors and day traders and trading platforms evolve and coding becomes more ubiquitous.
As stock market trading and investing become more and more popular, the power of algorithms in modern trading is unavoidable. The chances of interacting with a quant trading algorithm at any given moment in the market are almost a certainty.
In this comprehensive exposé on quantitative trading, we’ll explore the often misunderstood world of quantitative trading.
Key Concepts in Quantitative Trading
According to theStreet.com, quantitative trading has been around since the 20th century. Mathematics has been around for millennia, and for that reason, quantitative analysis is really only at the mercy of computational power.
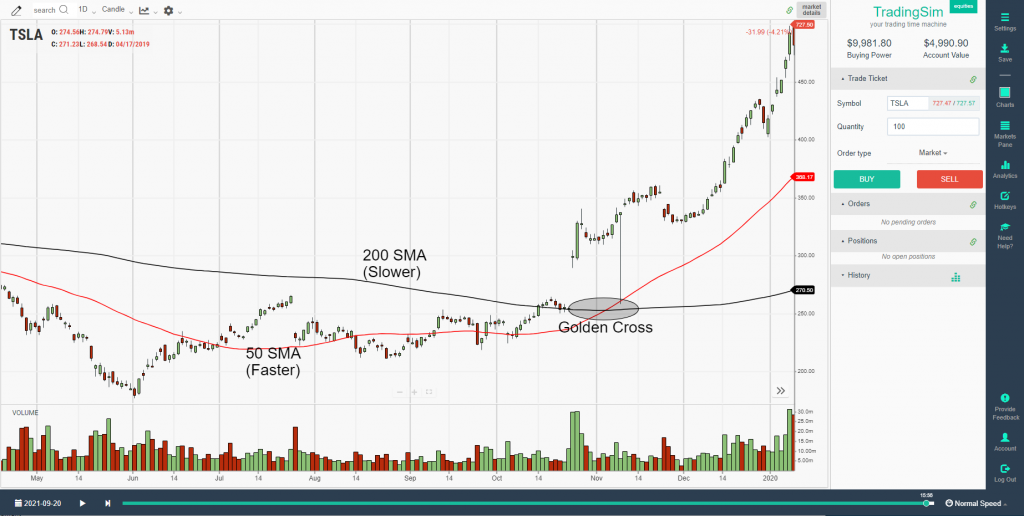
In its simplest form, you can see the roots of quant trading in strategies like trend trading. In the popular book Trend Following, written by Michael Covel, he discloses the strategies that many successful hedge funds have followed over the years using the convergence of price, price averages, and formulaic buying and selling based on quantitative analysis.
Quantitative analysis is the underlying mathematics behind quantitative trading. Using statistics and mathematical models, quantitative analysis provides data and insight for traders to make predictions based on statistically backtested models.
Four Types of Quantitative Trading Strategies
While any number of strategies could rely on quantitative analysis, we’ve narrowed the world of quant trading into four important categories. Each of these carries its own merits and challenges depending upon the resources a trader may have.
For example, some traders may not have coding experience or access to computational software. However, the same trader may find implicit evidence for a systematic approach to the markets through trend trading.
Here are the four types of quantitative trading strategies:
A. Statistical Arbitrage
In layman’s terms, statistical arbitrage is like playing on both sides of the ball, at the same time. It requires simultaneous buying and selling, sometimes of the same asset or multiple assets.
Often referred to as pairs trading or “stat arb” for short, it is a mean reversion strategy that seeks to take advantage of short-term profits and/or hedging.
An example of statistical arbitrage might include two companies seeking to merge. Adept traders might look to buy one company and short the other. Or, if a market analyst forecasts growth in one company and a decline in one of its competitors, traders may short the weaker of the two and go long on the positively forecasted company.
B. High-Frequency Trading
High-frequency trading, or HFT, is just what it sounds like: placing a lot of market orders in a short amount of time. These days, it is most often done successfully through computer algorithms that are capable of exploiting small differences in market prices in rapid succession.
Most HFT is done by market-makers or prop firms with expensive trading platforms capable of playing the middle man in providing and taking liquidity from the market. An example of high-frequency trading is Market Making. In these situations, market-makers buy and sell between the bid and ask all day, pocketing fractions of a penny sometimes. But it all adds up by the end of the day.
Seeking Alpha has this to say about HFT and Market Making:
“Market makers act as counterparties for incoming market orders. They make profits from the difference between the bid-ask spread. High-frequency traders who are market makers also get paid a fraction of a cent for every trade in exchange for providing liquidity to some exchanges and the Electronic Communications Networks. Fractions of a cent added up from millions of trades turn into quite a large chunk of money.”
Benefits and Risks of High-Frequency Trading
One study from Berkeley has shown that HFT might decrease the spread and benefit price selection for traders. Here is what they found:
“For large stocks in particular, AT [Automated Trading] narrows spreads, reduces adverse selection, and reduces trade-related price discovery. The findings indicate that AT improves liquidity and enhances the informativeness of quotes.”
However, HFT has also been blamed for such catastrophes as the flash crash in May of 2010 and for “ghost liquidity” often found in small-cap stocks. Often, you may find an HFT trading house blamed for “propping” a stock up with its own algorithmic trading giving a false sense of liquidity through the back-and-forth arbitrage taking place. Usually, these stocks are considered pump-and-dumps.
C. Systematic Trading
The systematic trading approach to quantitative trading can be as simplified or complex as you want to make it. Systematic trading usually involves some combination of price and volume and any combination of metrics or formulas to determine trends. After all, a system of trading exclusive of arbitrage must at the very least predict a direction in the market.
As such, most systematic traders will use their analysis to determine if the trend is up or down and base their decision to enter a trade for their universe of stocks based upon entry criteria and signals.
Here’s an example of a systematic trading strategy:
- Is the major index’s 50 DMA moving above the 200 dma?
- Which industries have the highest relative strength?
- Which stocks within those industries have the highest RSI?
- Are those top stocks also in an uptrend with the 50 dma above the 200 dma?
- Place a buy trade for the leading stocks in the leading industries.

While somewhat oversimplified, you can see that you have a system in place with this example that ensures the market and leading stocks are trending upward before you place a purchase.
The advantage of a systematic trading strategy is that it eliminates the emotions that often wreck traders in the market. Most traders like to gamble and guess on the markets. Systematic traders follow their system no matter what because they rely on the backtested data that shows it gives positive results over time.
D. Algorithmic Trading
Algorithms are often used in trading to eliminate the influence of human emotions and standardize the process of buying and selling based on computational models.
Some examples of algorithmic trading in the stock market would include trend-following systems, black-box hedge fund computer models, high-frequency trading, arbitrage, or any other system that requires the use of a statistical computer model.
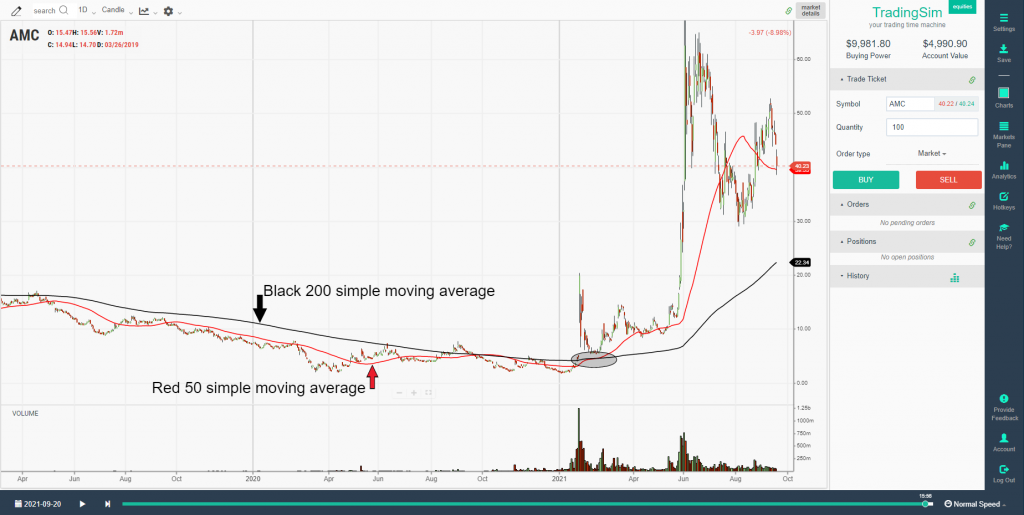
Most algorithmic trading systems are based on the myriad technical analysis tools that are available to traders on most trading and charting platforms. However, many technical traders have created advanced coding systems to generate algorithms in their trading. The algorithm could be as simple as executing a golden cross:
“Buy 100 shares of AMC when the 50-day moving average crosses above the 200-day moving average.”

Understanding Quantitative Asset Management
The role of quantitative strategies in asset management has increased as information technology and computation ability have expanded in recent decades.
Many asset management companies now compile heaps of historical data on markets. This can range from valuations, liquidity, price movement, momentum indicators, technical markers, and many other metrics. Quant analysis will then compile and look to exploit these data for profitable asset management.
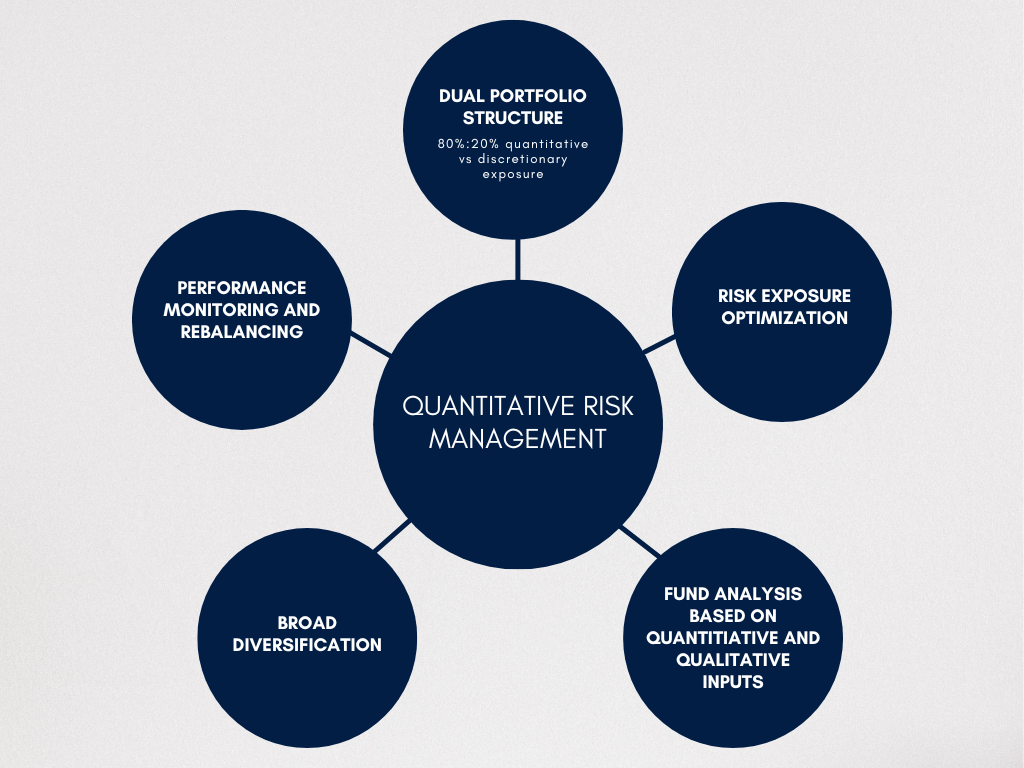
Quantitative asset allocation models may include any number of diversification, analysis, and risk management tools across multiple asset types. For instance, a hedge fund may allocate funds across stocks, bonds, futures, cash, fixed income, etc. Within any or all of these, you may find a quant model that diversifies into various categories, like these:

- Dual-portfolio structure: 80% quantitative analysis / 20% discretionary
- Risk exposure optimization
- Performance monitoring and rebalancing
- Broad diversification
- Fund analysis based on quant analysis (or combined with qualitative analysis)
Risk Management in Quantitative Asset Management
Like other quantitative investing strategies, quantitative risk management relies heavily on backtesting and data-generated models to protect an asset portfolio. This is opposed to the typical portfolio manager’s “market wisdom” approach. Usually, a quantitative risk analyst is well-versed in data aggregation and processing as a means to determine risk strategies.
Other quantitative risk management strategies might involve the use of ETFs. Many hedge funds have popularized ETFs as a “safe” exposure to certain equity groups with only a nominal maintenance fee for participating. This is often referred to as equity factor exposure.
Quantitative Asset Management Software
Software like Axioma and Barra are some of the more prominent risk management suites, offering API-based software to connect with hedge-fund management platforms. Here are just a handful of the types of metrics you can expect from these APIs:
- Discounted cash flow modeling
- Dividend discount modeling
- Operating metrics
- Business/geographic segmentation
- Shareholder ownership summaries
- Relative Valuation
Most of these products come with hefty price tags. With the high cost of entry, it is no wonder many start-up funds try to forego the investment in quantitative risk management, opting instead for discretionary risk management.
Though case studies are lacking, there is evidence that collaboration with a quantitative risk management model can play a powerful role in a quantitative investment strategy.
Quantitative Risk Management Explained
Quantitative risk management is a special subset of risk management that is based on quantitative market analysis, historical data mining, and computer-based risk exposure models.
Value at Risk (VaR) and its Role in Risk Management
One important statistic often used in quantitative risk management models is the VaR, or Value at Risk. The VaR helps portfolio managers forecast the possible losses a fund, portfolio, or asset management company could stand to lose in any given market. It offers probabilities on the extent of these losses based on risk exposure models. These can be applied to any single position or an entire portfolio.
Commonly, there are three ways to compute the VaR for risk management purposes:
- Historical method
- Variance-covariance
- Monte Carlo methods
Historical Method of VaR Formula
According to Investopedia the historical method for calculating VaR can be quite tedious depending on the size of the portfolio or hedge fund. Here is the formula:
Value at Risk = vm (vi / v(i - 1))
In this formula, m represents the number of days that historical data was gathered. For example, if there are 252 trading days in a year, then you can use this as a time value for m. vi is the number of variables for day i. When calculated correctly, you’d arrive at over 252 possibilities for the future value of the asset.
Variance-Covariance Method
Also known as the parametric method, the variance-covariance method is a departure from the typical wisdom that the past can inform the future. Instead, it places more emphasis on the standard deviation from the mean when calculating potential losses – assuming that there is a normal distribution between profit and loss events.
One drawback to this method is that it doesn’t work well with small sample sizes.
A simplified example of the variance-covariance method for a single-stock portfolio might look like this:
If $100,000 is invested in AAPL and the standard deviation over the yearly trading days (252) is 7% and assuming normal distribution with 95% confidence, then AAPL would have a z-score of around 1.645.
($100,000*1.645*.07) = $11,515
With normal distribution and 95% confidence, the variance-covariance method calculates that a max loss would never exceed $11.515 in a calendar trading year.
Monte Carlo Simulation in Risk Assessment
The third method for calculating VaR in quantitative risk management predicts returns over many thousands of possibilities using computer-generated statistical models. For this model to work, it assumes that probability distribution for risk factors can actually be calculated accurately.
Instead of monitoring real returns, the Monte Carlo Simulation will look at a worst case scenario of a certain percentage of its computational possibilities, say 1%-5%, and use this as a risk management projection.
Automated Trading Systems
Automated trading systems are software based trading systems that allow traders to set specific trade entry and exit criteria that are executed by a computer. In its simplest form, an automated trading system is similar to the standard order execution systems in popular trading platforms available today.
For example, you might set an OCO, or one cancels the other, trade execution for stock ABC. Once that stock drops to a certain price, a stop sell order is executed and the other take profit order you may have had at a higher price will be canceled as you are no longer in the trade.
Benefits of Automated Trading Systems
The biggest advantage of automated trading systems is the elimination of human emotion. Automating your trading allows you to essentially “set it and leave it.” Instead of constantly monitoring your positions, and becoming susceptible to fear and greed or market fluctuations, you can create a standard for your trading based on the rules you generate in your system.
Building and Implementing Automated Trading Strategies
Many modern trading platforms are making it easier and easier for amateur traders to establish trading entry and exit criteria. The software engineers at these companies do the heavy lifting for you.
However, there are also many trading platforms that allow investors to code their own rules. Some charting platforms like TradingView offer Python coding and APIs for brokerages. Other platforms allow similar coding capabilities. As with any new strategy, automated or not, it is always a best practice to backtest your strategies on historical data, or through paper trading to ensure the system works.
Risks and Challenges in Automated Trading
As with any investing strategy, there is no holy grail that will return you 100% accuracy. Automated trading is no different. After all, unless you’re employing machine learning, human error still exists in your system. Always use a risk management plan for any trading activity you partake in.
Quant Trading Platforms
There are a myriad of trading platforms to access the market in 2023. As trading has become more popular since the pandemic in 2020, more lay traders are looking to utilize their coding skills to trade. On that token, many modern trading platforms include access to their own proprietary programming languages.
Key Features to Look for in a Quant Trading Platform
The best quant trading platforms will include market access, low-latency trades, and the ability to customize and code your own algorithms with an easy-to-use, or easy-to-learn, UI.
For example, TradeStation offers its EasyLanguage feature for algo trading, Interactive Brokers offers an API for those inclined to “build your own” platform, and other popular platforms like ThinkorSwim has their own coding portals. However, you’ll need a solid knowledge of Python, C++, or other programming languages depending on the platform and your desired customization.
Choosing the Right Platform for Your Trading Strategy
When choosing a quant trading platform, you need to consider your competency with coding and building computer systems. You may also want to consider what assets you’ll be trading.
That being said, there are a number of systems readily available that don’t require coding experience. For example, TradeIdeas allows access to hundreds of pre-programmed algorithmic trading strategies that don’t require you to code. However, access to the platform comes at a cost, upwards of $2000/annually.
Ultimately, you’ll want to explore your options based on finances, user experience, and skill level.
The Future of Quantitative Trading
The role of artificial intelligence and machine learning are quickly changing the landscape in quantitative trading. As the likes of ChatGPT and other AI-based information machines expand, the ability to influence markets is becoming more and more possible by machines.
There are also ethical and regulatory concerns around quantitative trading. As more machines interact with markets, regulators have their hands full with determining what is natural market participation and what is manipulation. As always, it's best to have a good risk management plan when trading.
Regardless of what the future holds for algorithmic trading, it’s clear that it will remain a powerful force in the markets. Aspiring quantitative traders should educate themselves on not just the power of algorithms, but also on the time-tested strategies that have been proven in the markets. Combined, you may realize an unstoppable hybrid strategy for profits.


 Day Trading Basics
