Technical analysis is a powerful tool for traders, but mastering it requires practice. From pattern recognition to understanding indicators, there are many skills you will need as a technical trader. Many of these skills require consistent application to understand when they work and when they fail in the markets. This is where TradingSim steps in, offering a safe and controlled environment to hone your technical analysis skills.
In this guide to using simulators for technical analysis training, we'll walk you through the reasons why you should use a virtual trading account. We'll also show you some of the most popular technical analysis tools that should be included in a trading simulator. Hopefully, by the end, you'll have a better understanding of the importance a simulator plays in this crucial part of your trading education.

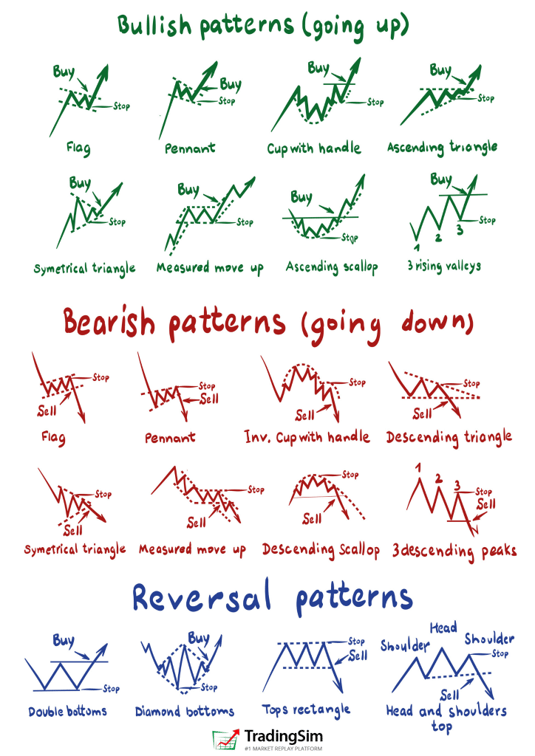
As we have said in our educational resources on chart patterns, learning the most common patterns is the fastest way to make consistent money in the stock market. Why? Because, for centuries the market displays the same patterns over and over again, depending on the cycle of the market.
Markets are nothing more than human emotions on display, as well as a record of the supply and demand of large institutions. As these things play out in the market, the cycle of buying and selling creates repeatable patterns that show up on the chart through the ticks and candles, lines, and bars. It's up to you to practice recognizing these patterns to exploit them to your advantage.
Let's take a look at the basics of chart patterns and how you can benefit from knowing these through simulation.
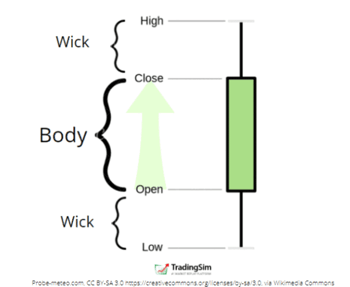
Candlesticks are nothing more than a plot of price over time, using any timeframe. A one-minute candle displays the open, low, high, and close of the price during that minute. You can apply the same to a 5-minute candle, 1-hour candle, 1-day candle, and so on.
As you work in the simulator, you'll want to begin studying candle stick patterns. As each candle plays out, it becomes a collective of candles that tell a story. That story is usually bullish or bearish. Couple the candles with volume, and you add a layer of understanding about how strong the case is for the bullish or bearish side.
We've written extensively on candlestick chart patterns, but for the sake of time, let's condense this knowledge into something useful for you today, starting with the cheat sheet.
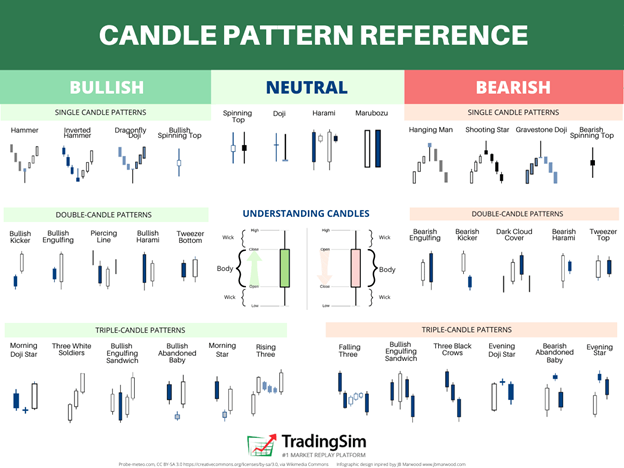
Candlestick patterns can often seem overwhelming. It's not necessary to remember them all, but it helps to have a reminder handy while trading. For that reason, we created the candlestick pattern cheat sheet.
Over time, you will want to recognize a lot of these patterns implicitly, instead of having to refer back to the reference guide. As you practice in simulation, the more you'll store these patterns away in your implicit memory, saving you time.
Here is our approach to learning each of these:
- Pick a side (bullish or bearish)
- Focus on only a handful of patterns for 1-2 months of practice
- Identify all the examples you can find of those patterns
- Document what makes the pattern work or fail
- Create a list of criteria you can use to stay disciplined as you trade the setups
As your knowledge grows, you'll begin to see exploitable opportunities as these setups repeat themselves. Your observation is what teaches you the game. And know the game you must, or you become the pawn. Keep that in mind as you discover new strategies.
Triangle Patterns
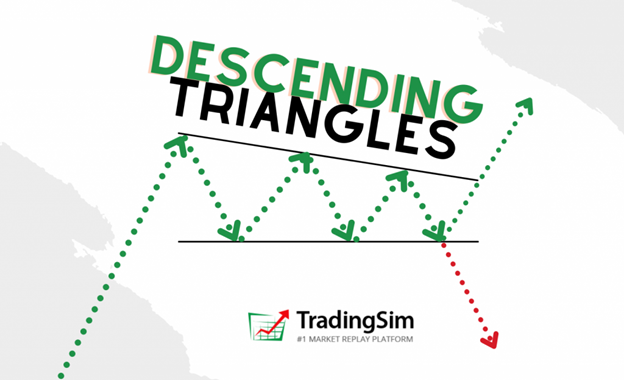
As you move from candlesticks to more structured patterns, some of the more common ones you'll see are triangle patterns. These are a collective of candles that form a general triangle. It can be an ascending triangle, descending triangle, or even a horizontal triangle. Additionally, there are different types of triangles. Let's look at an example:
Descending triangles are often denoted as wedges. Importantly, these can resolve in either direction, so it is up to you to find the path of least resistance and take the trade in the prevailing direction of momentum. Plus, as we've discussed in other posts, be sure to manage your risk with stop-loss measures.
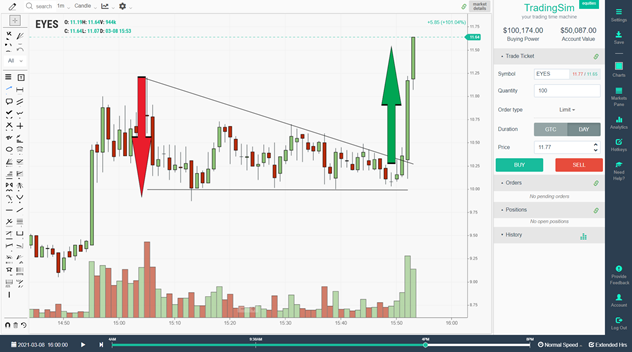
One of the most popular ways to trade a descending triangle is to wait for the breakout, then jump on the momentum. For this strategy, you wait for the volatility of the stock to contract into the apex of the triangle, draw a series of trendlines that mark the bounds of the triangle, and then take the trade in the direction of the breakout.

How do you set the lines? Easy. Find the broadest part of the triangle, then set your lines across the bottom and the top, touching the most points along each path, just as you see in the screenshot above. As the price contracts, you'll want to expect the stock to break out of the formation on increased volume. You'll need to be quick on the draw and buy or sell as the stock moves decisively away from this area.
The Double Bottom Pattern
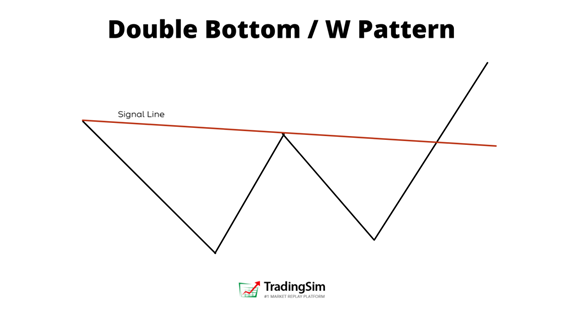
Another very popular breakout pattern is the double bottom. On a chart, it is shaped like a W. This pattern typically occurs as a pause in an uptrend before the trend resumes, or as a bottoming pattern in a downtrend. The bottom is confirmation that the stock is retesting a prior support area, finding it once again, and then beginning the markup phase as it moves higher.
While there are never 100% certainties in the market, this is generally considered a bullish pattern. As the second dip forms, you should have this on your potential trade radar. Often volume will dry up on the second trough of the double bottom, indicating a lack of selling pressure -- and an ease-of-movement back to the prior highs.
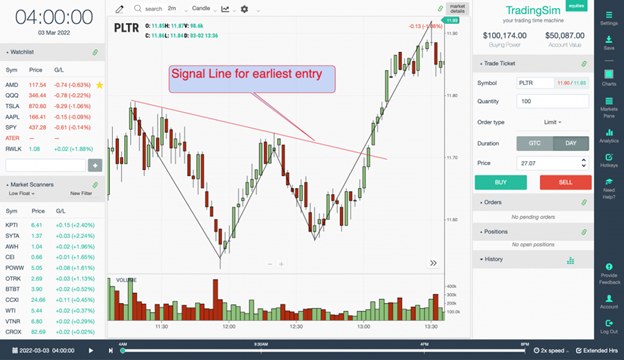
Many traders employ trendline across the top of the W to find a solid entry point with risk. Take the example above. Using the depth of the double bottoming pattern, you could apply this as the height that the breakout will reach, allowing you to set a price target.
Bear Trap Patterns
Failed breakouts can often lead to traps. As we showed above with the descending triangle pattern, the prevailing momentum usually carries the stock in that direction for some time. However, when the stock fails to continue in that direction, you will often see the market participants betting in that direction get trapped. The ensuing reversal can be violent.
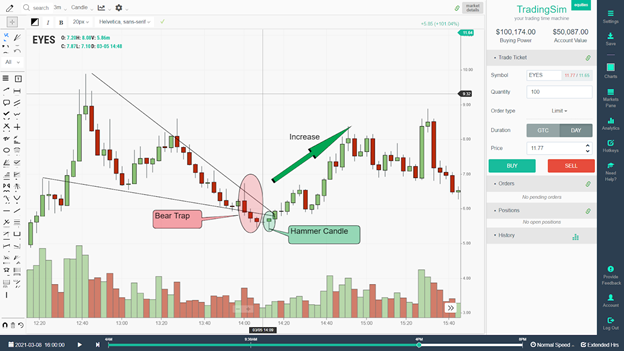
In the above example, you see a classic descending triangle, albeit one that is slightly more volatile than usual. Notice how the stock tries to break down. Price moves below the descending triangle, capturing the attention of the bears. However, it swiftly reverses, trapping the bears, and forcing them to cover their shorts. This covering provides buying pressure, sending the stock higher.
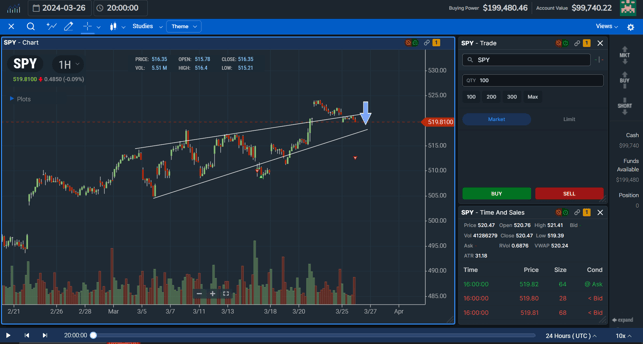
The same strategy can be had on the upside. In a recent SPY consolidation, the ETF broke out, only to fall back into the ascending triangle for a short play.
Deepen Your Understanding of Technical Indicators
TradingSim boasts a wide range of technical indicators, from moving averages and MACD to RSI and Bollinger Bands. You can experiment with different indicators, backtest their effectiveness on historical data, and learn how they interact with chart patterns.
As an aspiring trader, you'll want to fine-tune indicator parameters to suit your trading style. This allows you to optimize indicators for specific market conditions and gain a deeper understanding of how they generate signals.
Let's take a look at some of the best trading indicators in the simulator, and how they can benefit your trading.
Volume Weighted Average Price
The volume-weighted average price (VWAP) is a technical analysis indicator used by traders to understand the average price at which a security has traded throughout a specific period, typically a trading day. Unlike the simple average price, which just adds up closing prices and divides by the number of periods, VWAP considers both price and volume.
Here's how VWAP works:
- Calculation: It's essentially the total value of all trades (price multiplied by volume) divided by the total volume traded for the period.
- Advantage: VWAP emphasizes trades with higher volume, giving a more accurate picture of the price level where most buying and selling activity occurred.
Why is VWAP important?
- Price-Volume Relationship: VWAP reflects the buying pressure behind a price move. If the VWAP is higher than the closing price, it suggests buying pressure was strong throughout the day, pushing the price up. Conversely, a VWAP lower than the closing price indicates selling pressure dominated the day.
- Benchmark for Performance: Traders can compare the VWAP to their average trading price to see if they bought or sold above or below the market average.
- Support and Resistance Levels: VWAP can act as a dynamic support or resistance level. If the price approaches the VWAP, it may find temporary support or resistance at that level.
- Intraday Focus: VWAP is typically used for intraday analysis and resets at the start of each trading session.
- Not Predictive: VWAP doesn't predict future price movements but rather reflects past buying and selling activity.
VWAP is a valuable tool for understanding the price-volume relationship and gauging market sentiment. By incorporating VWAP into your analysis, you can gain insights into buying and selling pressure, identify potential support and resistance levels, and ultimately make more informed trading decisions.

Bollinger Bands
Bollinger Bands are another type of technical analysis tool used by traders to assess volatility and identify potential overbought or oversold conditions in a stock's price. They were invented by John Bollinger in the 1980s and consist of three lines plotted on a price chart:
- Middle Band: This is a simple moving average (SMA) of the security's price over a chosen period (e.g., 20 days). It represents the average price action over that timeframe.
- Upper Band: This line is plotted a certain number of standard deviations (usually two) above the middle band. It acts as a dynamic measure of volatility. As the price fluctuates more, the upper band widens, and conversely, when price movements are calmer, the upper band contracts.
- Lower Band: This line is plotted a certain number of standard deviations (usually two) below the middle band. It also acts as a measure of volatility, mirroring the movements of the upper band.
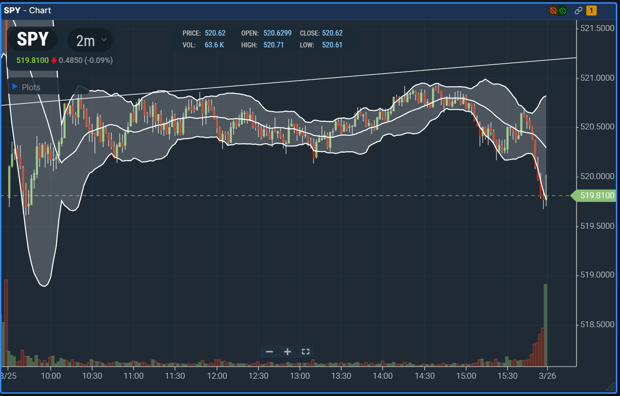
The width of the Bollinger Bands is a reflection of the volatility in the stock or ETF you're trading. Wider bands indicate higher volatility and narrower bands suggest lower volatility. When the price moves close to the upper Bollinger Band, it might be a sign that the security is overbought, potentially indicating a price correction is on the horizon. Conversely, price movements near the lower Bollinger Band could suggest oversold conditions, hinting at a possible price rebound.
Moving Averages
In the world of stock trading, moving averages (MAs) are one of the most popular technical analysis tools used to smooth out price fluctuations and identify trends. They essentially calculate the average closing price of a security over a chosen time period.
The most common type of moving average is the simple moving average (SMA), though the Exponential Moving Average is also quite popular. The SMA is calculated by adding the closing prices of a security for a specific number of days and then dividing that sum by the number of days.
For example, if you're looking at a 20-day SMA, you'd add the closing prices of the last 20 days and divide by 20. This would give you the average closing price over that period. However, most simulators and modern charting platforms do all this math for you. All you have to do is designate the moving average you want to overlay on your chart.
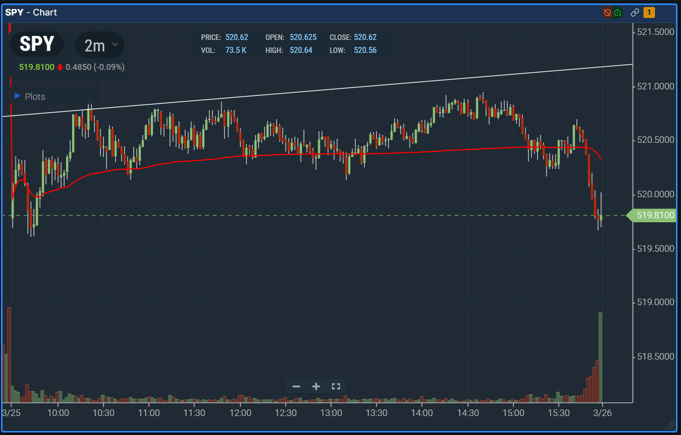
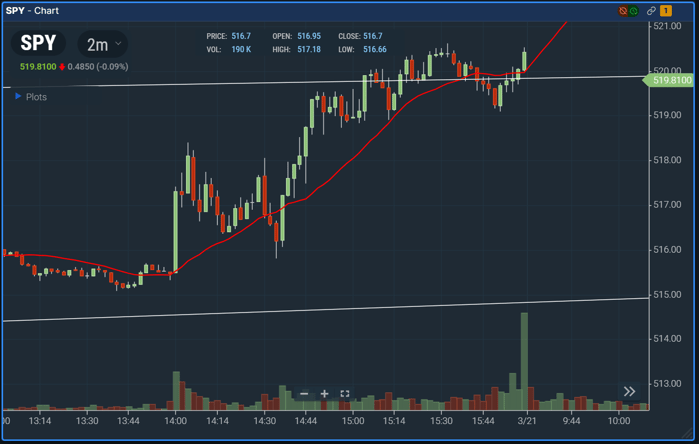
Here's an example of the 20 SMA on a SPY chart in TradingSim:
How to Use Moving Averages
- Trend Trading: Moving averages help smooth out short-term price movements, making it easier to identify the underlying trend (upward, downward, or sideways). A rising moving average typically identifies an uptrend, while a falling moving average indicates a downtrend. Most sideways trends are too choppy to use MAs.
- Support and Resistance: Moving averages can act as dynamic support and resistance levels. The price may find temporary support at the moving average as buyers step in, perceiving it as a value zone. Conversely, the price may encounter resistance at the moving average as sellers emerge, believing the price may be overextended.
Limitations of Moving Averages
Moving averages are lagging indicators, meaning they react to past price movements rather than predicting the future. Often, they can generate false signals, especially during periods of high volatility or choppy price action.
While we love moving averages here at TradingSim, it is important to observe when they work best, and when they don't. Generally speaking, we ignore them during the chop-fest of sideways markets, and employ them during new up or down trends. As always, it's healthy to combine other analysis with your moving averages for better confirmation signals.
Apply Technical Analysis, Risk-Free
Technical analysis is a trading discipline that focuses on analyzing historical price and volume data to identify trading opportunities. Unlike fundamental analysis, which delves into a company's financial health and economic factors, technical analysis assumes all relevant information is already reflected in the price movements of a security.
At TradingSim, we believe Technical Analysis (TA) is at the heart of solid trading education. Even if you decide to become a fundamental trader, there is no denying the impact that TA has on successful investing.
Here are a few reasons why technical analysis proves beneficial to traders, over and over again:
1. The Market Discounts Everything:
All available information, including fundamental factors, economic data, and investor sentiment, is already baked into the current price of a security. By studying past price and volume patterns, technical traders can identify trends and potential future price movements.
2. Price Moves in Trends:
Technical analysis identifies trends as the dominant direction of price movement (uptrend, downtrend, or sideways). Studying these trends will prepare you to capitalize on price movements aligned with the trend.
3. History Tends to Repeat Itself:
Technical traders believe that past price and volume patterns can offer clues about future behavior. By identifying recurring chart patterns and technical indicators, they aim to predict potential turning points or continuations in the trend.
It's important to remember that technical analysis is not a crystal ball. The identified patterns and indicators are probabilities, not guarantees. However, when used appropriately, it is often the most important tool a trader can use. Combined with risk management and some fundamental analysis, technical analysis makes for a well-rounded trading strategy.
How TradingSim Can Help
TradingSim utilizes real-time and historical data, allowing you to study price movements and identify chart patterns like head and shoulders, double tops, and trendlines. By seeing these patterns unfold in a simulated environment, you can refine your pattern recognition skills and learn to anticipate potential price movements.
Analyze charts across different time frames (daily, hourly, etc.). This helps you understand how short-term price movements fit within the bigger picture. This is crucial for confirming patterns and pinpointing entry and exit points.
Unlike live trading, experimenting with technical analysis in TradingSim doesn't involve real capital. This allows you to make mistakes, test different strategies, and refine your approach without financial consequences. Practice applying technical analysis as much as you need. This repetition builds confidence and helps you internalize technical principles, leading to more informed trading decisions in the real world.
Conclusion
By offering a platform to hone your technical analysis skills in a controlled environment, TradingSim equips you with the knowledge and confidence to navigate the real market with greater clarity. You'll be able to identify trading opportunities, manage risk effectively, and ultimately, make more informed decisions that contribute to your long-term trading success. Try our risk-free trial today.


 Day Trading


