Illiquid stocks, as the name suggests, pertain to a certain set of stocks that have some common characteristic features. Illiquid stocks are those where the investor cannot easily liquidate the investments held. In other words, with illiquid stocks, buyers or sellers are not readily available.
It is important to know about illiquid stocks because they are traded on an exchange. Owning a position in an illiquid stock means that shedding your exposure will come at a price far less favorable.
There is also a greater risk involved due to lack of transparency and regulatory oversight. While some illiquid stocks can be traded on an exchange such as NASDAQ, you can also find such stocks trading over the counter.
Pros and cons of trading illiquid stocks
Trading illiquid stocks has its own pros and cons. The main disadvantage being that existing from a position is difficult. Due to the low volumes, the spreads are higher. Therefore, it can be not just difficult but also expensive.
On the flipside, illiquid stocks can also post strong gains. Due to the nature of the low volumes, stocks tend to often rally significantly, giving high returns to the investors.
For example, if you owned 50,000 shares in an illiquid stock that was trading at $1, just a $1
But conversely, such strong moves also come to the downside. This could put the investor’s capital at strong risk as well.
Most of the illiquid stocks, including penny stocks have an average share price around $1 – $2.5.
One of the commonly assumed myths is that all illiquid stocks trade on the OTCBB (Over the counter bulletin board). While this may be true for penny stocks, even on the major stock exchanges, you can find illiquid stocks.
The first picture below shows a few stocks from the NASDAQ exchange.
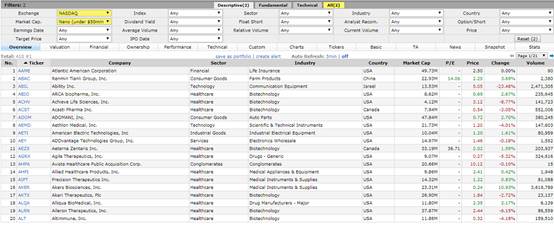
Example of NASDAQ traded stocks with low volumes (Source: Finviz.com)
These stocks have a market cap category as nano. In other words, the market cap for the sample companies is under $50 million. You can of course find illiquid stocks that have even lower market cap.
To put this in perspective, the average daily trading volume for a stock such as AAPL is 24 million. This is almost half of the total market cap of nano companies trading on the NASDAQ.
Factors common to illiquid stocks
Most of the illiquid stocks, including penny stocks have an average share price around $1 – $2.5. The common underlying factors with illiquid stocks and penny stocks are:
- Very low trading volumes
- Price tends to move in a range and then breakout strongly
- Risks and rewards are very high
- In case of penny stocks, company disclosures are limited
- High bid and ask spreads
Illiquid stocks and penny stocks also tend to often fall under the regulator scrutiny. Sudden delisting is another scenario common to illiquid stocks and so is price manipulation.
Despite the apparent downsides and the risk, investors continue trading illiquid stocks. This is because investors can at times find a small cap company that has good prospects.
Typically, when an investor does their due diligence they can make significant profits. This means that investors can get ahead of the curve. As and when volume starts to rise, one can expect big returns.
But apply caution as illiquid and penny stocks are also susceptible to the Pump and Dump practice.
Pump and dump scheme is a loosely used term in investing. A pump and dump is a fraudulent market practice. It is defined as encouraging investors to buy shares in a company. This move leads to an artificial inflation of prices. Once the price reaches a desirable level, investors then dump their shares and exit.
1. You cannot trade in size
One of the biggest disadvantages with trading illiquid stocks is the trading volumes. The lack of liquidity and average volumes on a day to day basis can easily influence the price. This is due to the fact that a single large order from an institution could trigger erratic price behavior.
The limitations on the trading size can either put off traders with large volumes or it can also attract the kind. This can be useful especially when you have investors who wish to corner the market.
Posting a large order with the goal to influence the price is akin to manipulating the markets. In such cases, the average retail day trader can easily fall prey to the market movements. The retail investor or the day trader will only end up in a trade that is certain to reverse direction.
The chart below shows one such example. On the Westmoreland resource partners LP chart (NYSE: WMLP), you can see huge price surges. Price surged over 194% on a single day. Notice that the volumes are also unusually large. The 194% price surge came on a volume of 12.342 million.
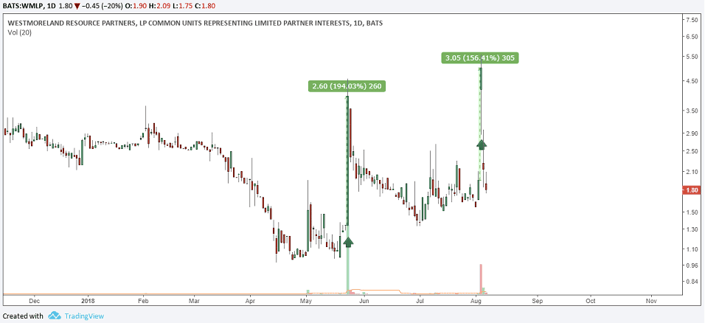
Example of an illiquid stock influenced by volume
By the time the day trader or a retail investor notices this move price starts to retrace again. Taking up a position in such a scenario would have left the average trader holding on to the losses. As price quickly gives up the gains over the next few days, there is a near 100% retracement.
Likewise, at a later stage, there was another 156% surge in price. The common factor to this and the previous large spike is the trading volume once again.
Another drawback of trading illiquid stock is that the technical analysis which is common to most intraday traders does not work. This aspect comes down to the fact of low volumes. There are times when you can expect the moving average indicator to work. But a few large orders can quickly pull price in either direction.
Technically, the indicators still work as they continue to react to price. But the main factor is that trading illiquid stocks based off the technicals can be very risky. The main reason for this is the fact that a few large orders can push price in either direction.
Therefore the erratic market movements can potentially render most technical indicators or price action based trading techniques practically useless.
The next chart below shows the stock price for Addvantage Technologies Group Inc. from NASDAQ with ticker AEY. Using the Stochastics oscillator, you can see that the indicator does not offer any value. Price action remains in a consolidation and the large spikes in price are something that cannot be ignored.
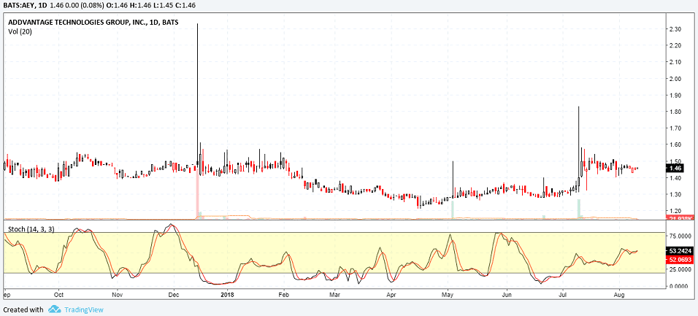
Illiquid stocks – Technical analysis
Trading with technical indicators on such a price chart can be challenging to say the least.
Even moving to the intraday chart time frame for the above stock as an example can reveal no meaningful information. While it is true that price action is generally very volatile, this can be one of the reasons day traders could feel tempted to trade illiquid stocks.
But the lack of being able to apply any meaningful analysis to the price charts of the illiquid stocks can lead to devastating results.
3. Difficulty in price fills
Price fill is basically the price at which your buy or sell order is filled. In most cases, depending on the volatility and the stock in question, price fills can differ. Needless to say, in some cases even some liquid stocks will come with a difference in price fill.
When you apply this to illiquid stocks, you can be certain that price fills can be very wide. Due to the lack of liquidity, the broker will quote you the best available price. At times, if you get lucky, you might be able to get into or exit a stock as a good price. But this is very rare.
With intraday trading or even long term buy and hold investment strategy, price fills can significantly eat into the profits. At times, your trade will continue staying in a loss until price moves up and above the price at which you were filled.
This poses the risks of both entering and exiting a position. With illiquid stocks, even if your trade has been in profit, the price at which your sell order is filled can quickly erode your profits. The main reason for this is because your broker or the counterparty is also at equal risk.
With a market maker, the chances are even high as they try to get the best out of the buy and sell orders. One might argue that they could break up their positions into smaller units. Still, if there is a pattern or a consistent method being used, it would be easily recognizable.
The more position you have exposed to the illiquid stock, the higher the chances that it will be difficult to exit. Furthermore, if the stock in question starts to turn volatile your capital, let alone profits can quickly lead to losses.
4. Spreads and poor execution
A spread is the difference between ask and bid price. The buy and sell price. Anyone who has traded stocks or any other markets would know ask and bid price. This is the difference between the price at which you buy and sell.
While most liquid stocks enjoy tighter spreads, the story is different when it comes to illiquid stocks. It once again comes down to the volume. Spreads go hand in hand with price fill. Usually, tighter the spreads are the better chances you have of getting a good price fill.
Conversely, the wider the spreads are, your chances of getting good price fill gets worse.
If you wanted to enter a trade at say around $1.00, due to the wide spreads, your trade might actually get filled at $1.50. Now if you were targeting $2.00, you can see that your trade was filled at a bad price.
When it comes to illiquid stocks, one often thinks of stocks trading under $5 on average. However, that is not the case. Take the example of Kallo Inc. (KALO) trading on the OTC markets.
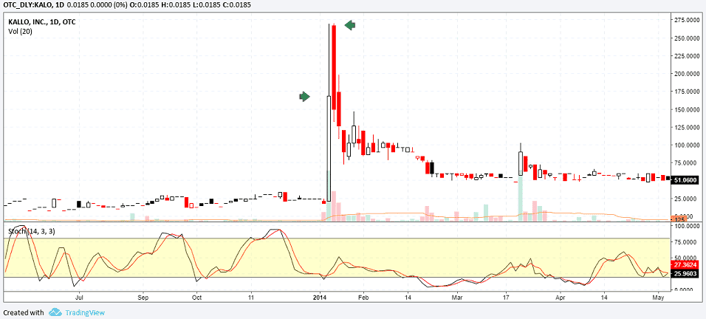
Price spikes and spreads – Illiquid stocks, Kalo Inc. example
You can see that at one point, the stock was over $100. However, the trading volumes have remained so low. You can see how a spike in volume pushed the price for Kallo as high as $250 before the stock fell back strongly.
Entering a long position on the spike, assuming the stock would continue to push higher would have been a big mistake. Even those who were short the stock near the close of the bullish spike would have been at a loss.
The next day, price action opened near $250 before closing bearish. In the above example, regardless of whether you buy or sell you would face mounting losses.
Illiquid stocks – A good reason to stay away
Illiquid stocks might be tempting in many ways. Most often, the reason why some traders feel the need to trade penny stocks is greed. The prospects of making quick money on stocks with low volumes and falling below the regulatory radar can be a recipe for disaster.
While it is true that higher risk can bring you higher profits, with illiquid stocks that is not always the case. For the most part, the average retail investor is always at a disadvantage. A few big orders from a medium sized hedge fund could quickly result in price being manipulated.
There are instances of traders making big money betting on illiquid stocks. But such stories are rare and they make the news only because someone managed to get it right. However, in most cases, the risks far outweigh the rewards when it comes to trading illiquid stocks.


 Basics of Stock Trading


