Let me first start off by saying that at my peak I had 4 monitors when I was day trading. I did not have one of those custom setups where a company builds you some supercharged desktop machine with a chassis of monitors stacked on top of each other.
I had three monitors directly in front of me on a desk with a fourth monitor ever so slightly elevated off the floor on top of the desktop. The three monitors were each 20 inches with the fourth monitor right around 14. I think the number of monitors gave me a greater feeling of control or maybe I was doing something significant because my setup resembled the cockpit of an F-14 fighter plane. I am going to help you save some money by showing you that all you need is one monitor to successfully day trade for a living.
You Only need One Monitor
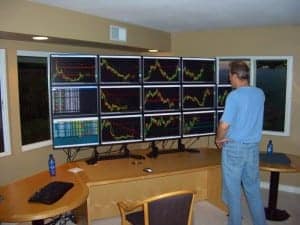
We have all probably seen the images of traders with 20+ screens staring them in the face.

I’m not exactly sure what this does for the trader. You would almost need a staff of people to track all of the happenings on each screen. It’s one step down from Christian Bale in Batman where he was tracking every mobile phone in Gotham city with Morgan Freeman at the helm.
With the advent of technology, trading platforms have moved towards a widget based model. The concept of widgets allows you to show and control multiple components of a trading application on one screen. This development has completely eliminated the need for more than one monitor. Over time I began to realize that by focusing on one screen it allowed me t0 reduce market noise.
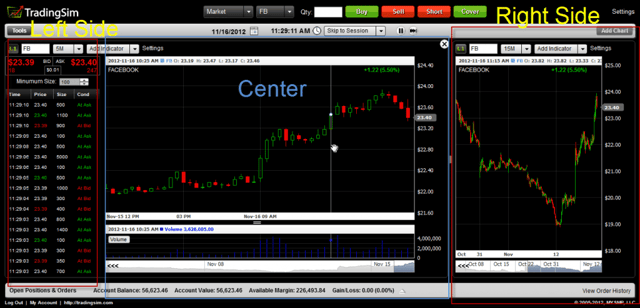
To make the move to one screen you have to do more with less. For me, it was a matter of breaking the monitor up into three sections. The left side of the monitor provides your roadmap. The center is for your primary trading time frame and the right is for the next time frame up. To see an example of this please look at the image below.

Left Side of the Main Screen Monitor
The left side of the monitor I have my roadmap for trading. A roadmap consists of the tools which allow me to look at the broad market at a glance and then drill down into specific buy and sell signals in a matter of seconds.
Market Movers
Gainers and Losers
This is where I track the largest percentage gainers and losers for the day. These are the stocks that have increased volatility likely due to some sort of news event. I keep the market movers in the upper left-hand corner of the screen so I always have my eyes on the prize. In terms of tracking, you will want to keep the top twenty decliners and top twenty gainers in your list. Depending on your system (mine has very strict rules for opening a position) tracking forty stocks will often present you with three to six trading opportunities of the day. Forty symbols sound like a large number, but this assumes you start reviewing your charts before the market opens. If you sit down at your desk at 9:30 am and expect to be successful, you are kidding yourself. Trading requires proper planning like any other business. So, you should start cycling through the plays no later than 8:30 am.
When using the market movers you will want to sort the stocks by percentage gain in descending order. In terms of biggest decliners, you will want to do the reverse and show these in ascending order for percentage gainers. Your trading software should be able to alter the ranking of these symbols based on their latest quote. Your trading software should also allow you to click the symbol from the market movers section which in turn updates the chart in the middle of your screen. The linking of market movers to your main chart area by simply clicking the symbol will save you loads of time when analyzing the market.
High Volume Stocks
Volume is a big part of analyzing the trades available in the stock market. Think about it, what’s the point of showing the top gainers and losers in the market if they only trade 2,000 shares per day? For me I like to see on average 40,000 to 50,000 shares trade hands every 5 minutes, so you will want to make sure your market movers have either already pre-screened high volume stocks or it provides you the ability to filter your results.
Watchlist
As you scan the pre-market you will want to identify potential trade setups for the morning. This includes stocks from your market movers as well as stocks you may follow on a daily basis. In the watch list you will want to keep a maximum of 10 stocks. The end game here is that the market movers is your starting point for quickly assessing the market, but the watch list is where you are reducing the amount of noise and placing your focus on your top picks.
Much like market movers above, your watchlist will need to be linked to the main chart area. This way you can quickly click the symbol and have it populate the chart on your screen.
Level 2
Once you have identified the top stocks that fit your system, you will now want to start peeling back the details of the setup. A great chart or setup may not reveal the other underlining supply and demand of a security. This is where your level 2 analysis will need to come into play. The level 2 will show you the open bid and ask orders. This is not a science like looking at an overbought or oversold indicator; it’s more about the art of seeing how the security is trading.
Time and Sales
I am a traditional day trader, so I do not go far without my time and sales window. My time and sales allow me to see the size and speed of orders as they cross the tape. This is critical as you are watching stocks cross key levels of support or resistance. Like level 2 this is more art than science. As the speed of the time and sales and the size of the orders picks up, you will know that your stock is likely to continue in your desired direction.
Center of the Monitor
The center of the monitor should contain your primary time frame you trade. For me, it is the 5-minute chart. Here you will want the window to update with stocks as you cycle through the market movers and your watch list. This main section should take up two-thirds of the monitor. Again we are giving more real estate to the middle section because this is where you should be focusing your attention.
Another key component of the center section of your monitor is your account value. Some traders believe in not associating money with trading; however, I believe it’s all about the money. So, make sure you keep some widget or information around your account value and profit per trade front and center. You have to learn to disassociate your emotional attachment with your money and realize you need to actively manage your account. Now, I’m not suggesting you should have a huge banner which shows your account value; just make sure you don’t fall in the habit of pulling the covers over your eyes to your trading activity.
Right Side of the Monitor
The right side of the monitor should have the next time frame up you are trading. If you have not read the article on trading multiple time frames, please click this link. Since I’m using a 5-minute chart the next time frame up that is most popular for traders is the 15-minute chart. Just to be clear, the entire right side of the monitor is dedicated to the 15-minute chart. I will have the same set of indicators, just a larger time frame and longer look back period. If both my 15-minute chart and the 5-minute chart are in alignment, I have a greater chance of success. In terms of real estate you should allot one-third of the monitor space to display the chart.
Tools You Can Use to Reduce the Number of Monitors
Alarms
If you are used to trading with multiple screens you probably keep 15 – 30 charts up and you are monitoring them all. You watch each tick as the stock bounces up or down. If you have tried to monitor this many charts, it’s somewhat doable as long as the market is flat. However, if you are looking at the first hour of trading and there is a sudden sharp move in the market you will now need to actively look at all of the charts simultaneously which is virtually impossible. You can reduce the need to have so many charts on your screen by adding alarms to trigger an alert when price crosses a particular threshold.
Linking
We mentioned earlier in the article the concept of having your watch list and market movers linked to the chart. This will allow you to quickly click through dozens of charts in minutes versus typing in each individual symbol into your chart.
Widgets
Find a trading platform that has completely widgetized their application. This will allow you to display a number of tools on one chart cleanly and effectively. We offer collapsible widgets as a part of Tradingsim.
Things that clog up your Monitor
News
If you are trading the market you may feel the need to have a news feed on your symbols you are monitoring. If you are using it as a trading indicator or aid during the day, you are simply falling behind the curve. Think about it, you are going to stop what you are doing, read the news and then have enough time to digest what you’ve read, maybe do more research and lastly put on a winning trade based on your findings. How realistic does that sound?
CNBC
While I like to watch CNBC at the end of the day, I do not keep it on while trading. For starters, it is a distraction. While working a corporate job, does your boss allow you to leave on the television in your office? If you are an interior designer I bet you would love for your boss to leave on HGTV all day.
Let me try hitting this from a different angle, what exactly do you get out of watching CNBC during the day? Have you ever watched something on CNBC while day trading and it made you money? Since you are operating in a world of ticks, by the time the news makes it to CNBC’s desk you and I both know the trade opportunity has already come and gone.
Chat Rooms
Trading is probably one of the loneliest business ventures you can undertake. Unless you trade in a prop firm or lease office space with other traders, you could literally go hours without speaking to another human being. This level of isolation may lead you down the path of sitting in chat rooms or on StockTwits during the trading day. While I have nothing personally against social trading sites, the flood of information that may come from a community of traders could prove detrimental to your trading activity. I actually know a trader that has one screen solely dedicated to StockTwits. As he scans through his list of stocks, he will also update StockTwits to see what the community is thinking. Do yourself a favor and learn to run your own race; trading is a business best suited for those who aren’t afraid to walk alone.
A Ton of Indicators
If you think about it, the trader with a large number of monitors is also likely to have a large number of indicators. The funny thing about stock charts is as you add more indicators; the key items of price and volume are less visible on your screen. This means that you have to keep resizing the chart so it’s still viewable. In reality, 2 off-chart indicators is more than enough to size up a trade, but for the unsure trader he may have 6 indicators going. Well, if that’s the case, do you think this trader will be able to see anything on one chart if they open 4 or more charting windows? Of course not. So, this trader will load up on monitors so they can still have a clear view of their chart. If you don’t believe what I’m saying have a look at the picture of the guy at the beginning of this article. Notice how big each chart appears on the monitor. Next time you look at your chart, ask yourself do I really need these many indicators?
What type of Monitor should you buy?
You have a number of options to choose from when selecting your monitor. Not only do you have the choice of brand you also have to settle on a type of monitor. Monitors come in the form of CRTs, LCDs, Plasmas, and OELDs. The key thing is making sure you are able to get great resolution on the monitor (covered later in this article). So, to that point under no circumstances should you be day trading with a CRT monitor. Not only is it bad for you eyes in terms of the refresh rates, it also speaks to the lack of money you have on hand since you have such an old piece of equipment.
In terms of brand, there are a few that jump out at me: Dell and Samsung. I personally have used both over the years and have not experienced any issues.
Size of your Monitor
In order to have the 3 column setup I’ve mentioned in this article, there is a minimum size required for your screen. If you think you are going to day trade on an iPad mini, this may sound cool, but it’s highly unlikely. I’m not saying there won’t come a time where you can trade on these mobile devices, but I think it’s highly unlikely to see people successfully day trading from their iPhone while sitting in their neighborhood Starbucks.
So, how big is big enough. For me 24 – 28 inch monitor is just right. Once you go smaller than 24 and the charts start to look like spaghetti after you factor in level 2. If you go over 28 you start to creep up on the larger led models and are one level from picking up a plasma. Not to say these larger screens can’t be effective, you just run the risk of adding.
Resolution
Resolution plays a big part in the quality of your trading experience. Unlike your TV where 1080p is a must for you to even think about looking at one of the DreamWorks movies, the resolution plays a much larger part for your day trading experience. That’s because when day trading we are talking about your actual healthy – your eyes. I have written in other articles about the massive headaches I would get from looking at the chart. At times I wouldn’t be able to shake the throbbing until the next morning. A large part of that was probably the stress of having to deliver winning trades to survive, but another part of that was the quality of the screen. I would say at a minimum you need a monitor that can deliver 1920 x 1080.
Summary
In summary, the number of trading monitors you use needs to be functional. What I mean by this is you don’t need dozens of charts all printing at the same time, news feeds and CNBC blasting in the background. What you need is a clean setup that is all integrated. Remember you first start with your pre-market scans that then feeds into your market movers and watch list. At this point, you know what you plan on trading for the day. You now need this data to drive what stocks you monitor and remember to use automated alerts to minimize the amount of manual work on your part. Think what this could do for you by reducing the amount of clutter in your trading approach by going to one screen. You now may be able to break away from the confines of your home office and venture out to your deck on a nice day. Maybe you could live on the wild side and actually take a vacation and trade in the morning before everyone wakes up.
If after reading all of this you are still stuck on purchasing more than one monitor below are some good resources I was able to find on the web. I am not affiliated with any of these companies, so no hidden agenda.
http://www.tradingdesktops.com/cid-64-1/trading_monitors.html
http://www.digitaltigers.com/multi-screen-monitors.asp
http://www.samsung.com/us/business/professional-monitors/
You will notice that the Samsung monitors are the cheapest out of the links above, but they will require you to put forth the effort of setting up and configuring your own hardware. Just had to throw one more reason in there of why you really should hold off on buying more than one monitor.
As always I hope you found this article useful and good luck trading.
References
http://www.tradingheroes.com/trade-forex-in-the-bathroom/ – image reference of the man standing in front of monitors.


 Day Trading Money Management
