Having a successful trading career not only depends on the trading system or style that you use but also depends on other intangibles, such as day trading time zones.
What exactly do we mean by time zones? Well, I can tell you we are not talking about Eastern and Pacific.
You need to start thinking of the market in terms of time blocks.
If you are out here trading all day with the same strategies, you will end up over-trading and burning through hard-earned cash.
A day trader must know what time to trade. Even if a chart has a great setup, the time at which the trade is placed can have a large impact on the outcome of the trade. Well, understanding the market dynamics during different times of the day will take your trading to the next level.
Think about your trading history and notice if you see a pattern in the different times of day in relation to winning and losing percentages.
For example, many traders who are day trading breakouts will be more successful during the first hour of the day than any other time frame. Typically, breakout attempts after 10:10 am will fail and reverse which will only serve to frustrate the trader and cause you to doubt your approach to trading.
Let’s now take a look at the different time zones and understand the general market dynamics during each time block.
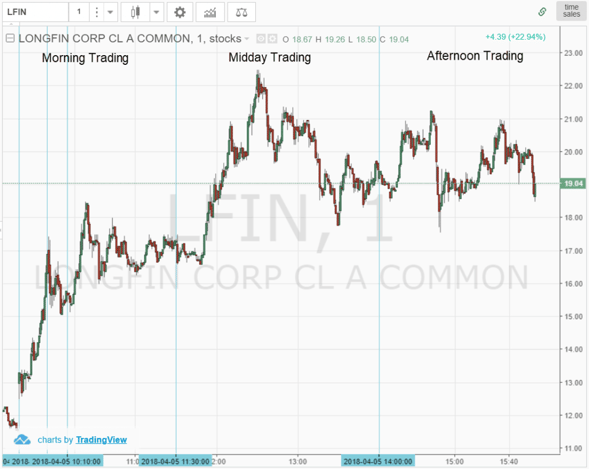
Trading Time Zones
Day Trading Time Zones
The opening bell – 9:30am to 9:50am
The first 20 minutes of the day are the most volatile of the trading day. While this is the most dangerous day trading time zone, it can also prove to be the most lucrative if you understand how to trade in this time frame. It is usually recommended that novice traders stay out of this zone and wait for the imbalances created from overnight news or earnings releases to settle down. Many technical indicators do not work well in this time frame as the volatility is too strong. In most cases, the volume will also be the highest of the day during this time.
So, how do you level the playing field to have a better shot at identifying winning trades? You need to include pre-market data.
When you look at a chart without pre-market data you may see a closing price of let’s say $10 dollars and then an opening price of $12.
You are completely blind to the trading volume and price patterns. Therefore, it’s really tough to make a buy decision when you have no idea the pattern you are trading. The lack of visibility into the pattern is not a major concern when long-term investing.
However, as a day trader, you are literally walking in the dark.
Opening Bell CharT Pattern Example
To further illustrate the point of patterns developing in the morning, please check out the below chart.
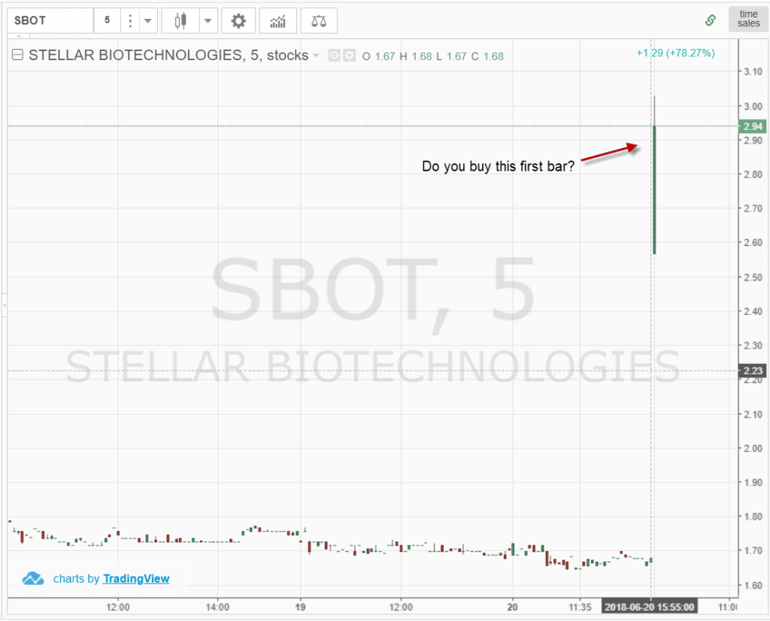
As you can see in the chart, it’s tough to say whether you should buy the opening bar. At what price do you enter the trade?
Now, let’s introduce pre-market data and a one-minute chart.
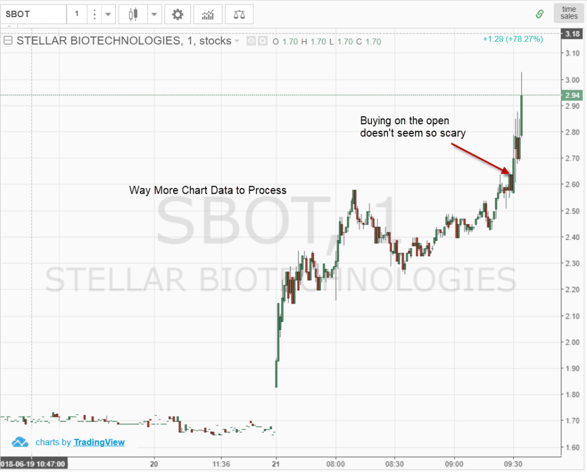
Chart Including Pre-Market Data
It doesn’t even look like the same chart. There are two things I added to the chart: (1) pre-market data and (2) a one-minute chart.
You can see the stock was making higher highs and higher lows going into the open. Next, your entry is a break of the pre-market high.
So what happened after buying the break of the high?
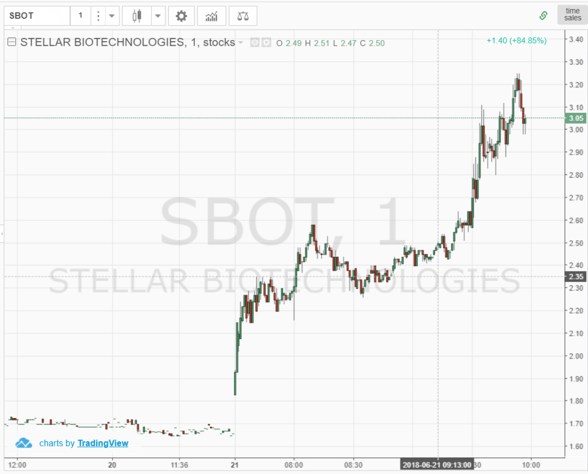
Spike High
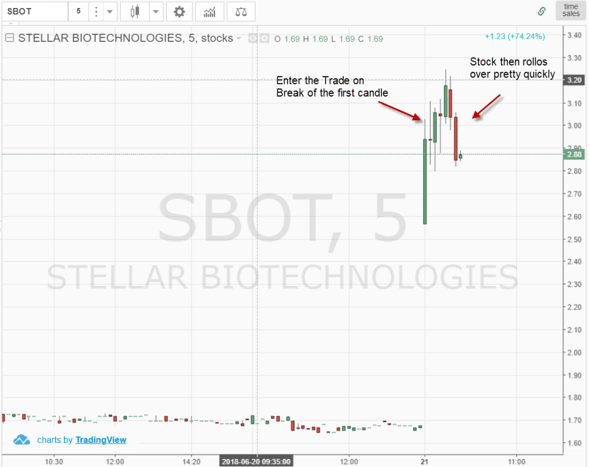
SBOT shot up to over $3.25 after entering the trade at $2.65 on a break of the pre-market high of $2.64. This represents a total gain of22.6%. I understand it’s unlikely you nailed the top but you still would likely walk away with 20% on the trade.
Now going back to our chart without pre-market data and a 5-minute chart the trade would have turned out completely differently.
For starters, if you wait until the first 5-minute bar to close before setting your buy trigger, you would have entered the trade at $3.04, and with a spike high of $3.25 you would have missed out on over 15 percent of the move.
Spike on 5-minute Chart
This brings me to my last point on this topic. As I stated at the beginning of this section, trading during the first 15 to 20 minutes of the day requires skill and discipline.
Also, I wish someone would have told me that you need to use a lower time frame of one-minute charts and pre-market data to trade the setups.
If you rely on 5-minute charts alone, you will likely get caught in a trap going into the reversal time zone.
The Morning Reversal/Continuation – 9:50am to 10:10am
The first time frame of the day where things get started is right after the opening range setups. This begins around 9:50 am and lasts for about 20 minutes.
Day traders need to pay close attention to this time frame; many traders will put on continuation trades, or buy stocks that set new 30-minute highs and short stocks setting new 30-minute lows. Other traders may look to buy stocks that have had small retracements after a large morning gap and short stocks that have had minor retracements off strong gaps to the downside.
Continuation Trades
Once the dust has settled from the opening bell, you will be able to more clearly see what the traders in this security will want to do. Volume will drop off a little bit compared with the opening 20 minutes but will still be very high during this time.
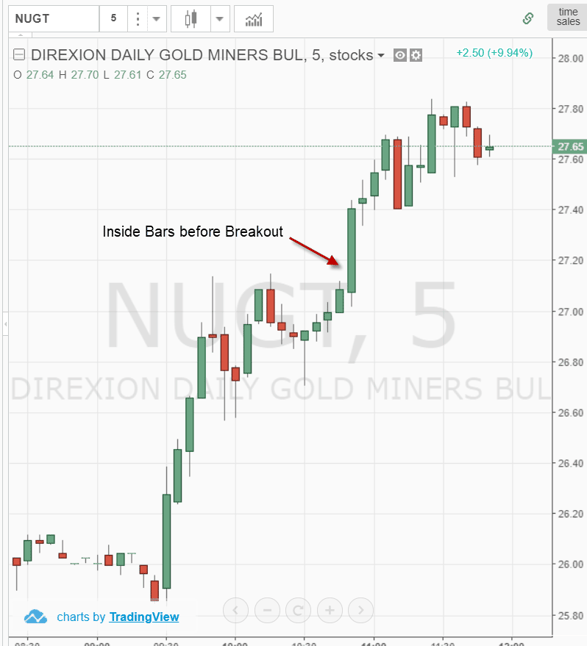
This time period is my favorite for trading as the price stability returns to the market but volatility is still present for profitable trading. In strongly trending markets, reversals may be small or non-existent. This can especially be the case when an index gaps higher on the open and continues to break to new highs during this time period.
After your stock breaks out, you will likely see two to three pushes higher before the stock peaks. This peak will often be the high of the day and the stock will then shift into the low volatility of lunch.
Breakout Trade
Reversal Trades
Just as there are continuation setups, there is an equal amount of trades that reverse. Going back to our breakout example above, notice how SBOT begin to rollover and then head lower.
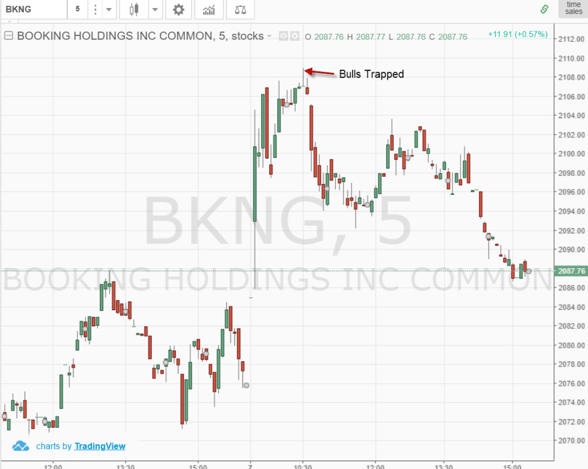
There is a fine line between finding the stocks that are going to breakout and the ones that are going to roll over. If you consistently find yourself buying right before the selloff you have one of two options.
You can first look to enter trades earlier by identifying patterns using pre-market data. Or you need to get better at identifying resistance levels and gauging when stocks have a greater likelihood of going higher.
There is no magic pill; it takes hard work building up the ability to identify winning patterns.
Again, you will need to keep a close eye on the moves in this time frame as it can lead to sharp turns lower.
I do not trade short at all. However, if you are shorting stocks this is when you will want to focus on trading opportunities.
Breakout Trade
Volatility Starts to Dry Up – 10:10am to 10:25am
During this day trading time zone, volatility shrinks again and you want to look for clues in the Dow, S&P, and Nasdaq as to the direction that the market wants to take. This is an opportune time for bigger traders to move the market the way they choose. Watch the tape of the stocks that you track for any indications of direction.
Decision Time – 10:25am to 10:30am
The market will be settled for the most part and most of the days volatility will have passed. There may have been a few reversals in the first hour but during this small zone, many traders will cash out of profitable positions and finish the day while others will position themselves for the next move in the market. I look at this period as a time for consolidation and preparation. The move following this day trading time zone can last until lunchtime.
Final Move of the Morning – 10:30am to 11:15am
This time zone will be the final major time zone as far as morning trading is concerned. It is safer in relation to the other zones in that technical indicators such as the slow stochastic or RSI will have a more pronounced effect than some of the earlier time zones. Be careful near the end of this range as it leads right into the lunchtime hour which can start early or start late. A rule of thumb is that the more volatile the preceding day trading time zone, the greater the chance that this move will extend further into the 11 o’clock hour.
Go Eat your Lunch!! – 11:15am – 2:15pm
Lunchtime trading can be brutal. False breakouts and choppy sideways moves characterize this time period. If you must trade, trade lightly until you have a good track record of putting on winning trades in this time zone.
Also, please let me know how you do it! The risk to reward is very high here.
Volume will fall out of the market as floor traders and other institutional traders will take their lunches. Don’t let this time zone turn profitable morning trading into a loss.
To be honest with you, it’s just not worth your time. I have done extensive research into my trades and after the first hour and a half, any trades I put on are just giving money back to the market.
Too Much Time Required
Beyond all the reasons we have discussed thus far, the other issue is the time required from you. Trading all day is just taxing. Remember the market can be unpredictable longer than you can exercise discipline.
If you are sitting there all day, at some point you will start to see trades that do not exist. If someone is pressing you to trade during lunch, please do yourself a favor and run.
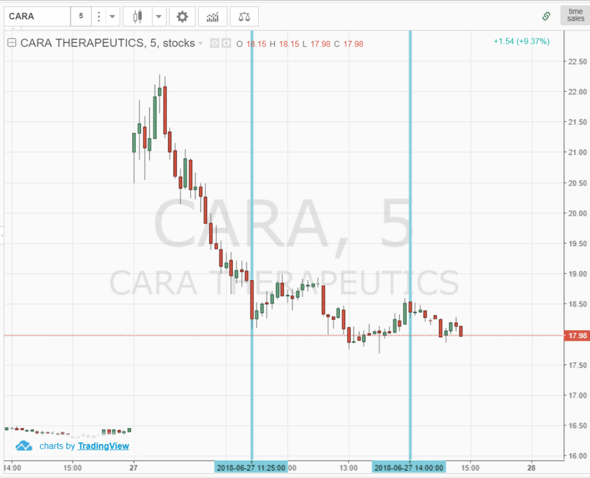
Don’t believe me? Go back and look at your charts. You will likely see a rally in the morning to a high. Then a pullback into the lunchtime zone. At this point, the stock will likely go flat to down. Then a late day rally may or may not appear. You will spend three hours of your day for a 50/50 win rate at best due to the lack of interest and market volume.
Check out these midday charts to get a feel for the lack of trading activity and price movement – it’s not worth the headache.
Flat Midday Trading
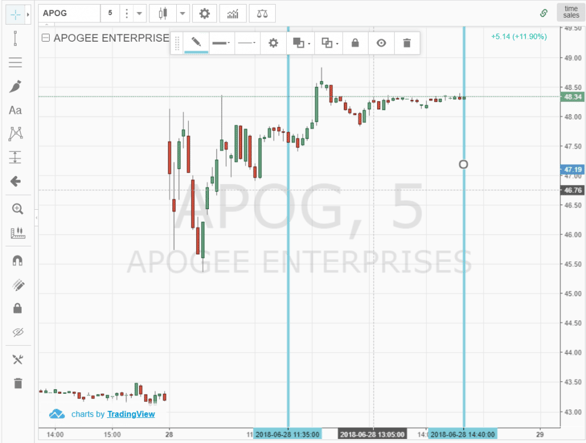
Flat Midday Trading – 2
Back to Business – 2:15pm – 3:00pm
Traders will work their way back into the market during this time frame. For the most part, trends have been established and trading during this timeframe will provide you with opportunities where the use of technical indicators is applicable. Remember, the CME closes at 3pm so you will see a pickup in volume due to some of the bond traders coming into the equity and futures markets.
It’s GO Time – 3:00pm – 3:10pm
The bond market closes and bond traders will flood the equities markets; watch for sharp moves in either direction. Moves can be fast and large.
Use Caution & Stay with the Trend – 3:10pm – 3:25pm
During this day trading time zone, use caution as you are approaching the 3:30 pm timeframe which tends to produce a reversal or a stall of the prior trend. During this zone, you want to stay with the trend that has been established from the 2:15 pm and even 3:00 pm timeframe but don’t get attached to the positions.
Portfolio Re-balancing – 3:30pm – 4:00pm
I tend to recommend traders not trade during the last half hour of the day. There are many funds and institutions rebalancing their portfolios and it can get a bit tricky. If you’re day trading, you only have 30 minutes max to get out of your trade, and I don’t like working under that type of pressure. If you’re an action junkie or like putting on very short-term trades, the volatility is there for you to do so.
Conclusion
Personally, I trade up until about 11:00 am to 11:30 am. The volatility in the morning fits my trading style. That is key; you need to understand who you are as a trader and trade accordingly.
As you can see, the chart setup or systems that you look at are not the only factor in putting a day trade on. Remember, day trading is not absolute; it is a game of odds. Your job is to put the odds in your favor and by utilizing the different day trading time zones that we have discussed, your trading will become more consistent.


 Intro to Chart Patterns
