The below video breaks down another working example of the Day Trading Cup Breakout.
This article is a review of the day trading cup breakouts strategy presented by Ken Calhoun in Stocks and Commodities Magazine. Let’s lay down the ground rules and learn how to trade the cup and handle pattern.
1. The pattern is to be used for day trading activities
2. Use 1-minute chart time frame
3. 35-day moving average
4. Two-day time frame
5. Need a cup pattern on light volume
6. The breakout needs to occur on high volume
7. The breakout must exceed the high or low of the previous day by .35% during the first hour of trading
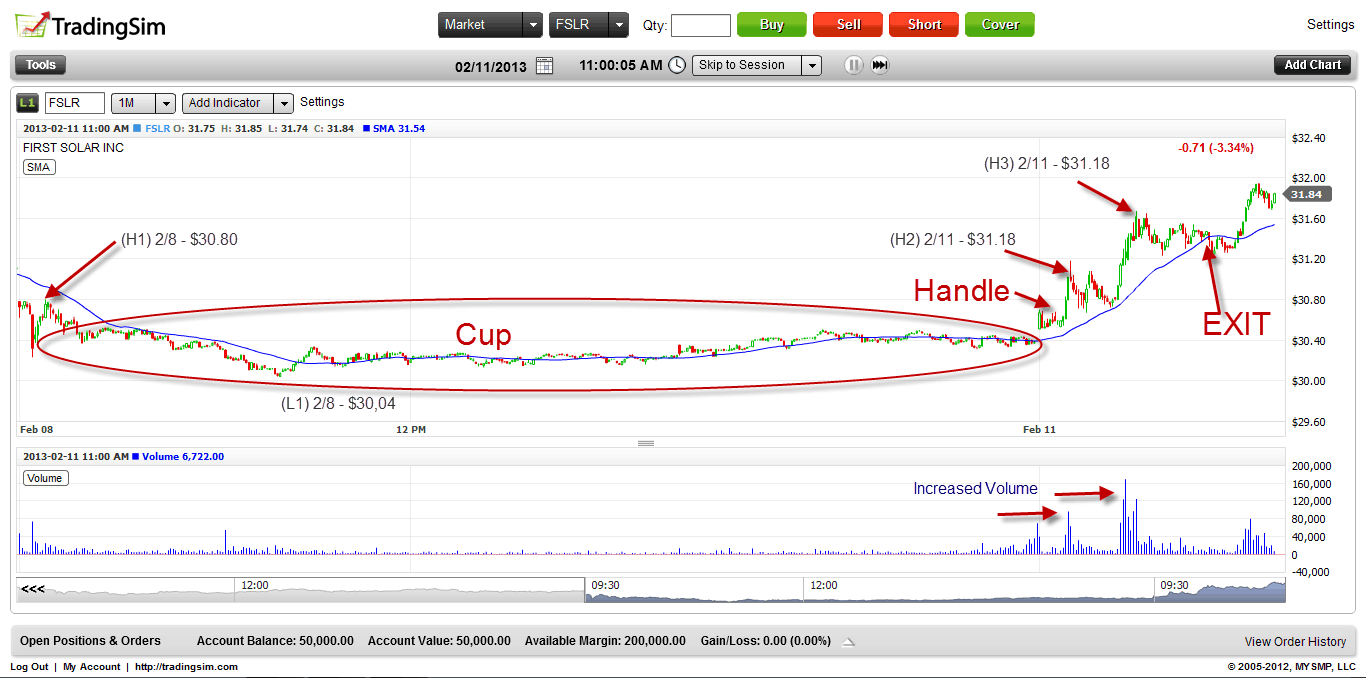
A working example of the setup can be found looking at First Solar (FSLR) from 2/11/2013. Let me first start by saying that while FSLR is not a penny stock it has pretty high volatility. I selected FSLR for this example as a means to show how a trending stock would respond to this sort of pattern.
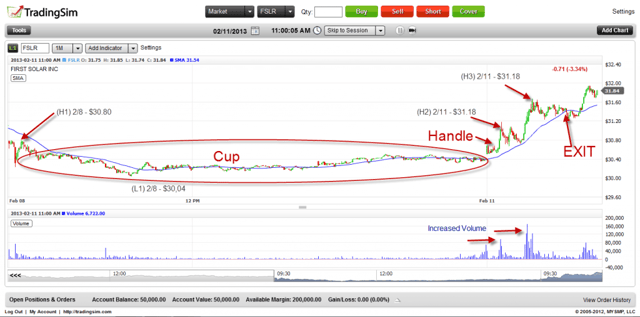
First we will want to identify the cup pattern. The cup pattern will need to have taken place the previous trading day. The larger the cup, with light volume the better. In the FSLR example you will see that the chart set the high of 30.80 (H1) at 9:40. From this high the stock floated down to a low point of $30.04 (L1) at 11:10 am and then drifted higher into the close. You will notice that the entire day had light volume. The stock also floated above and below the 35 simple moving average which is another indication FSLR was in a sideways pattern.
As we move on to the next trading day, 2/11/13, FSLR opens up in a choppy pattern for the first 10 minutes then begins to move higher with volume. In three minutes 9:40 – 9:42 the stock had a sharp 2.2% move higher. This breakout would have marked your entry point for the cup breakout strategy. Remember we need a breakout with volume that is .35% above the previous day’s high. This would have resulted in an entry point of $30.90. After a sharp move to the first swing high of $31.18 (H2) FSLR has a sharp pullback to the breakout range from the morning. The pull back did not hit the 35-day period moving average and the stock had another run to $31.67 (H3). From H3 FSLR begin to drift and the volume dropped off significantly. At this point based on the rules laid out by Mr. Calhoun the exit point would have occurred at 10:35am at the price point of $31.39.
Advanced Technique – Analyze Market Internals
One of the advanced techniques for trading the cup breakout system is to include market internals in your analysis. It is not required to enter the trade, but if the larger market is also breaking out to new two-day highs in the first hour this can add additional support to your position and reduces the odds that your stock will having a morning reversal.
Review of the Day Trading Cup Breakouts Strategy
Pros
The day trading cup breakout system keeps it simple with straight forward rules and only one indicator to follow (moving average). The system relies on volume and price action which are the oldest technical indicators you will find. Using the 1-minute chart is a great way to limit the risk of trading during the first hour of trading which is the most volatile time of the day. Lastly, the system uses a moving average as the exit which makes sense because high volume breakouts likely lead to trending markets.
Cons
The day trading cup breakout system does not provide a clear stop when the trade goes against you other than a cross of the moving average. If going into the breakout the price action is far above the price, you may end up exiting will below your entry point if the stock goes against you. While the first hour of trading provides the greatest chance for profits, it also presents the potential for risks. The other part of the system which I would find challenging during execution is the skill to know when the breakout has enough legs that using such a lagging time period of 35 periods will net consistent gains. I personally like to sell into strength with predetermined targets.
Cup and Handle Pattern Target
Simply draw a rounding line starting from the bottom of the cup and ending at the level of the right top of the cup.
The depth of this cup is the price target for your trade.
Next you want to take the depth of the cup and add this from the point of the breakout.
cup and handle price target
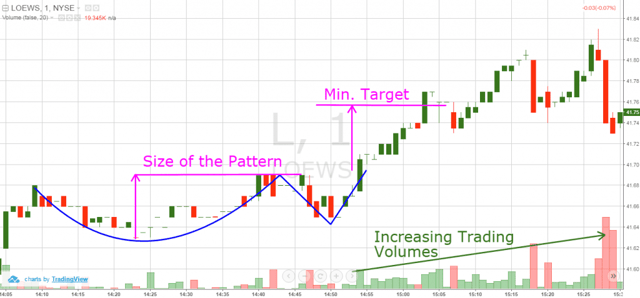
Above you see the 1-minute chart of Loews from Aug 31, 2016. The image illustrates a cup and handle pattern (blue lines). We also have the volume indicator at the bottom of the chart.
The first pink line on the chart measures the size of the cup and handle pattern. The second pink line applies this distance starting from the moment of the breakout. As you see, trading volume picks up during the breakout.
Loews was able to reach its price target 10 minutes after breaking out.
This brings up a great point, in that when you are right and I mean right, the market will go in your favor quickly. Try to resist the urge to sell when a stock moves quickly in your favor, this is likely a sign that you have a real winner on your hands.
Shifting gears back to the price target of the formation, the size of the cup is actually the minimum price target.
So, how long should you hold onto the trade?
Well in the next section of this article, we will cover how to use price action to stay in your trade to maximize profits.
Trading Cup and Handle Pattern with Price Action
Price action trading is simply using time and tested rules around supply and demand to determine how you manage your trade.
To put it simply, you keep a close eye on candlesticks, volume and trend lines.
cup and handle – price and action trading
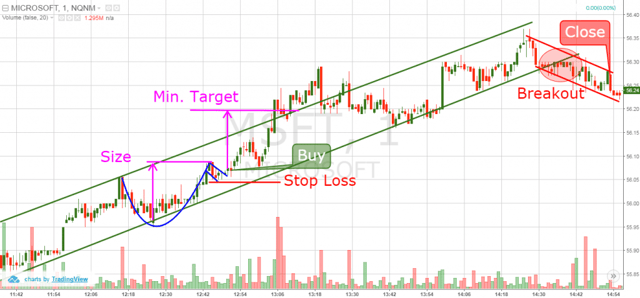
Above is a 1-minute chart of Microsoft from July 28, 2016. The picture illustrates a bullish trend with a cup and handle pattern embedded within the up channel.
The pattern is marked with the blue lines on the chart. The small blue bearish channel at the end of the cup is the handle. Our buy signal comes when the price action breaks the channel of the handle in a bullish direction.
Notice that in the moment of the breakout, the trading volumes begin to spike. This validates the signal and gives a confirmation of the cup and handle pattern.
The red horizontal line on the image depicts where we placed our stop loss order. As you can see, we positioned this order directly below the low of the handle in the formation.
See that the price continues the bullish trend afterwards. About 20 minutes after we buy MSFT, the price action has already reached the minimum target of the pattern. But the bullish trend is strong, right? The tops and the bottoms of the price action are increasing as well.
So, should we exit this long trade? Let’s use some price action rules to see if we can’t squeeze a little more out of the trade!
In order to better define the uptrend, we draw the green bullish channel on the chart.
It symbolizes the increasing tops and bottoms of Microsoft within the primary uptrend.
As long as the price stays within the boundaries of this green channel, we have no reason to sell the position.
Conversely, if Microsoft were to break through the bottom of the channel, this would represent a clear sell signal for us to exit the trade.
In the red circle on the image, we see the moment Microsoft breaks the channel to the downside.
By using price action to manager our exit, we were able to secure a larger profit versus simply exiting the position when the minimum price target of the cup and handle pattern target were reached.
Inverted Cup and Handle Pattern
As you see, the cup and handle pattern has a continuation potential.
Well, the Inverted cup and handle starts with a bearish price run which grows into a consolidation with an inverted “U” shape.
Essentially the inverted is the bearish brethren of the cup and handle pattern.
inverted cup and handle pattern
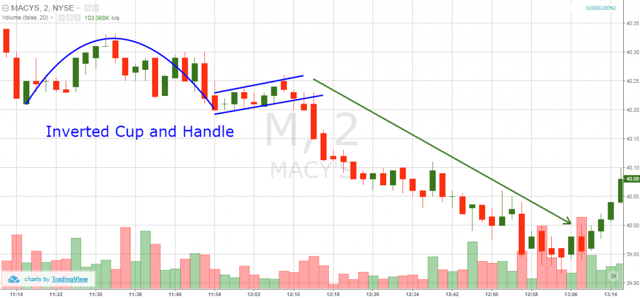
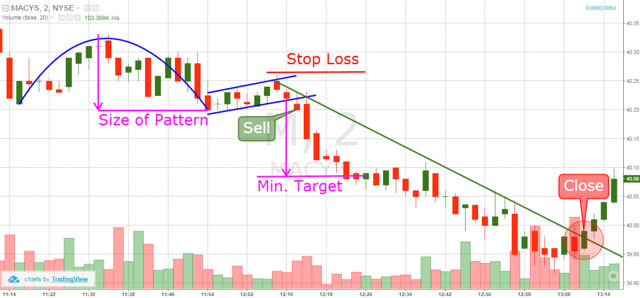
This is the 2-minute chat of Macys from August 19th, 2016. On the image above you see an inverted cup and handle pattern, which is marked with the blue line. The cup is the rounded line and the handle is that small channel trending upwards.
In this trading example, the stock enters a bearish trend, which lasts until the price action breaks the down trend later in the trading session.
inverted cup and handle trading example
Above is the same example we just discussed.
This time, we apply some trading rules on the inverted cup and handle pattern. The small blue bullish channel on the image is the handle of the pattern. This means that we need to sell the stock when the price of Macys breaks the handle downwards.
We have also highlighted where we place our stop loss order (red line) for this trade. Remember, never enter a trade without knowing where you are going to exit the position.
Now that we are in a short trade based on the bearish cup and handle, we need to measure the size of the pattern.
The depth of the pattern is represented with the pink arrow from the breakout point.
The end of the arrow is the minimum potential of the pattern.
Six periods later, the stock price completes the minimum target of the pattern; however, this is not the end of the bearish run.
The price action still demonstrates bearish activity on the chart. Therefore, we decide to hold the bearish trade for additional profits. We draw a bearish trend line (green) on the chart in order to better define the slope of the downtrend.
On the way down, the price action creates four interactions with the bearish trend. The fourth interaction actually breaks through the downtrend line.
At the same time, the trading volume increases with the disruption to the bearish trend.
This provides a validation signal that a reversal is likely occurring on the chart. Therefore, we close our short trade based on the assumption that the down run is over.
Is this making sense? It is literally the same trading methodology, but just on the short side.
Cup and Handle Stocks – 2016
Let’s now cover a few stocks that are hot in the market right now. If you are reading this article, years after it was first published, please keep reading. The markets only repeat themselves, so what we cover for 2016 will be just as applicable in 2050.
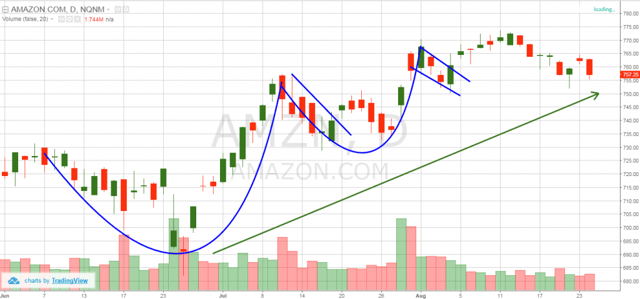
Amazon – cup and handle pattern
Above is the daily chart for Amazon.
The image illustrates the general bullish trend of the stock and as you can see, there are a couple of cup and handle patterns.
The first cup and handle is pretty large and develops between June and mid-July, 2016. The second pattern is smaller and develops between June and the beginning of August.
Although the price started a bullish move after the creation of the first pattern, its target is not reached.
The second pattern looks like it is confirmed, but the price does not have that breakout moment.
You will want to keep a close eye on the low of the most recent handle. If this low holds, all indicators point to higher prices in the future.
The next cup and handle example is with the stock Intel.
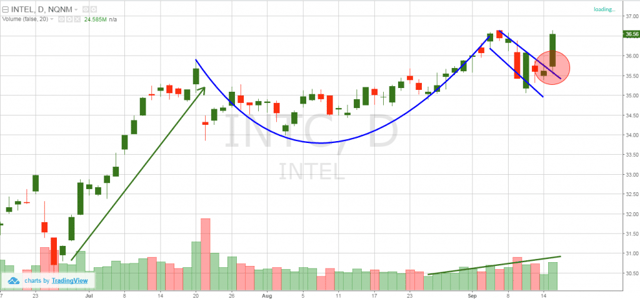
Intel – cup and handle pattern
The chart illustrates a bullish trend followed by a consolidation. The consolidation on the chart resembles a cup and handle chart pattern.
The scenario on the chart is a classic cup and handle bullish pattern. Notice that the volume during the creation of the pattern is light.
Then as Intel comes out of the cup, you can see the volume increasing almost on a daily basis.
Time will tell if this breakout will hold and if so, Intel shareholders should be in for a good ride.
The last stock for 2016 we will review is Mastercard.
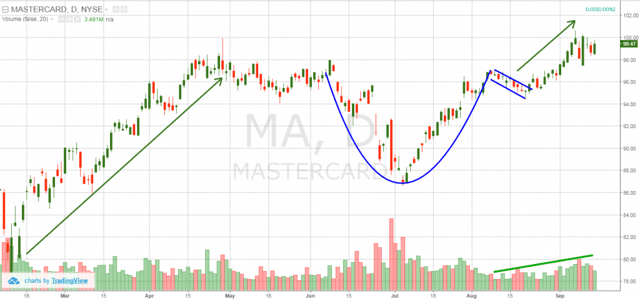
Mastercard- cup and handle pattern
The image illustrates a bullish trend, followed by a consolidation with a cup and handle. We have the standard “U” shape formation, followed by the small bearish channel – the handle. Then the price broke upwards with an increase in volume.
However, the price action has only completed less than half of the profit target.
For this reason, we will need to keep a close eye on Mastercard to see if the stock is able to make a run through the end of the year.
Conclusion
- The cup and handle is a continuation chart pattern.
- The pattern itself represents a consolidation between two trends in the same direction.
- The body of the pattern resembles a “U” shape and the handle looks like a channel in the direction opposite to the trend.
- Day trading cup and handle pattern rules are:
- The 1-minute chart is a good time frame for trading the cup and handle.
- The 35-period SMA is a great tool for monitoring trend health.
- Use a 2-day time frame.
- A valid pattern will most likely be formed during low or decreasing volumes.
- The breakout usually occurs with an increase in volume.
- The price push needs to go above the high/low of the previous day.
- The cup and handle pattern target equals the size of the pattern itself.
- Use price action to extend your profit potential:
- Open your trades when the price breaks the handle of the pattern.
- Place a stop below the lowest point of the handle.
- Stay in the trade for the size of the pattern at least. You can always extend your target by using price action rules.
- The opposite equivalent to the cup and handle is the inverted cup and handle:
- It is a bearish pattern.
- The body of the pattern looks like an upside down “U”.
- The handle looks like a small bullish channel.
Transcript of Day Trading Breakout Video
Hello everyone this is Al Hill, co-founder of Tradingsim.com. To simulate the lesson that we are going to cover in this video visit tradingsim.com or give us a call at 888.610.2734.
Hello everyone this is Al Hill from Tradingsim.com. Today we will be discussing the day trading breakout cup strategy ass presented by Ken Calhoun. Before we get started you will need to configure your chart in order to size up the trade. First you will want to adjust your chart to a 1-minute time frame. Secondly you wil want to select a simple moving average of 35 periods. Third on your list you will want to add volume to your chart. At this point you are now ready to trade the market with this pattern. So, in this example here let’s pause it for a second. On February 11th if you look at this chart FSLR in the afternoon had a pretty flat day. The stock began to drift sideways here. Now when you see a number of cup patterns repeating themselves that is a clear indication you are in a sideways market. You will see the stock begins to just go up and above the 35-period average without a care. So here you will see the volume is somewhat higher here on this bar which is the start of the cup and the high of this bar is $32.58. The stock then goes into a lull and makes a low here and then comes out of it here. You will see the volume start to pick up in here. At this point the stock makes a handle which is this tight formation here. The handle is another way of saying a flag if you will. So at this point you have the actual formation, the cup formation from the previous day . You have a high of $32.58. So based on Ken Calhoun’s method you will want to buy the breakout of the previous day’s high which is $32.58 within the first hour of trading and it has to come with higher volume and it has to be .35% higher. You can see the volume is coming in here with First Solar. We will want to buy a break of $32.69. Alright so let’s skip forward to see how that would have played out. As we skip to midday you will see the stock broke out with volume. You will see it here. $32.69 was exceeded within 2 minutes of the open. FSLR then just kind of went up made another high came back down tested the 35-SMA and here it actually closed below it. So, here is where we would have exited the position at $33.07. In this example of First Solar it went higher, but this is the market it could have just as quickly gone lower. This is the day trading cup breakout strategy. Please visit Tradingsim.com to simulate this lesson. Thank You.


 Trend Indicators


