Emerging markets and China have become increasingly popular among investors over the past decade especially as growth in the developed countries started to slow.
Back then, the emerging market economies alongside China became the main drivers of global economic growth, making them one of the hotbeds of investment in a world that was otherwise devoid of growth.
According to a study in 2013, it was estimated that over 70% of the global growth over the next 5 – 10 years would come from the emerging markets among which, China and India accounting for nearly 40% of that growth.
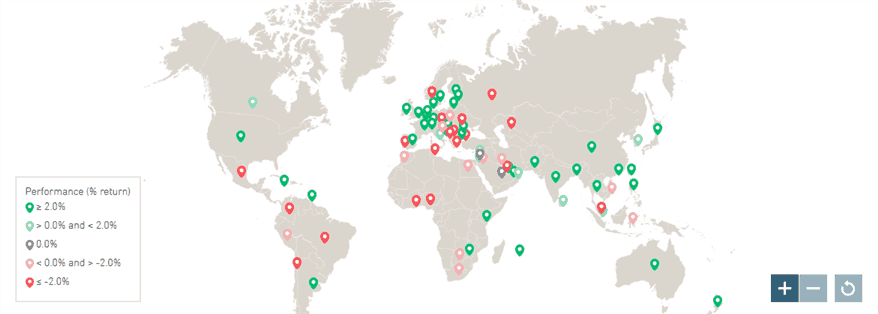
MSCI Single Country Index Return (5-year). Source – MSCI.com
While growth from China and other emerging markets grew rapidly during the height of the financial crisis, growth was seen slowing since the advanced economies started showing signs of recovery and weaning off the monetary stimulus programs.
The question now is as the U.S. and rest of the advanced economies head towards policy normalization, will the kind of growth that was considered impressive from China and emerging markets be maintained and more importantly if China will continue to outperform its peers.
The rise of China and emerging markets for investors
The shift in the growth dynamics occurred during the 2008 global financial crisis. Back then, as the economic cycle drove to a standstill, growth from China, India and Brazil kept the markets going.
The 2008 credit crisis was one of the longest and most painful in recent history, which took down the likes of Lehman Brothers and required the intervention of the U.S. government as well as the central banks of the developed economies which had to inject liquidity into the system.
While the 2008 crisis put the brakes on the economic prospects among the developed economies, it was blessing in disguise for emerging market economies, which finally got a chance to stand out on the global pedestal.
It was since 2008 that investors started to take notice of the emerging markets as their growth rates and economic advances meant that investors finally had something worth their investment.
Besides the growth factors, one of the biggest factors that worked in the favor of the emerging markets was the working age population. While in the developed economies, the aging population was expected to increase over time and thus reduce productivity, it was the opposite with the emerging market population.
Countries such as India and Brazil could boast of a higher working age to retired ratio compared to the advanced economies. It is estimated that by 2030, most of India’s population will be under the age of 44. Meanwhile, China’s population is estimated to have reached the peak.
A higher proportion of retirement age population means increased burden on the government, which will have to spend more on social welfare, which is quite prevalent in the developed economies. This could be worsened by the fact that the working age group isn’t increasing by the same proportion which could lead to potential slowdown in the developed economies.
One of the biggest contributing factors that led to the sudden surge, especially after the 2008 global financial crisis was that the emerging markets received large inflows and according to a research report by the IMF, eight out of 10 large emerging markets were the biggest beneficiaries of the funds.
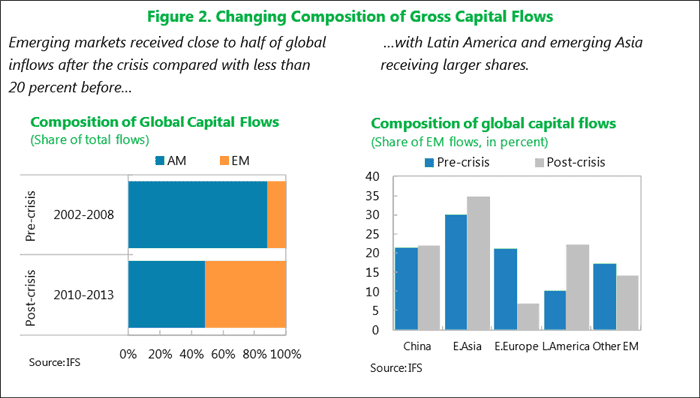
Global fund flows to emerging markets including China, Asian and Latin America (Source – IMF, IFS)
The Trump-effect and emerging markets
To say one thing or another would be a premature assumption on how growth from the emerging markets including China will turn out to be. So far, President Trump has shown that he means business as far as implementing some of his election campaign promises.
This raises the stakes that the president could continue with his oft-talked about bringing jobs back to America and participating in trade deals where America benefits. The significant shift under the new U.S. administration has no doubt sent the markets to be cautious.
However, with China making a conscious effort to move away from its export dependent economy, it is quite likely that the protectionist policies from President Trump could have a limited impact than expected.
What are the top emerging markets ETFs?
One of the criteria for the top ranking emerging market ETFs is that the funds need to have large assets under management (AUM) to avoid the risk of closure, not to forget the fact that the ETFs need to be liquid enough for investors.
While there are over a hundred different ETFs, here are the biggest emerging markets ETFs.
iShares MSCI Emerging Markets ETF (EEM)
Starting with the giant, the iShares MSCI Emerging Market ETF is one of the biggest, boasting on average of over $20 billion in assets under management.
This ETF has also been around since 2003 adding to its reliability. The EEM has a rather high expense ratio of 0.67% but it makes up for in the spreads, which are about 0.03%. There is also a significant share of the options market for this ETF, which is one of its main selling points.
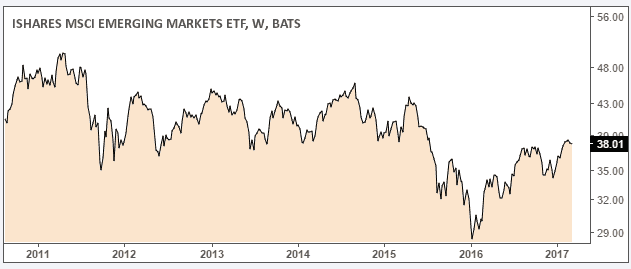
iShares MSCI Emerging markets ETF (EEM)
The iShares MSCI Emerging markets ETF tracks the markets from Hong Kong, South Korea and Taiwan and one of the unique aspects being that the index is reliant on economies that are dependent on export. The ETF tracks the large cap stocks from the above markets.
The iShares MSCI Emerging Markets ETF came under pressure during the periods of 2015 – 2016.
The SPDR S&P Emerging Markets ETF (GMM)
The SPDR S&P Emerging Markets ETF was launched in 2007 and covers specific markets such as India, Brazil, Mexico and China, which are a majority of the BRICS nations.
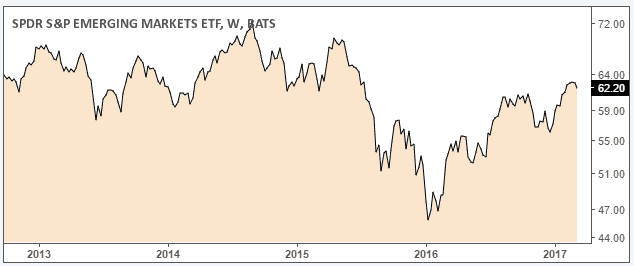
SPDR S&P Emerging markets ETF (GMM)
Thus, investors who prefer exposure to the BRICS nations will find the GMM ETF attractive. However, the SPDR S&P Emerging Markets ETF is not a trader’s ETF, meaning that the spreads are wide and the total assets under management are just over $308 million.
The GMM has an expense ratio of 0.59% and the ETF covers a mix of small cap and mid-cap companies. There are about 600 holdings in the GMM ETF.
iShares MSCI India ETF (INDA)
The iShares MSCI India ETF gained prominence after the slowdown that hit China’s economy since 2015. The slowdown gave investors reasons to look elsewhere, eventually leading to this ETF.
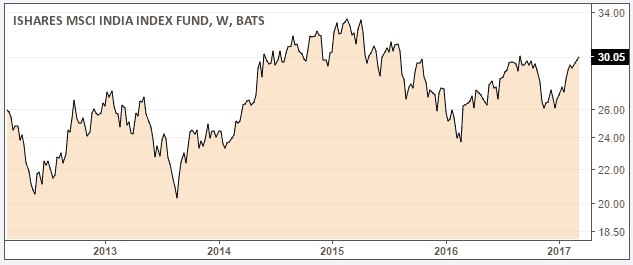
iShares MSCI India ETF (INDA)
The INDA ETF is relatively new, having been launched in 2012 but the ETF managed to expand quite quickly boasting of $4.25 million in assets under management.
The INDA ETF has an expense ratio of 0.68%. Investors prefer the INDA ETF as it offers exclusivity to the Indian markets, which usually finds itself clubbed with other emerging markets or with China as well.
However, the INDA ETF has around 70 components that it tracks but the portfolio is somewhat concentrated to the top 10 holdings which include a mix of financials, automobiles, pharmacy and technology companies.
The iShares Latin America 40 ETF (ILF)
The iShares Latin America 40 ETF was launched in 2001 and tracks the performance of the S&P Latin American 40 index, which is composed of the 40 large cap stocks.
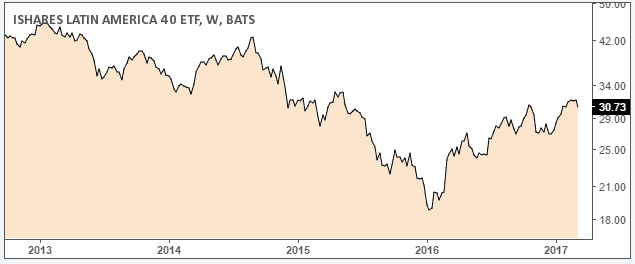
iShares Latin America 40 ETF (ILF)
The allocation here involves 47.04% from Brazil, 34.96% from Mexico, 11.4% from Chile and 4.13% from Peru. Among the allocations, the financial stocks make up for the biggest share, at 32.27%, followed by the rest.
The ILF ETF has an expense ratio of 0.49% with $10.65 million in assets under management. While compared to China or other Asian focused ETF’s the ILF has generated lower returns, the fact remains that it offers investors the choice of investing in emerging markets that are not concentrated to one region geographically.
Direxion Daily FTSE China Bull 3X ETF (YINN)
The Direxion Daily FTSE China Bull 3X ETF is a leveraged ETF as the fund aims to beat the China 50 index by 300%. The YINN ETF is high risk as it tacks the 50 biggest companies from China that are trading on the Hong Kong Stock Exchange.
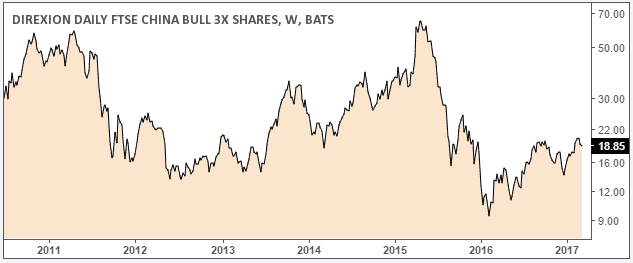
Direxion Daily FTSE China Bull 3x ETF (YINN)
The YINN fund was established in 2009 and has an expense ratio of 0.95% and has a one year return of over 100% (considering that it is a leveraged ETF). Over a 3-year period, the YNN however has a negative 4.74% return.
For investors who want a pure exposure to China with the option of leverage, the YINN is an ETF to consider.
Emerging markets outlook, 2017
It is expected that the developing economies will continue to see another good year in 2017, having logged returns of 17% the year before. This came despite the fact that the U.S. Federal Reserve started with its tightening cycle, which famously led to the taper tantrum in 2013.
However, over the longer term horizon, the returns from the emerging markets including China weren’t that impressive.
On average the emerging market equities returned about 2.5%, which was more or less around the ball park figure of what a 30-year Treasury bond yields currently, and not to forget the fact the safe haven demand for the bonds.
When looking at where to invest beyond the shores of the U.S., it is clear that emerging markets offer a better bet, compared to that of China. Despite being the largest economy among the emerging markets and the world’s second largest economy, China’s stellar growth figures have been steadily declining.
This is in part due to the transition phase from shifting from an export oriented, manufacturing hub to an economy that is more consumers driven. Growth, as of 2016 was recorded at 6.8%, slower than the 7.3% GDP growth registered in 2014.
Just a few weeks ago in early March, the Chinese government set a growth target of 6.5%, with the government already warning that the country must prepare for slower pace of growth.
This brings us to the question of which of the emerging market ETFs will be the most attractive for investors. With the Fed’s tightening cycle going steady and the conviction rising that the central bank will continue with its three rate hikes this year, sentiment among the emerging market ETF’s has soured to say the least.
India is a name that constantly comes up in the outlook for emerging markets, followed by South Africa. The recent economic changes and the implementation of new common tax are being seen by many experts as the right way for the economy.
Among the different ETFs which track the Indian markets, the iShares MSCI India ETF (INDA), Market Vector India Small-cap ETF (SCIF) and PowerShares India ETF (PIN) are expected to be well positioned to ride the high tide.
The chart below shows a comparison between the YINN and the INDA ETF.
| |
YINN |
INDA |
| Index |
FTSE China 50 index (300%) |
MSCI India Index |
| Expense Ratio |
0.95% |
0.68% |
| Inception year |
2009 |
2012 |
| AUM |
$126M |
$4.24B |
| YTD Return |
25.83% |
12.09% |
| 1 Year Return |
56.82% |
17.36% |
| 3 Year Return |
-13.98% |
22.64% |
| Beta |
3.18 |
1.03 |
| P/E Ratio |
9.54 |
20.66 |
What are the different risks from other emerging market economies?
Overall, the emerging markets are showing significant shifts and one that is very mixed.
For example, Russia and Brazil are just seen coming out of a recession while accelerating growth from other emerging markets are seen as an offset to the slowdown from China.
One of the reasons why emerging markets will remain in favor (although soured) is the fact that valuations still remain low. Investors can focus on ETF’s which have a strong preference for large cap stocks that driven by domestic growth, which will be a good way to offset any nasty surprises from the Trump administration later on.
While China might be experiencing a slowdown, the economy is still a major player among the emerging markets and thus it is not uncommon to find that China still plays a big role when it comes to emerging market ETF’s.
Furthermore, conventional wisdom suggests that it is always better to pick an ETF that has a balanced portfolio compared to picking an ETF that is heavily concentrated to one particular emerging market economy.
Because political upheavals, inflation, domestic policies can be changed rather quickly compared to the developed economies, the risks emanating from having too much of concentration to a particular emerging market economy can be a very risky affair.


 alibaba
